DOI: http://dx.doi.org/10.26483/ijarcs.v9i1.5234
Volume 9, No. 1, January-February 2018
International Journal of Advanced Research in Computer Science
RESEARCH PAPER
Available Online at www.ijarcs.info
ISSN No. 0976-5697
PREDICTING STUDENT PERFORMANCE OF DIFFERENT REGIONS OF PUNJAB
USING CLASSIFICATION TECHNIQUES
Rajni Garg
Assistant Professor
Deptt: Computer science, Guru Nanak College, Moga, Punjab, India
Abstract: Education is a key factor for achieving a long-term economic progress. Although the educational level of punjab has been improved in the last decades. But results can be more improved if little attention is paid .As competitive environment is prevailing among the academic institutions, challenge is to increase the quality of education through data mining. Student's performance is a great concern for academic institutions. To cope up with problems of education institutions, data mining techniques can provide solution and smooth functioning of data mining in best possible manner. These classification methods will be useful to identify the weak students and help them to score better marks. A variety of algorithms like C4.5, ID3 and CART can be applied to the study. In this study, C4.5 algorithm is applied on Student of different colleges of Punjab to predict their performance in the final examination. This algorithm is predicted whether the student is going to pass or fail in the final examination. If the outcome of this test is predicted as failure then extra earlier effort can be provided to the student which will improve his result. In context of result preparation various issues of Marks input, manipulation, retrieving and handling for proper analysis is done, through which next session planning is possible. The study has proved that the prediction algorithm helps to achieve better results.
Keywords: Educational data mining; Decision tree; C4.5 algorithm; WEKA; Malwa region; Ranker algorithm.
1. INTRODUCTION
Data Mining algorithm such as decision trees, neural network, k-nearest neighbor and naïve bayes classification are very useful in the field of marketing, medicine, real estate, customer relationship management, financial management etc [1].
Now a days, various data mining techniques are used to discovered knowledge from the data originating from various educational institutional. This knowledge is proven to be very useful to increase quality of education [2].
A variety of technique of data mining such as association rules, classification and clustering can be used to predict various issues related to education such as enrolment of students in a particular course, drop-out ratio, Alienation of traditional classroom teaching model, detection of unfair means used in examination system conducted online etc.. Education is an essential parts of students life. Earlier prediction of results of a student can contribute to a better result because if the prediction says if the prediction says the students will fail in the examination then earlier extra effort can help him to attain his target [3,4].
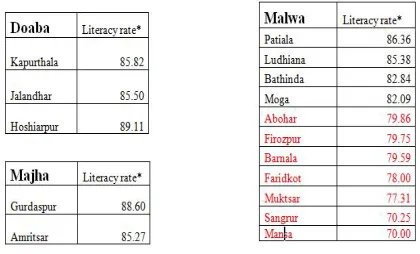
[image:1.612.325.535.412.539.2]Punjab is distributed in three regions: Doaba, Malwa and Malwa. To increase the overall student performance in Punjab it is essential to increase literacy rate of Malwa region. Literacy rate of Malwa region is not as good as other region of Punjab. In malwa region, education has little emphasis. This could be due to the existence of lager land holdings with agriculture as the main occupation. In the Doaba and Majha region, education assumes greater importance because there is a high incidence of out-migration.
Table 1: Representing literacy rate of different region of Punjab.
Effective literacy rate in cities in Punjab varies from city to city. Somewhere it is as low as 70% and somewhere it is 89.11%. Hoshiarpur district has 89.11% literacy rate which is the highest in the state. Sangrur and Mansa district has the lowest 70.25% and 70.0% literacy rate respectively. Although the educational level of the Malwa region in Punjab has improved in the last decades. But result can be more improved if little attention is paid
2. DATA MINING TECHNIQUES
research. The most commonly used data mining methods are: Association, classification and clustering.
Association: association rule is used to find the relationship between one instance to another instance [8]. In the context of our research association rule can be used to find the linking between student attribute and their result. If a student gets good marks in Higher secondary and attends classes regularly then he is most likely to pass the examination.
Classification: in classification technique the whole dataset is divided into set of predefined classes. That’s why classification is also called supervised learning [8]. For a instance student classifier classify result of students into classes like pass, fail or compartment. This technique divides the whole process into two phases. In the first phase a model is built with the help of training data and in the next phase this model is tested with test tuples and its accuracy is determined. Backpropagation. K-nearest neighbor and decision tree are good example of classification technique. In this research decision tree are used for the prediction.
Clustering: Clustering divides the dataset into different regions called clusters [8]. Cluster comes
Figure Representing clusters of student training data on the basis of marks of higher education.
under un-supervised learning because classes are not predefined. Object under one cluster have similar values and this value differs from other clusters for instance in student dataset, cluster can be generated on the basis of student marks, parent’s family income, students attendance etc.
3. DECISION TREE CLASSIFICATION
Decision tree is a classification technique which comes under supervised learning. It’s an algorithm which generates a tree like structure. The leaf nodes of the tree represents class labels and the internal nodes are decisions nodes. This tree is constructed from the training dataset where class label are known. After constructing this tree when a tuple whose class label is not known is inserted on the root and by traversing from root to leaf node class label is found for the tuple. In this study, C4.5 decision tree classifier is used. It is applied on the optimal data set.
Decision tree algorithm constructs the tree by selecting the most discriminating attribute of the training data. This attribute acts as a splitting attribute. Many criteria like gain-ratio, ginni-index, and information-gain can be used for this attribute selection. The algorithm C4.5 id used in our study uses gain ratio for its evaluation. The formula used for this evaluation is
And Gain(A)= Info(D)-InfoA(D)
Here Info(D) is the expected information needed to classify data and it is calculated by the formula:
Info(D) = -
InfoA(D) represents contribution of each independent attribute which is measured towards the dependent variable. This is done by the formula:
InfoA(D)=
In this research, optimal dataset is generated by using Gain Ratio feature reduction technique on applying training dataset. To improve results and to speed up evaluation, Gain Ratio of each independent except the dependent attribute is calculated and the last tree attribute lowest gain ratio are removed. This reduction is made on the assumption that these attribute do not contribute towards classification.
4 . METHODOLOGY
a) Generation of a data source of predictive variables: The dataset used for this study for performance analysis is taken from different colleges of Punjab. The data of 400 students is collected. Student personal and academic details along with their attendance are collected through questionnaire and response from the students.
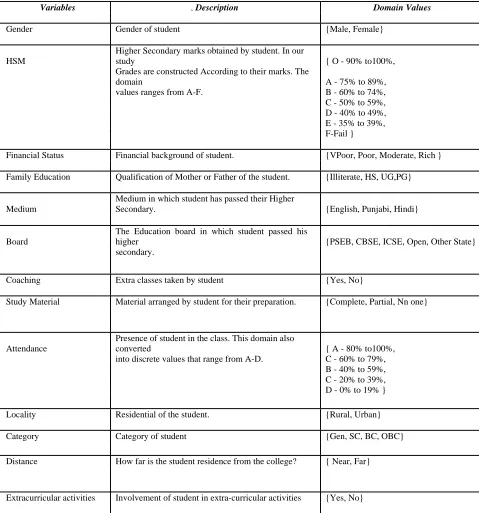
b) Identification of different factors, which affects a student’s learning behavior and performance during academic career:
Student dataset contains various attributes like Gender, Higher Secondary Marks, Financial Status, Family Education, Medium, Board, Coaching, Study Material, Attendance, Locality, Category, Distance, Extracurricular activities.
Table 2: Representing Factors affecting Student’s Performance
Variables Description Domain Values
Gender Gender of student {Male, Female}
HSM
Higher Secondary marks obtained by student. In our
study { O - 90% to100%,
Grades are constructed According to their marks. The
domain A - 75% to 89%,
values ranges from A-F. B - 60% to 74%, C - 50% to 59%, D - 40% to 49%, E - 35% to 39%, F-Fail }
Financial Status Financial background of student. {VPoor, Poor, Moderate, Rich }
Family Education Qualification of Mother or Father of the student. {Illiterate, HS, UG,PG}
Medium
Medium in which student has passed their Higher
Secondary. {English, Punjabi, Hindi}
Board
The Education board in which student passed his
higher {PSEB, CBSE, ICSE, Open, Other State} secondary.
Coaching Extra classes taken by student {Yes, No}
Study Material Material arranged by student for their preparation. {Complete, Partial, Nn one}
Attendance
Presence of student in the class. This domain also
converted { A - 80% to100%,
into discrete values that range from A-D. C - 60% to 79%, B - 40% to 59%, C - 20% to 39%, D - 0% to 19% }
Locality Residential of the student. {Rural, Urban}
Category Category of student {Gen, SC, BC, OBC}
Distance How far is the student residence from the college? { Near, Far}
Extracurricular activities Involvement of student in extra-curricular activities {Yes, No}
c) Construction of a prediction model using classification data mining techniques on the basis of identified predictive variables and Validation of the developed model for students studying in various colleges of Punjab. To apply classification data mining techniques, WEKA tool is used.
Fig. Representing Data Set in WEKA Tool
Fig: Tree constructed on the basis of gain ratio
5. RESULT AND DISCUSION:
Many factors may affect the students' performance and if that has been observed properly in advance, ways can be suggested to improve it. To categorize the students' based on the association between performance and attributes, a good classification is needed. From this study, it can be concluded that attendance of a student is the most contributing attribute towards his performance in examination. If a student is regular in college then he will perform better in exams, on the other hand his irregularity will degrade his performance. Along with attendance, family-education, involvement in extra-curricular activities and coaching are another important factor which affects student’s performance in examination.
This study also reveals that gender of student, residential and medium of student are the least contributing factor towards his performance in examination.
REFERENCES
1. V. Mongia and G. Singh “ Automatic Evaluation of Best Investment Options for Investors using Optimal Decision Tree Algorithm”, International Journal of Computer Application, vol. 96, number 20,2014.
2.
Predicting Student's Performance using Data Mining Techniques” vol. 72, 2015, pp. 414-422 doi.org/10.1016/j.procs.2015.12.157 (ScienceDirect Open Access)
3. B. Minaei-Bidgoli, D. A. Kashy, G. Kortemeyer, W. F. Punch, “Predicting student performance: an application of data mining methods with an educational Web-based system” IEEE 33rd Annual Conference on Frontiers in Education(FIE), Westminster, CO, USA, 2003
4. M.
classification techniques for predicting the performance of students academic environment “,IEEE International Conference on Communication and Network Technologies (ICCNT), Sivakasi-India, 2014
5. H. Trevor, T. Robert, and F. Jerome, The Elements of Statistical Learning: Data Mining, Inference, and Prediction, 2nd ed., vol. 2. Springer: New York, 2009, pp. 32-36. 6. N.T.Nghe, P. Janecek, and P. Haddawy, “A comparative
analysis of techniques for predicting academic performance", ASEE/IEEE Frontiers in Education Conference, pp. T2G7-T2G12, 2007.
7. M. Lichman, UCI Machine Learning Repository http://www.cs.waikato.ac.nz/ml/weka,2013