Page 1 of 10 Original Article
Respiratory parameters and acute kidney injury in acute
respiratory distress syndrome: a causal inference study
Tacyano Tavares Leite1, Cícero Abdon Malheiro Gomes2, Juan Miguel Cosquillo Valdivia2,
Alexandre Braga Libório2
1Medical Sciences Postgraduate Program, Department of Clinical Medicine, Universidade Federal do Ceará, Fortaleza, Ceará, Brazil; 2Medical
Sciences Postgraduate Program, Universidade de Fortaleza – UNIFOR, Fortaleza, Ceara, Brazil
Contributions: (I) Conception and design: AB Libório; (II) Data collection and assembly: TT Leite, CAM Gomes, JMC Valdivia; (III) Data analysis and interpretation: AB Libório, TT Leite; (IV) Manuscript writing: All authors; (V) Final approval of the manuscript: All authors.
Correspondence to: Alexandre Braga Libório. Medical Sciences Postgraduate Program, Universidade de Fortaleza – UNIFOR, 4043 Ap 1203. Fortaleza-Ceará, Brazil. Email: alexandreliborio@yahoo.com.br.
Background: Assess the respiratory-related parameters associated with subsequent severe acute kidney injury in mechanically ventilated patients with acute respiratory distress syndrome (ARDS).
Methods: Retrospective cohort, analyzing a large public database—Multiparameter Intelligent Monitoring in Intensive Care-III. Adult patients with at least 48 h of mechanical ventilation (MV), under volume controlled ventilation and an oxygenation index less than 300 mmHg were included.
Results: A total of 1,142 patients had complete data and were included in the final analyses. According to a causal directed acyclic graph (DAG) that included respiratory system compliance (Crs), tidal volume (Vt), driving pressure (ΔP), plateau pressure (PPlat), PEEP, PaO2 and PaCO2 as possible exposures related to severe AKI, only Crs and PEEP levels had significant causal association with severe acute kidney injury (AKI) (OR 0.90, 95% CI: 0.84–0.94 for each 5-mL/cmH2O reduction in Crs; OR, 1.05 95% CI: 1.03–1.10 for each 1-cmH2O increase of PEEP). Using mediation analysis, we examined whether any mechanical ventilation, blood gas or hemodynamic parameters could explain the effects of Csr on AKI. Only PEEP mediated the significant but small effect (less than 5%) of Csr on severe AKI. The effects of PEEP, in turn, were not mediated by any other evaluated parameter. Several sensitivity analyses with (I) need of renal replacement therapy (RRT) as an alternative outcome and (II) only patients with Vt <8 mL/kg, confirmed our main findings. In trying to validate our DAG assumptions, we confirmed that only ΔP was associated with mortality but not with severe AKI. Conclusions: Crs and PEEP are the only respiratory-related variables with a direct causal association in severe AKI. No mechanical ventilator or blood gas parameter mediated the effects of Crs. Approaches reducing Vt and/or ΔP in ARDS can have limited effect on renal protection.
Keywords: Acute kidney injury (AKI); acute respiratory distress syndrome (ARDS); mechanical ventilation
Submitted Aug 27, 2019. Accepted for publication Nov 14, 2019. doi: 10.21037/atm.2019.11.92
View this article at: http://dx.doi.org/10.21037/atm.2019.11.92
Introduction
Acute kidney injury (AKI) is common in critically ill patients and is associated with poor outcomes (1). Several risk factors are associated with AKI in critically ill patients including hypovolemia, sepsis, comorbidities and nephrotoxic drug exposure (2,3). Increasing evidence also
with MV in critically ill patients (8). Additionally, in a large study, it was demonstrated that both MV and ARDS were independently associated with subsequent occurrence of AKI (4).
Several experimental studies in humans and animals have explored the pathophysiological mechanisms of lung-kidney interactions, suggesting some pathways to explain the deleterious effects of ARDS/MV on renal function (9-11). First, positive-pressure ventilation may reduce cardiac output and increase central venous pressure, thereby diminishing renal blood flow, free water clearance, or the
glomerular filtration rate (12). Additionally, both hypoxemia
and hypercapnia have been associated with increased renal resistance even in critically ill patients exposed to moderate levels of hypoxemia (10). Finally, emerging data suggest that ventilator-induced lung injury may not only affect the lung
but may also lead to further systemic inflammation via the release of inflammatory cytokines (13).
Despite a body of evidence suggesting clinical and physiological interactions between ARDS and AKI, there are scarce data about respiratory and MV-related parameters effecting renal function in ARDS patients. A meta-analysis (8), including studies with different levels of tidal volume and PEEP, found no association between ventilator parameters and AKI. However, the included studies were not specifically designed to determine whether MV has an effect on renal function; therefore, a large diversity in such studies, study designs and different definitions of AKI were combined. Moreover, in some cases, it was not possible to determine from the published
material definitively whether AKI was present at the start
of MV or developed after MV was initiated. Another retrospective study (14), including patients with and
without ARDS, found no significant association; however,
this study evaluated several correlated variables in the same multivariate model, potentially leading to over-adjustment and a bias to including false cofounders.
The primary objective of this study was to assess the respirator-related parameters associated with subsequent AKI in mechanically ventilated patients with ARDS. Since MV has many correlated and mathematically-linked parameters, we chose a causal diagram approach (15,16) to better select the confounding variable and to evaluate if there are ventilatory and/or hemodynamic mediators
between MV and AKI association.
Methods
Multiparameter intelligent monitoring in intensive care III database and data collection
The Multiparameter Intelligent Monitoring in Intensive Care (MIMIC-III) project (17), maintained by the Massachusetts Institute of Technology Laboratory for Computational Physiology, contains data on patients hospitalized in an ICU at Beth Israel Deaconess Medical Center from 2001 to 2012. The database is freely available, so that any researcher who accepts the data use agreement and has attended “protecting human subjects training” can apply for permission to access the data (see Supplemental File). This study was approved by the institutional review boards of Massachusetts Institute of Technology and Beth Israel Deaconess Medical Center and was granted a waiver of informed consent.
We included all patients 15 years and older who received
ventilation for at least 48 hours on their first interval of MV and had ARDS [defined as a PaO2/FiO2 ratio <300 mmHg
in the absence of cardiogenic pulmonary edema (18)] in
the first 48 h of MV. Patients with cardiogenic pulmonary edema were identified using ICU admission diagnosis and/
or trough a Natural Language Processing (NLP) algorithm that searched in discharge summaries those whom were admitted due cardiogenic pulmonary edema or those with a left ventricular ejection fraction (LVEF) less than 40%. We performed a validation of the NLP algorithm through a formal examination of the discharge summaries of 100 random patients and a concordance of 98%. Patients were excluded from all analyses if they lacked hospital admission information, if they underwent ventilation with any modes other than volume control ventilation (VCV) for the first
48 h of MV, or if they had no plateau pressure (PPLAT)
or tidal volume (Vt) measured in the first 48 h of MV.
Data collection
All data were extracted from the MIMIC-III database (v1.4) and included demographic information (e.g., age, gender,
height), sepsis diagnosis as described by Angus et al. (19),
Elixhauser comorbidity index (20), SCr at MV initiation and disease severity score assessed by the simplified acute physiology score (SAPS II). We calculated predicted body weight using the patient’s height and sex (21). Additionally, arterial blood gas analyses in the first 48 h of MV were
evaluated and the worst PaO2, PaCO2 and PaO2/FiO2 ratio
(when PEEP was at least 5 cmH2O) were selected. We
collected daily SCr up to day 7 after MV initiation, urine output, need for vasoactive drugs, exposure to nephrotoxic drugs (amphotericin, vancomycin, aminoglycoside – median
daily doses are shown in Table S1), fluid balance before MV
initiation and need of RRT.
Exposure variables
The exposure variables were the time-weighted PEEP,
ΔP, plateau pressure (PPlat) and tidal volume (Vt) corrected
for predicted body weight [calculated using the patient’s height and sex (21)] in the first 48 h of MV. The values were calculated by averaging the available values at
each min during the first 48 h of MV. ΔP was calculated
from PPlat-PEEP. The min by min value was obtained
by carrying each observation forward until the next observation was recorded (22). The variable with the least
available values was PPlat (median 8, IQR 5–9) in the first
48 h of MV. Additionally, we hypothesized that parameters of ARDS severity were related to AKI and we also
investigated the worst PaO2, PaCO2, and PaO2/FiO2 ratio
in the first 48 h and time-weighted the average respiratory
system compliance (Crs). We calculated static compliance
from VT and ΔP (VT/ΔP). The time-weighted averages
for both variables were calculated by averaging the min by min values as already described. The other collected variables were included as confounders in predicting AKI (baseline SCr, age, gender, sepsis, SAPS II, need for vasoactive drugs, fluid balance before day 1 of MV and exposure to nephrotoxic drugs). Additional analyses were performed in 2 nested subcohorts with available central venous pressure (CVP) and mean pulmonary artery pressure (PAP). In these patients, time-weighted CVP, mean PAP and mean systemic arterial pressure (SAP) were
calculated as specified above to evaluate if hemodynamic
parameters that could be modified by MV would act as
mediator in the causal association between exposure and outcomes.
Outcomes
Severe AKI was defined according to the Kidney Disease Improving Global Outcome (KDIGO) criteria (23) stage II or III using SCr and urine output criteria. Briefly, SCr levels were used to classify AKI stage, since our objective was to evaluate the effects of ARDS and MV on renal function, the SCr before or after 12 h of MV initiation was
used as baseline renal function. We classified patients based
on the KDIGO maximum stage achieved during the first 7 days after MV. Patients who received RRT during this period were considered as AKI stage 3. Urine output was assessed every hour. We used the urine output criterion for patients with at least 12 consecutive hours of valid output measurements. In patients with insufficient urine output measurements, only the SCr criterion was applied. Additionally, 28-day mortality was evaluated to validate
our data collection and our model. We expected to find an
independent association between ΔP and 28-day mortality
in these patients.
Directed acyclic graph
Since MV parameters have many correlated variables and
mathematical linking (for example, Crs is calculated from
VT and ΔP; PPlat is the sum of ΔP and PEEP), to avoid
over-adjustment of the model and permitting the exploration of the total and mediated effect of each exposure variables, we performed a directed acyclic graph (DAG) using the
dagitty tool - www.dagitty.net (24). Briefly, a causal diagram
is a graphical tool that enables the visualization of the relationships between the exposure of interest, the outcome being studied, and all other variables that are associated in some way with at least two other variables in the diagram. DAG is a special form of causal diagram that does not contain any directed cycles. A comprehensive review can be found in recent reviews (15,16).
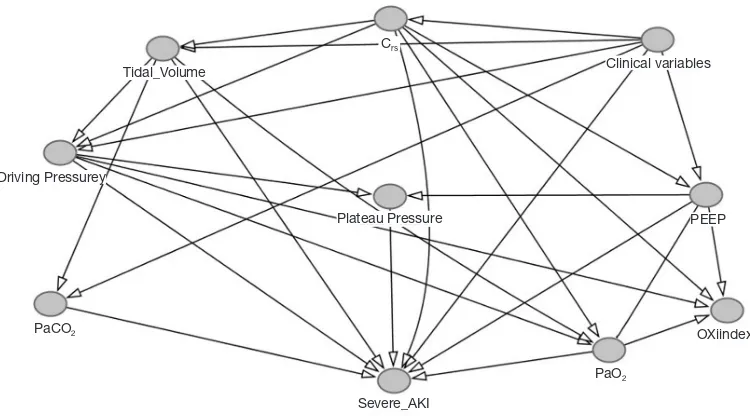
In our DAG construction (Figure 1), we had the
following assumptions: (I) because we studied only the first 48 h of MV, we assumed that all respiratory and blood gas variables could be influenced by lung disease
severity, here represented by Crs (i.e., PaO2, PaCO2,
PEEP, Vt, PaO2/FiO2 and ΔP could be, at least partly, be
determined by Crs); (II) all other clinical variables (age,
MV, baseline renal function, SAPS II, nephrotoxic drugs, vasoactive drugs and sepsis) were each one independently considered confounders of all considered exposures in the causal association with severe AKI. This assumption is based on previous knowledge (for example, presence of sepsis can be associated with both respiratory and renal failure) or in the absence of data supporting the exclusion of any possible association, i.e., it is impossible to exclude the association of nephrotoxic drugs and a higher PEEP, even a third unmeasured confounder, like severe lung infection, for example. Additionally, (III) if possible, if relationships between two variables were bidirectional, they were modified according to evaluated exposures, making them real confounders. These interactions are represented in Figure 1 as connectors without arrow. Finally, (IV)
all respiratory related variables, except for PaO2/FiO2
ratio, were considered potential causes of severe AKI (see
Supplemental file). The variables included in the adjustment
of each exposure are described in the Table S2.
Statistical analysis
Normality of the data was assessed, and are reported as the mean and standard deviation (SD) or median and IQR (25th–75th percentiles), when appropriate. Baseline
characteristics were compared using a 2-sample t-test or
Mann-Whitney test for continuous variables, whereas
dichotomous variables were assessed with χ2 test or Fisher’s
exact test. Simple correlations between continuous variables
were analyzed using Spearman’s rank correlation coefficient.
Non-normal distributions were natural log-transformed for additional analysis. First, we evaluated the total effect of each exposure on severe AKI using multivariable logistic regression. If there was any significant causal association between the exposure and severe AKI, we evaluated possible mediators to determine if such an association was, at least partly, mediated. In the mediation analyses, we used conditional mean models for nested counterfactuals outcomes with an imputation-based approach. We used R
program 3.5 to run analyses using the Medflex package (25).
Results
Population characteristics
The MIMIC-III database contains the records of 46,520
patients, of which 38,605 were aged ≥15 years at the time
of admission. Of the 5,226 patients who received MV for a minimum of 48 h, 3,147 received modes of ventilation other than VCV in the first 48 h of MV, had cardiogenic pulmonary edema or a LVEF less than 40% and were
Tidal_Volume
Driving Pressurey
PaCO2
PaO2
Severe_AKI Plateau Pressure
Clinical variables
[image:4.595.110.485.85.293.2]OXiindex PEEP Crs
excluded. In addition, 108 patients were excluded because there were no arterial blood gas analyses available in the
first 48 h of MV. Of the remaining 2,028 patients, 1,750 had
the criteria diagnosis of ARDS. Additionally, 453 patients were missing a height measurement, 67 patients had a SCr at MV initiation greater than 4 mg/dL and 31 other patients
lacking MV parameters (see Figure 2) were excluded. After
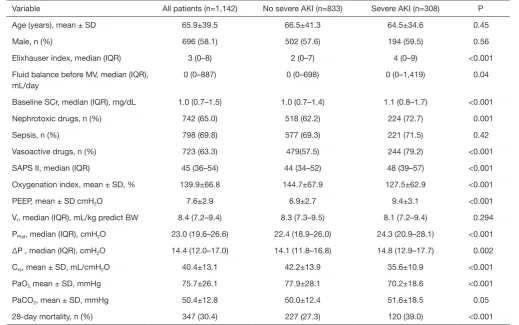
all exclusions, 1,142 patients were included in the final analyses. Characteristics of these patients according to
severe AKI development are shown in Table 1.
Causal association between respiratory-related parameters and severe AKI
Using our DAG assumptions (Figure 1), we adjusted
respiratory-related exposures to different real confounders to determine if there was a causal association between considered exposures and severe AKI. As stated in the methods, all non-respiratory clinical variables were used in adjustment of all exposures. A complete list of adjusted
variables for each evaluated exposure is shown in Table S2.
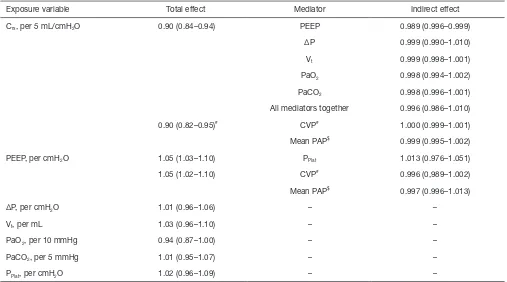
After evaluating all respiratory-related exposure variables (Table 2), low Crs and high PEEP levels had significant causal
association with severe AKI. Each 5-mL/cmH2O increase
in Crs reduced the chance of severe AKI by 10% (OR 0.90,
95% CI: 0.84–0.94), and each 1-cmH2O increase in PEEP
increased the chance of severe AKI by 5% (OR 1.05, 95%
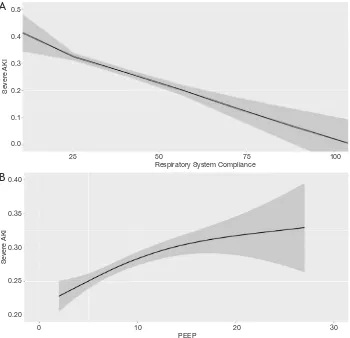
CI: 1.03–1.10), as shown in Figure 3. Additionally, low PaO2
had trends in causal association with severe AKI, as shown in Table 2. Although ΔP has recently been associated with mortality in ARDS patients, even using a parsimonious
model considering our assumptions, ΔP was not associated
with severe AKI. Additionally, PPlat and Vt had no significant
causal association with severe AKI.
Direct and indirect effects of Crs and PEEP on severe AKI
To further explore the associations between respiratory-related variables and severe AKI, we explored if the causal association between low Crs and high PEEP on severe AKI had any mediators. According to our assumed DAG, effects
of Crs on severe AKI could be, at least partly, mediated by
PEEP, Vt, PPlat, ΔP, PaO2 and/or PaCO2. From these, we
could identify only PEEP as having a significant mediation
effect on the causal association between Crs and severe AKI.
Although significant, the indirect effect through PEEP was
minimal. Moreover, even including all possible mediators
in the same analyses, the large effect of Crs was direct,
as shown in Table 2. We also examined whether the PPlat
mediated the effects of PEEP, but we could not identify any
significant mediation.
In two nested subcohorts, we further tested if CVP (n=872) or mean PAP (n=475) could mediated the causal
association between low Crs and high PEEP on severe AKI.
We did not identify any significant mediation of these hemodynamic parameters on the causal association between
Crs and severe AKI—see Table 2.
DAG validation and sensitivity analyses
Because our findings rely upon DAG assumptions, we performed additional analyses. First, we sought to replicate
Figure 2 Patient distribution in the MIMIC-III database and exclusion criteria. ARDS, acute respiratory distress syndrome; SCr, serum creatinine; Vt, tidal volume; PPlat, plateau pressure; PEEP, positive end-expiratory pressure.
Admission age≤15
7,915 MIMIC-III46,520
ARDS 1,648 Adults 38,605
Final cohort 1,142 Mechanical ventilation for
48 h 5,226
missing height 206 no arterial blood gas 108
SCr >4 mg/dL 67 Missing Vt 8 missing PPlat 18 missing PEEP 1 incompatible values 4
Other modes of mechanical ve ntilation
2,788 Cardiogenic Pulmonary
the recently demonstrated causal association between ΔP
and mortality using our suggested DAG. Although ΔP had
no causal association with severe AKI, no other
respiratory-related variable, except ΔP, was independently associated
with 28-day mortality, confirming data and precision
from a previous study by Amato et al. (26), as shown in
Figure S1. Additionally, because ΔP is highly associated with
mortality and mathematically linked with Crs, we considered
an alternative pathway: after adjusting for other clinical
variables and Vt, we tested the effects of ΔP on severe AKI
with Crs as a potential mediator. There was no significant
direct effect of ΔP on severe AKI and almost all effects from
ΔP were mediated by low Crs, as shown in Figure S2.
Additionally, we performed two additional sensitivity
analyses to determine whether Crs and PEEP maintained
their significant causal association with outcomes. In the
first analysis, because high Vt can over distend lungs and
interfere with Crs, we used only data with a Vt <8 mL/kg
of predicted body weight. In the second analysis, RRT was
considered as an alternative outcome. However, we could not detect a significant mediation of PEEP on the causal
association between Crs and the need for RRT, and all other
results were very similar, as shown in Tables S3 and S4.
Traditional approach
Finally, we performed several models of logistic regression not following the DAG assumptions. Different models were built to evaluate if any other variable mathematically linked
to Crs conferred predictive additional information, although
adding when ΔP attenuated the Crs odds ratio, the only
mechanical-related variables associated with severe AKI
remained PEEP and Crs, as shown in Table S5.
Discussion
[image:6.595.39.559.96.421.2]In the present study, we evaluated respiratory-related variables in ARDS patients and their causal association with
Table 1 Baseline characteristics stratified by severe AKI status
Variable All patients (n=1,142) No severe AKI (n=833) Severe AKI (n=308) P
Age (years), mean ± SD 65.9±39.5 66.5±41.3 64.5±34.6 0.45
Male, n (%) 696 (58.1) 502 (57.6) 194 (59.5) 0.56
Elixhauser index, median (IQR) 3 (0–8) 2 (0–7) 4 (0–9) <0.001
Fluid balance before MV, median (IQR), mL/day
0 (0–887) 0 (0–698) 0 (0–1,419) 0.04
Baseline SCr, median (IQR), mg/dL 1.0 (0.7–1.5) 1.0 (0.7–1.4) 1.1 (0.8–1.7) <0.001
Nephrotoxic drugs, n (%) 742 (65.0) 518 (62.2) 224 (72.7) 0.001
Sepsis, n (%) 798 (69.8) 577 (69.3) 221 (71.5) 0.42
Vasoactive drugs, n (%) 723 (63.3) 479(57.5) 244 (79.2) <0.001
SAPS II, median (IQR) 45 (36–54) 44 (34–52) 48 (39–57) <0.001
Oxygenation index, mean ± SD, % 139.9±66.8 144.7±67.9 127.5±62.9 <0.001
PEEP, mean ± SD cmH2O 7.6±2.9 6.9±2.7 9.4±3.1 <0.001
Vt, median (IQR), mL/kg predict BW 8.4 (7.2–9.4) 8.3 (7.3–9.5) 8.1 (7.2–9.4) 0.294
PPlat, median (IQR), cmH2O 23.0 (19.6–26.6) 22.4 (18.9–26.0) 24.3 (20.9–28.1) <0.001
ΔP , median (IQR), cmH2O 14.4 (12.0–17.0) 14.1 (11.8–16.8) 14.8 (12.9–17.7) 0.002
Crs, mean ± SD, mL/cmH2O 40.4±13.1 42.2±13.9 35.6±10.9 <0.001
PaO2, mean ± SD, mmHg 75.7±26.1 77.9±28.1 70.2±18.6 <0.001
PaCO2, mean ± SD, mmHg 50.4±12.8 50.0±12.4 51.6±18.5 0.05
28-day mortality, n (%) 347 (30.4) 227 (27.3) 120 (39.0) <0.001
severe AKI. To perform this analysis, first we created a DAG
with the assumption that all other respiratory variables suffer interference from lung disease severity, represented
herein by Crs. Under these assumptions, we could identify
that Crs and PEEP had a causal association with severe AKI.
Moreover, a causal association between Crs and severe AKI was not mediated by any mechanical or blood gas variable, except by PEEP to a small degree.
Over-adjustment bias or unnecessary adjustment has recently drawn the attention of the research community, mainly in observational studies (27). Because there are many interrelationships between respiratory variables, including all variables in the same model cannot be appropriate. To overcome this problem, we chose a causal inference approach. To perform this, the first, and probably most important step, is to construct a DAG. As reported by
recent guidelines (16), there is some difficulty in deciding
what causal sequence of events do or do not exist. We tried to follow a temporal and comprehensive sequence.
First, severe AKI is a later event, so it was considered a consequence of any possible causal association. Second,
because we studied the first 48 h of MV, we assumed that
pulmonary characteristics (Crs) would influence mechanical
ventilation parameters and blood gas parameters. Finally, oxygenation index, although a recognized marker of ARDS severity, was not included as a confounder in any causal analysis. This is because the oxygenation index is (I) a consequence of lung disease/mechanical ventilator
parameters and (II) PaO2 would mediate any possible
causal association with severe AKI, as shown in Figure 1.
Using this approach, it is clear that, for example, PEEP is a
component of PPlat; thus, PPlat must be treated as a mediator,
rather than a confounding variable, of the association between PEEP and severe AKI.
The first main finding of the present paper is that Crs
had a causal association with severe AKI, and that this causal association is not mediated by any mechanical or blood gas parameters. This finding reinforces the
cross-Table 2 Variables used in adjustment of total and direct effect and possible mediators for each considered exposure variable according to directed acyclic graph on severe AKI
Exposure variable Total effect Mediator Indirect effect
Crs, per 5 mL/cmH2O 0.90 (0.84–0.94) PEEP 0.989 (0.996–0.999)
ΔP 0.999 (0.990–1.010)
Vt 0.999 (0.998–1.001)
PaO2 0.998 (0.994–1.002)
PaCO2 0.998 (0.996–1.001)
All mediators together 0.996 (0.986–1.010)
0.90 (0.82–0.95)# CVP# 1.000 (0.999–1.001)
Mean PAP$ 0.999 (0.995–1.002)
PEEP, per cmH2O 1.05 (1.03–1.10) PPlat 1.013 (0.976–1.051)
1.05 (1.02–1.10) CVP# 0.996 (0,989–1.002)
Mean PAP$ 0.997 (0.996–1.013)
ΔP, per cmH2O 1.01 (0.96–1.06) – –
Vt, per mL 1.03 (0.96–1.10) – –
PaO2, per 10 mmHg 0.94 (0.87–1.00) – –
PaCO2, per 5 mmHg 1.01 (0.95–1.07) – –
PPlat, per cmH2O 1.02 (0.96–1.09) – –
All analyses were adjusted for age, gender, Elixhauser morbidity score, sepsis, SAPS II, vasoactive drugs, nephrotoxic drugs, baseline
renal function, fluid balance before mechanical ventilation. Crs,respiratory systemcompliance; ΔP, driving pressure; Vt, tidal volume per
predicted body weight; PPlat, plateau pressure; PEEP, positive end expiratory pressure; CVP, central venous pressure; PAP, pulmonary
[image:7.595.45.552.106.388.2]Figure 3 Direct causal association between the Crs (A) and PEEP (B) with severe AKI after logistic regression, controlling for confounders. 0.5
0.4
0.3
0.2
0.1
0.0
25 50 75 100 Respiratory System Compliance
Sever
e AKI
A
0.40
0.35
0.30
0.25
0.20
0 10 20 30 PEEP
Sever
e AKI
B
talking theory between organs, where a worsening in lung function can lead to worsening AKI. Our study suggests
a causal association between CRS and severe AKI, but we
cannot exclude a bidirectional pathway between renal and lung injuries. For example, it is possible that severe AKI
implies in worsening Crs and, subsequently, in a vicious
cycle. From a practical viewpoint, our finding suggest that
interventions aimed to reduce AKI in ARDS patients must focus mainly in avoiding further lung injury and, except for PEEP as discussed below, other isolated mechanical
ventilator parameters changes, including ΔP, will probably
be inefficient in reducing AKI incidence in this population.
In other words, an MV approach to ameliorate the renal outcome in ARDS patients will have a great chance to be
effective if it ameliorates Crs first.
The other important finding was the causal association between PEEP and severe AKI. Although this is a highly plausible association (high intrathoracic pressure can lead to
significant hemodynamic changes and PEEP is the pressure
applied during the greater part of the respiratory cycle) (28), we could not demonstrate any significant mediation of hemodynamic parameters between high PEEP and severe
AKI. In a meta-analysis, van den Akker (8) did not find any
association between PEEP or Vt and AKI. However, as
stated above in the cited study, the definition of AKI was not standardized, and information about renal status before MV was lacking in some of these studies. In another study,
Lombardi et al. (14) found a univariate association between
PEEP and AKI. However, after adjusting for more than 20 other variables, including peak pressure, which is in part
determined by PEEP, no significant association remained.
In this case, as stated above, peak pressure would be a possible mediator of PEEP effect and not a real confounder, and we interpreted it as an over-adjustment bias.
Our study has several limitations. First, it is difficult to
we chose to explore causal associations. Second, our DAG has some assumptions with limited validity, but we think our primary objective (avoiding over-adjustment bias) was achieved, disclosing important causal associations that must be considered in future studies. Additionally, we performed several additional analyses that support our main finding. Third, our study is a retrospective one and data collection was carried out from 2001 to 2012, so medical practices were performed at the physician’s discretion, which implies in the lack of standardization in some controversial or
changing issues—for example, target Vt, RRT indications
and others. In addition, since we did not have data about inspiratory time, we could not evaluate mean airway pressure as another exposure. Finally, we selected patients under volume-controlled mode, limiting our findings to pressure and assisted modes.
In conclusion, using a model that confirms ΔP has a
causal association with mortality in ARDS patients, our
results show that Crs and PEEP are the only
respiratory-related variables with a direct causal association on severe AKI. Because severe AKI is main related to lung injury severity, this study suggests that approaches reducing
Vt and/or ΔP in ARDS can have limited effect on renal
protection
Acknowledgments
Funding: AB Libório received a grant from Conselho Nacional de Desenvolvimento Científico e Tecnológico (number: 307875/2018-0).
Footnote
Conflicts of Interest: The authors have no conflicts of interest
to declare.
Ethical Statement: The authors are accountable for all aspects of the work in ensuring that questions related to the accuracy or integrity of any part of the work are appropriately investigated and resolved. This study was approved by the institutional review boards of Massachusetts Institute of Technology and Beth Israel Deaconess Medical Center and was granted a waiver of informed consent.
References
1. Hoste EAJ, Kellum JA, Selby NM, et al. Global epidemiology and outcomes of acute kidney injury. Nat
Rev Nephrol 2018;14:607-25.
2. Bellomo R, Kellum JA, Ronco C, et al. Acute kidney injury in sepsis. Intensive Care Med 2017;43:816-28.
3. Vanmassenhove J, Kielstein J, Jörres A, et al. Management of patients at risk of acute kidney injury. Lancet
2017;389:2139-51.
4. Darmon M, Clec’h C, Adrie C, et al. Acute respiratory distress syndrome and risk of AKI among critically ill patients. Clin J Am Soc Nephrol 2014;9:1347-53. 5. Seeley EJ. Updates in the management of acute lung
injury: a focus on the overlap between AKI and ARDS. Adv Chronic Kidney Dis 2013;20:14-20.
6. Ranieri VM, Giunta F, Suter PM, et al. Mechanical ventilation as a mediator of multisystem organ failure in acute respiratory distress syndrome. JAMA 2000;284:43-4. 7. Vieira JM, Castro I, Curvello-Neto A, et al. Effect of acute kidney injury on weaning from mechanical ventilation in critically ill patients. Crit Care Med 2007;35:184-91. 8. van den Akker JP, Egal M, Groeneveld AB. Invasive
mechanical ventilation as a risk factor for acute kidney injury in the critically ill: a systematic review and meta-analysis. Crit Care 2013;17:R98.
9. Murdaugh HV Jr, Sieker Ho, Manfredi F. Effect of altered intrathoracic pressure on renal hemodynamics, electrolyte excretion and water clearance. J Clin Invest 1959;38:834-42.
10. Darmon M, Schortgen F, Leon R, et al. Impact of mild hypoxemia on renal function and renal resistive index during mechanical ventilation. Intensive Care Med 2009;35:1031-8.
11. Jacob LP, Chazalet JJA, Payen DM, et al. Renal
hemodynamic and functional effect of PEEP ventilation in human renal transplantations. Am J Respir Crit Care Med 1995;152:103-7.
12. Darmon M, Legrand M, Terzi N. Understanding the kidney during acute respiratory failure. Intensive Care Med 2017;43:1144-7.
13. Han S, Mallampalli RK. The Acute Respiratory Distress Syndrome: From Mechanism to Translation. J Immunol 2015;194:855-60.
14. Lombardi R, Nin N, Penũelas O, et al. Acute kidney injury
in mechanically ventilated patients: The risk factor profile
depends on the timing of AKI onset. Shock 2017;48:411-7. 15. Suttorp MM, Siegerink B, Jager KJ, Zoccali C, Dekker
FW. Graphical presentation of confounding in directed acyclic graphs. Nephrol Dial Transplant 2015;30:1418-23. 16. Staplin N, Herrington WG, Judge PK, et al. Use of
of Observational Studies: An Example from the Study of Heart and Renal Protection (SHARP). Clin J Am Soc Nephrol 2017;12:546-52.
17. Johnson AEW, Pollard TJ, Shen L, et al. MIMIC-III, a freely accessible critical care database. Sci Data 2016;3:160035.
18. ARDS Definition Task Force, Ranieri VM, Rubenfeld
GD, et al. Acute respiratory distress syndrome: the Berlin
Definition. JAMA 2012;307:2526-33.
19. Angus DC, Linde-Zwirble WT, Lidicker J, et al. Epidemiology of severe sepsis in the United States: Analysis of incidence, outcome, and associated costs of care. Crit Care Med 2001;29:1303-10.
20. Elixhauser A, Steiner C, Harris DR, et al. Comorbidity Measures for Use with Administrative Data. Med Care 1998;36:8-27.
21. Acute Respiratory Distress Syndrome Network., Brower RG, Matthay MA, et al. Ventilation with lower tidal volumes as compared with traditional tidal volumes for acute lung injury and the acute respiratory distress syndrome. N Engl J Med 2000;342:1301-8.
22. Schmidt MFS, Amaral ACKB, Fan E, et al. Driving Pressure and Hospital Mortality in Patients Without ARDS: A Cohort Study. Chest 2018;153:46-54.
23. Kidney Disease: Improving Global Outcomes (KDIGO) Acute Kidney Injury Work Group. KDIGO Clinical Practice Guideline for Acute Kidney Injury. Kidney Int Suppl 2012;2:1-138.
24. Textor J, van der Zander B, Gilthorpe MS, et al. Robust causal inference using directed acyclic graphs: The R package “dagitty.” Int J Epidemiol 2016;45:1887-94.
25. Steen J, Loeys T, Moerkerke B, et al. medflex: An R Package
for Flexible Mediation Analysis using Natural Effect Models. J Stat Softw 2017. doi: 10.18637/jss.v076.i11. 26. Amato MBP, Maureen D, Meadle O. Driving pressure and
survival in the ARDS. New Engl J Med 2015;372:747-55. 27. Schisterman EF, Cole SR, Platf RW. Overadjustment bias
and unnecessary adjustment in epidemiologic studies. Epidemiology 2009;20:488-95.
28. Koyner JL, Murray PT. Mechanical ventilation and lung-kidney interactions. Clin J Am Soc Nephrol 2008;3:562-70.
MIMIC-III description and data collection
The database includes basic admission and demographic information (of which not all was used in the present study), as well as vital signs, laboratory and radiology results, medications, discharge diagnoses, nursing notes, physician discharge summaries and dates of death. The MIMIC-III database contains patients from five ICU types: medical ICU (MICU), surgical ICU (SICU), cardiac ICU (CICU), cardiac surgery recovery unit (CSRU), and neonatal ICU (NICU). Other clinical data were added to the database, including pharmacy, provider order entry records, admission and death records, discharge summaries, and 9th Revision (ICD-9) codes.
All data were extracted from the MIMIC-III database (v1.4) and included demographic information (e.g., age, gender, height), sepsis diagnosis as described by Angus
et al. (19), Elixhauser comorbidity index (20), SCr at MV initiation and disease severity score assessed by the
simplified acute physiology score (SAPS I). We chose SAPS
I because it was recently used in both articles evaluating
driving pressure (ΔP) as a risk factor for mortality (22,26).
Additionally, arterial blood gas analyses in the first 48 h
of MV were evaluated and the worst PaO2, PaCO2 and
PaO2//FiO2 ratio (when PEEP was at least 5 cmH2O)
were selected. We collected daily SCr up to day 7 after
MV initiation, urine output, need for vasoactive drugs, exposure to nephrotoxic drugs (amphotericin, vancomycin, aminoglycoside), fluid balance before VM initiation and need of RRT.
Directed acyclic graph construction
In our directed acyclic graph (DAG) we had the following assumptions (I) because we studied only the first 48 h
of MV, we assumed that all respiratory and blood gas
variables could be influenced by lung disease severity, here represented by Crs (i.e., PaO2, PaCO2, PEEP, Vt, PaO2//
FiO2 and ΔP could be, at least partly, be determined by
Crs); (II) all other clinical variables (age, gender, Elixhauser
comorbidity index, fluid balance before MV, baseline renal function, SAPS, nephrotoxic drugs, vasoactive drugs and
sepsis) were considered confounders of all considered exposures in the causal association with severe AKI. This
assumption is based on previous knowledge (for example,
presence of sepsis can be associated with both respiratory and renal failure) or in the absence of data supporting the exclusion of any possible association, i.e., it is impossible to exclude the association of nephrotoxic drugs and a higher
PEEP, even a third unmeasured confounder, like severe
lung infection, for example. Additionally, (III) if possible, if relationships between two variables were bidirectional, they
were modified according to evaluated exposures, making
them real confounders. These interactions are represented in Figure 1 as connectors without arrow. Finally, (IV) all
respiratory related variables, except for PaO2/FiO2 ratio,
were considered potential causes of severe AKI. The variables included in the adjustment of each exposure are
[image:11.595.309.550.107.190.2]described in the Table S1.
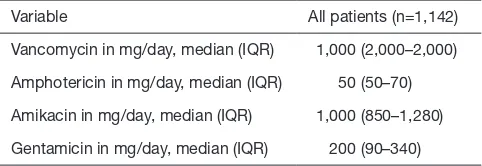
Table S1 Median daily dose of nephrotoxic drugs used in the first 7 days after mechanical ventilation initiation
Variable All patients (n=1,142)
Vancomycin in mg/day, median (IQR) 1,000 (2,000–2,000)
Amphotericin in mg/day, median (IQR) 50 (50–70)
Amikacin in mg/day, median (IQR) 1,000 (850–1,280)
Exposure variable Adjustment for total effect Adjustment for direct effect Possible mediators
Crs* Clinical variables Clinical variables, PEEP, ΔP,
PaO2, PaCO2
PEEP, ΔP, Vt, PaO2, PaCO2,
PPlat, CVP, mean PAP
PEEP Clinical variables, Crs, PaO2, PaCO2 Clinical variables, Crs, PaO2, ΔP, Vt, PPlat PPlat, CVP, mean PAP
ΔP* Clinical variables, Crs Clinical variables, Crs, Vt, PEEP, PaO2, PPlat PPlat, CVP, mean PAP
Vt Clinical variables, Crs Clinical variables, Crs, PEEP, PaO2,
PaCO2, ΔP
PaO2, PaCO2, ΔP
PaO2 Clinical variables, Crs, PEEP, ΔP, Vt Clinical variables, Crs, PEEP, ΔP, Vt –
PaCO2 Clinical variables, Crs, Vt, PEEP Clinical variables, Crs, Vt –
PPlat* Clinical variables, PEEP Clinical variables, PEEP –
*, all mathematically linked variables were not included in the same model. In these cases, we chose to include the variable associated
with outcome. For example, to adjust ΔP (ΔP=Vt/Crs), we did not include Vt. variables, where Crs=respiratory system compliance; ΔP,
driving pressure; Vt, tidal volume per predicted body weight; PPlat, plateau pressure; PEEP, positive end expiratory pressure; CVP, central
venous pressure; PAP, pulmonary artery pressure.
Other clinical variables
Crs ΔP PaO2, Severe AKI Death
Vt
a
b c
OR 95% CI
Direct effect (a) 1.05 1.01–1.09
Indirect effect (b*c) 1.01 0.99–1.02
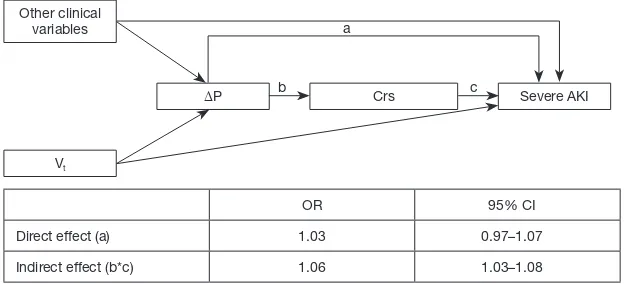
Other clinical variables
ΔP Crs Severe AKI
Vt
a
b c
OR 95% CI
Direct effect (a) 1.03 0.97–1.07
[image:12.595.42.552.107.263.2]Indirect effect (b*c) 1.06 1.03–1.08
Figure S1 Alternative pathway where ΔP is the exposure and Crs is treated as a mediator. The total effect of ΔP was adjusted for all non-respiratory related clinical variables and Vt. Crs, respiratory system compliance; ΔP, driving pressure; Vt, tidal volume per predicted body weight; AKI, acute kidney injury.
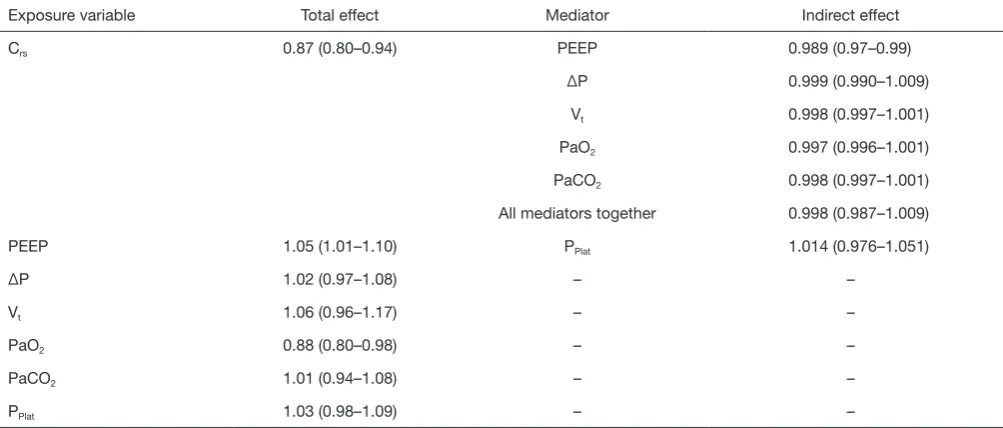
[image:12.595.136.451.333.476.2] [image:12.595.135.448.546.688.2]Table S4 Variables used in adjustment of total and direct effect and possible mediators for each considered exposure variable according to directed acyclic graph on need for RRT
Exposure variable Total effect Mediator Indirect effect
Crs 0.87 (0.80–0.94) PEEP 0.989 (0.97–0.99)
ΔP 0.999 (0.990–1.009)
Vt 0.998 (0.997–1.001)
PaO2 0.997 (0.996–1.001)
PaCO2 0.998 (0.997–1.001)
All mediators together 0.998 (0.987–1.009)
PEEP 1.05 (1.01–1.10) PPlat 1.014 (0.976–1.051)
ΔP 1.02 (0.97–1.08) – –
Vt 1.06 (0.96–1.17) – –
PaO2 0.88 (0.80–0.98) – –
PaCO2 1.01 (0.94–1.08) – –
PPlat 1.03 (0.98–1.09) – –
RRT, renal replacement therapy. Crs,respiratory systemcompliance; ΔP, driving pressure; Vt, tidal volume per predicted body weight; PPlat,
plateau pressure; PEEP, positive end expiratory pressure.
Exposure variable Total effect Mediator Indirect effect
Crs 0.90 (0.83–0.96) PEEP 0.998 (0.996–0.999)
ΔP 0.997 (0.985–1.007)
Vt 1.000 (0.998–1.000)
PaO2 0.997 (0.994–1.001)
PaCO2 0.999 (0.999–1.001)
All mediators together 0.996 (0.980–1.009)
AKI, acute kidney injury; Crs,respiratory systemcompliance; ΔP, driving pressure; Vt, tidal volume per predicted body weight; PPlat, plateau
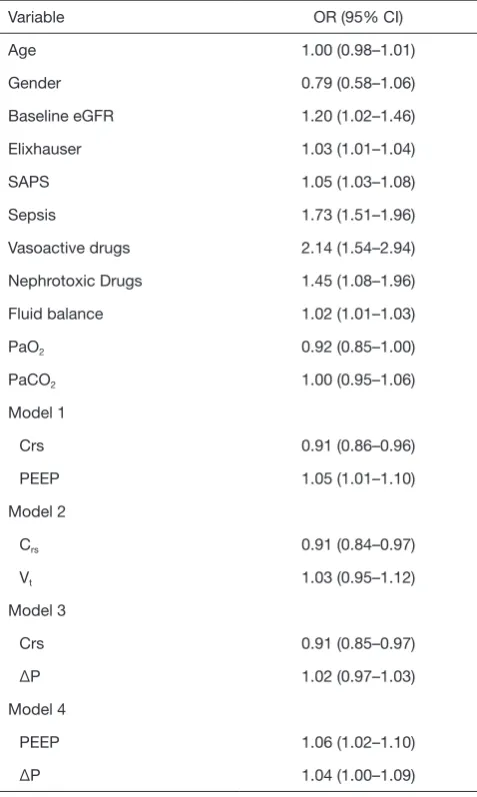
[image:13.595.47.549.296.510.2]Variable OR (95% CI)
Age 1.00 (0.98–1.01)
Gender 0.79 (0.58–1.06)
Baseline eGFR 1.20 (1.02–1.46)
Elixhauser 1.03 (1.01–1.04)
SAPS 1.05 (1.03–1.08)
Sepsis 1.73 (1.51–1.96)
Vasoactive drugs 2.14 (1.54–2.94)
Nephrotoxic Drugs 1.45 (1.08–1.96)
Fluid balance 1.02 (1.01–1.03)
PaO2 0.92 (0.85–1.00)
PaCO2 1.00 (0.95–1.06)
Model 1
Crs 0.91 (0.86–0.96)
PEEP 1.05 (1.01–1.10)
Model 2
Crs 0.91 (0.84–0.97)
Vt 1.03 (0.95–1.12)
Model 3
Crs 0.91 (0.85–0.97)
ΔP 1.02 (0.97–1.03)
Model 4
PEEP 1.06 (1.02–1.10)
ΔP 1.04 (1.00–1.09)
AKI, acute kidney injury; Crs,respiratory systemcompliance; ΔP,
driving pressure; Vt, tidal volume per predicted body weight;
[image:14.595.47.286.96.495.2]