Clinical Ophthalmology
The role of hemifield sector analysis in multifocal
visual evoked potential objective perimetry
in the early detection of glaucomatous visual
field defects
Mohammad F Mousa1
Robert P Cubbidge2 Fatima Al-Mansouri1 Abdulbari Bener3,4 1Department of Ophthalmology,
Hamad Medical Corporation, Doha, Qatar; 2School of Life and
Health Sciences, Aston University, Birmingham, UK; 3Department of
Medical Statistics and Epidemiology, Hamad Medical Corporation, Department of Public Health, Weill Cornell Medical College, Doha, Qatar; 4Department Evidence for
Population Health Unit, School of Epidemiology and Health Sciences, University of Manchester, Manchester, UK
Correspondence: Abdulbari Bener Department of Medical Statistics and Epidemiology, Hamad Medical Corporation and Department of Public Health, Weill Cornell Medical College, C - Ring Road, Al-Rayyan Street, 3050 Doha, State of Qatar Tel +974 4439 3765 Fax +974 4439 3769
Email [email protected]
Objective: The purpose of this study was to examine the effectiveness of a new analysis method
of mfVEP objective perimetry in the early detection of glaucomatous visual field defects com-pared to the gold standard technique.
Methods and patients: Three groups were tested in this study; normal controls (38 eyes),
glaucoma patients (36 eyes), and glaucoma suspect patients (38 eyes). All subjects underwent two standard 24-2 visual field tests: one with the Humphrey Field Analyzer and a single mfVEP test in one session. Analysis of the mfVEP results was carried out using the new analysis protocol: the hemifield sector analysis protocol.
Results: Analysis of the mfVEP showed that the signal to noise ratio (SNR) difference between
superior and inferior hemifields was statistically significant between the three groups (analysis of variance, P, 0.001 with a 95% confidence interval, 2.82, 2.89 for normal group; 2.25, 2.29 for glaucoma suspect group; 1.67, 1.73 for glaucoma group). The difference between superior and inferior hemifield sectors and hemi-rings was statistically significant in 11/11 pair of sectors and hemi-rings in the glaucoma patients group (t-test P, 0.001), statistically significant in 5/11 pairs of sectors and hemi-rings in the glaucoma suspect group (t-test P, 0.01), and only 1/11 pair was statistically significant (t-test P, 0.9). The sensitivity and specificity of the hemifield sector analysis protocol in detecting glaucoma was 97% and 86% respectively and 89% and 79% in glaucoma suspects. These results showed that the new analysis protocol was able to confirm existing visual field defects detected by standard perimetry, was able to differentiate between the three study groups with a clear distinction between normal patients and those with suspected glaucoma, and was able to detect early visual field changes not detected by standard perimetry. In addition, the distinction between normal and glaucoma patients was especially clear and significant using this analysis.
Conclusion: The new hemifield sector analysis protocol used in mfVEP testing can be used to
detect glaucomatous visual field defects in both glaucoma and glaucoma suspect patients. Using this protocol, it can provide information about focal visual field differences across the horizon-tal midline, which can be utilized to differentiate between glaucoma and normal subjects. The sensitivity and specificity of the mfVEP test showed very promising results and correlated with other anatomical changes in glaucomatous visual field loss. The intersector analysis protocol can detect early field changes not detected by the standard Humphrey Field Analyzer test.
Keywords: objective perimetry, multifocal VEP, visual field testing, glaucomatous field loss,
glaucoma suspect, SAP, HFA
Introduction
The early diagnosis and effective monitoring of glaucoma are considered major concerns and objectives of almost all of the research studies conducted in the field of
Dove
press
O R i g i n A L R E S E A C H open access to scientific and medical research
Open Access Full Text Article
Clinical Ophthalmology downloaded from https://www.dovepress.com/ by 118.70.13.36 on 21-Aug-2020
For personal use only.
Number of times this article has been viewed
This article was published in the following Dove Press journal: Clinical Ophthalmology
Methods
This study was conducted at the ophthalmology outpatient clinic, Hamad Medical Corporation, in Doha, Qatar. Study subjects were randomly selected from patients attending the ophthalmology outpatient clinics during the recruitment period, which took place between March and June 2012. Three study groups of participants were recruited: patients with known diagnosis of glaucoma who may or may not be receiving treatment, glaucoma suspect patients who had one or more risk factors for glaucoma but did not have established clinical damage to the optic disc or visual field losses, and a control group (normal patients). Glaucoma patients were enrolled to evaluate the ability of the HSA analysis protocol to detect already documented visual field defects. Glaucoma suspect patients usually have one or more risk factors for glaucoma but are without apparent optic disc damage or a true and reproducible visual field defect detected by SAP, but are considered more susceptible to the development of glaucoma. We enrolled glaucoma suspects into this study in order to detect any differences between the SAP testing and mfVEP perimetry results in the early detection of functional visual field loss secondary to glau-coma changes. Written informed consent was obtained from all participants before enrollment in the study. The testing procedures, risks, and potential side effects were discussed and explained to the study subjects at the time consent was given. The protocol for this study was approved by the eth-ics committees of Aston University and Hamad Medical Corporation, Doha, Qatar.
All study subjects underwent a pretest assessment, con-sisting of a full eye examination completed prior to enroll-ment by a glaucoma specialist, including intraocular pressure, gonioscopy, visual acuity using Snellen chart, slit-lamp assessment of the anterior segment, and retinal examination including the optic nerve head.
inclusion criteria
Selection criteria for glaucoma and glaucoma suspect patients followed the guidelines of the American Academy of Ophthalmology Preferred Practice Pattern (AAO-PPP)
to define glaucoma and glaucoma suspect patients.13 The
glaucoma patient group consisted of individuals with diag-nosed and well documented features of any type of glaucoma as defined by these guidelines. A glaucoma suspect patient was defined as an individual with clinical findings and/or a constellation of risk factors that indicated an increased likelihood of developing glaucoma, without any anatomical or functional damage to the optic nerve. Normal subjects glaucoma management. Visual field assessment is still the
main monitoring tool that reflects progressive glaucomatous
functional loss. It has been reported1,2 that at least 25%–50%
of the retinal ganglion cells must be lost prior to the develop-ment of a visual field abnormality detectable with modern automated perimetry. Despite its valuable contribution to the management of glaucoma, standard perimetry is considered a process that has too many inputs related to the operator, patient, and test protocol, which can negatively influence the accuracy of the final outcome. The introduction of standard automated perimetry (SAP) has improved the accuracy and reduced variability errors compared to earlier kinetic perimeters. However, SAP protocols do not provide a fully accurate visual field profile due to many factors influencing the results, including, but not limited to, subjectivity. Despite its disadvantages, which are clearly evident based on the long test duration and variability, full threshold perimetry is considered the gold standard method for visual field assess-ment in clinical practice and glaucoma related clinical trials.1,3 There is a strong demand for an objective measure of the visual field that can supplement clinical information derived by automated perimetry and other psychophysical tests in
the evaluation of glaucoma.4 The multifocal visual evoked
potential (mfVEP) is a method for objective assessment of visual field. It has been shown over the past decades that this method can detect glaucomatous visual field defects with high sensitivity and specificity, and it can have a clear role in the detection and monitoring of glaucomatous progression based
on good repeatability figures.4–7 The mfVEP is an objective
tool that has yet to find its place within accepted clinical
practice. The findings of Hood et al8 recorded from about
500 patients highlight the potential clinical uses of the mfVEP as an objective tool in the assessment of glaucomatous visual
field defects. It has also been reported8–12 that the mfVEP is
able to detect glaucomatous damage that is undetectable by standard perimetry.
The purpose of this study was to examine the effective-ness of a new analysis method of mfVEP when it is used for objective assessment of visual field in glaucoma. The hemifield sector/hemi-ring analysis (HSA) compares the responses of each sector and hemi-ring in one hemifield of visual field to its mirror image corresponding sector in the opposite hemifield. We also compared the results of this analysis protocol to the SAP. We hypothesized that our protocol provided good sensitivity and specific-ity levels in the detection of early visual field losses and the detection of existing significant glaucomatous visual field defects.
Dovepress
Mousa et al
Clinical Ophthalmology downloaded from https://www.dovepress.com/ by 118.70.13.36 on 21-Aug-2020
were recruited after excluding any existing ocular pathology. Both genders were equally invited to participate in this study. There were no language restrictions applied when subjects were recruited.
Exclusion criteria
Subjects suffering from visual field losses due to any pathology other than glaucoma, significant retinal disease with or with-out macular involvement, established neurological deficits which could affect the visual cortex or visual pathways, or subjects with amblyopia were excluded from this study. Subjects under the age of 16 were not recruited as high levels of variability and poor reliability in SAP have been reported
in this group.14–16 Vulnerable subjects suffering from mental
or physical disability, and/or severely debilitated patients who need continuous and special care were excluded from this study, as a high level of cooperation and responsiveness was needed to perform study tests.
The mfVEP test
The stimulus
According to the guidelines of the International Society of Clinical Electrophysiology of Vision there is a standard requirement for the multifocal stimulus. We fulfilled this standard using a cathode ray tube (CRT) frame frequency
of 75 Hz, which has been widely used.17 For CRT displays,
the luminance of the stimulus elements in the light state
was at least 100 cd/m2. The luminance of the display in the
dark state was low enough to achieve a contrast (Michelson)
of $90% using an m-sequence to control the temporal
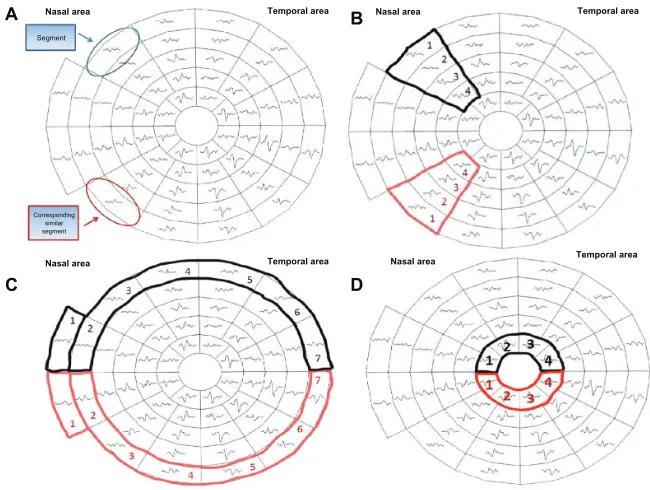
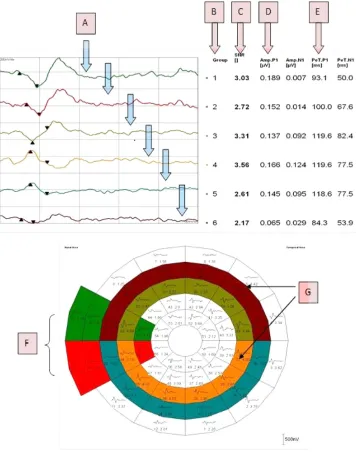
sequence of changes between the light and dark stages of each stimulus hexagon. This m-sequence, in which each hexagonal element can change with every frame, is a stan-dard for routine testing. mfVEP recordings were obtained with a dartboard pattern which is a standard option (Dart Board 58 with pattern segments) of the Roland Consult GmbH software, RETIscan (Brandenburg, Germany). A modified version of this pattern has recently been intro-duced as part of the HSA protocol. The modification is based on the new idea of this research work to record the SNR values of each segment (Figure 1A) and calculate the average of the individual sectors that contain fixed numbers of segments (Figure 1B). Each sector SNR value in one hemisphere was compared to its corresponding sector in the other hemisphere to calculate the difference between the two fellow sectors. Similar averaging and calculations were carried out in a hemi-ring group of seg-ments arranged circumferentially around the central part (Figure 1C and D). SNR values from each of two fellow hemi-rings were compared to see if there was any statistical difference between each couple of sectors/hemi-rings in the three subject groups. There are 58 sectors in this display
Figure 1 The 58 segments of the right visual field. The field is divided into two identical hemifields across the horizontal meridian; each segment has a similar correspondent in the opposite hemifield (A) the SNR value is calculated in each segment. The average SNR of the wedge sectors (B) and semi-circular sector; peripheral and central (C and D) are calculated to compare to the fellow corresponding sector on the opposite hemifield.
Abbreviation: SnR, signal to noise ratio.
A
C
Nasal area
Nasal area
Corresponding similar segment Segment
Temporal area
Temporal area
B
D
Nasal area
Nasal area
Temporal area
Temporal area
Dovepress Hemifield sector analysis for detecting glaucomatous visual defects
Clinical Ophthalmology downloaded from https://www.dovepress.com/ by 118.70.13.36 on 21-Aug-2020
and each sector contains 16 checks, eight black and eight
white. The dartboard pattern covers a central 25° on each
side of the fixation point with nasal extension wing up to 42°. The segments, and the checks, are scaled to be of approximately equal effectiveness, based on cortical magnification factors presented by Baseler et al.18 Dur-ing their enrolment period, each participant underwent two full threshold perimetry tests using the 24-2 Swedish Interactive Threshold Algorithm (SITA) program of the Humphrey Field Analyzer (HFA), separated by one hour. When completed, both eyes were dilated using 0.5% Tropi-camide hydrochloride. When both eyes were fully dilated the patient was prepared for mfVEP. Next, the subject was asked to fixate on a screen that projects flickering hexa-gon patterns into their eye. Each test took between 8 and 16 minutes to complete per eye, during which fixation was manually monitored. The total duration of attendance for each subject ranged between 45–90 minutes, dependent on the individual variations amongst the subjects when undertaking tests. No follow up visits were required; all recordings were taken in a single session.
mfVEP test parameters
To measure the amplitude of the mfVEP responses, the root mean square (RMS) was calculated across a time interval between 0 and 500 milliseconds. RMS is commonly used because it requires only the specification of a time interval rather than the identification of a particular aspect of the response waveform. In addition to measuring the RMS of each of the 58 responses for each eye, a SNR measure was obtained as previously described. In order to obtain the SNR of any segment, a signal window (0–200 milliseconds) and a “noise-only” window (300–500 milliseconds) are specified. The SNR of a given response is obtained by dividing the RMS of the signal window by the average of
the 58 segments × 4 channels (232 total RMS values) of
the noise-only window.
SNR RMS signal
Average RMS noise from sectors
=
58 (1)
A response without any signal present would have, on average, a SNR equal to one. The recordings from the four channels are all oriented in polarity so that if a response was present, it should yield a prominent negative compo-nent followed by a promicompo-nent positive compocompo-nent. There is little or no response present for the record with the SNR around 1.0, and the signal becomes more salient as the SNR increases.
The hemifield sector/hemi-ring analysis (HSA) protocol
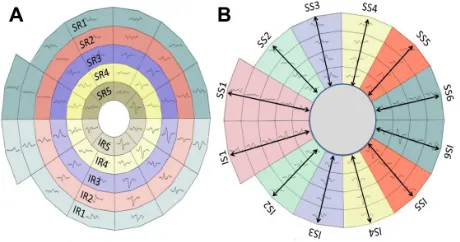
The concept of the analysis protocol described earlier is to compare and divide the mfVEP field into similar (equal) sectors and hemi-rings across the horizontal meridian, where a sector in the superior hemisphere is compared to its corresponding fellow sector in the inferior hemisphere. The allocated sectors and hemi-rings comprise a fixed number of segments (Figure 2). After the SNR value from each segment is recorded, an average is taken from all the segments allocated to any given sector, yielding a sector average SNR value. This sector SNR value is compared to its corresponding sector across the horizontal meridian, and not the individual segments. Certain measurable parameters were recorded and calculated in this HSA protocol in order to compare the three groups. For instance, the SNR value in each sector/hemi-ring was compared to the correspond-ing fellow in the opposite hemisphere and differences between them were calculated to check for any significant changes in corresponding sectors/hemi-rings. The same SNR values and differences between sectors/hemi-rings were also compared to the identical locations within the three groups to evaluate significant changes between groups.
The Humphrey Field Analyzer 24-2 program, SiTA standard
All study subjects underwent one or two visual field tests using program 24-2 SITA standard of the HFA. The first examination was a familiarization test, carried out in order to determine reliability errors. If the subject had already undergone full threshold perimetry, this first test was waived. The second test was the study test and all data were recorded and analyzed. The measurable parameters recorded by the HFA test included the mean deviation, the pattern standard deviation, and the glaucoma hemifield test outcome. Most
Figure 2 The five allocated hemi-rings and their corresponding fellows in both hemispheres (A). The allocated six sectors and their corresponding fellows in both hemispheres (B).
Abbreviations: iR, inferior hemi-ring; iS, inferior sector; SR, superior hemi-ring; SS, superior sector.
Dovepress
Mousa et al
Clinical Ophthalmology downloaded from https://www.dovepress.com/ by 118.70.13.36 on 21-Aug-2020
of these parameters were used to grade the severity of any visual field loss.
Statistical analysis
All SNR values from individual sectors/hemi-rings, in all groups, were tested for normality using the Kolmogorov-Smirnov and Shapiro-Wilk tests. It was found that almost
all P values were .0.05, indicating a normally distributed
sample. One way analysis of variance (ANOVA) and paired t-test were used in the data statistical analysis.
Results
A total of 60 subjects (112 eyes) were recruited for this study; 20 normal subjects (38 eyes), 20 glaucoma sus-pects (38 eyes), and 20 glaucoma patients (36 eyes). All subjects completed the study tests. All study subjects were able to complete two cycles of the mfVEP test suc-cessfully with no significant complaints or side effects. It was noted that in only 3/112 eyes we were required to suspend the test and give the subject a break, during one of the test cycles, upon their request. It was also noted that most of glaucoma and glaucoma suspect patients (29/40) preferred the standard HFA test as a routine method for visual field check, whilst the rest (11/40) reported that the mfVEP was better for various reasons; it was simpler, advanced technology, easier, and less confusing. The test duration for a SITA standard HFA test ranged between 4–11 minutes per eye, while the duration of a single (two cycles) mfVEP test was slightly longer, ranging between 8–16 minutes per eye, excluding preparation time. The mfVEP preparation time was similar in all subjects and ranged between 13–20 minutes per patient. Table 1 shows the age distribution of all subjects in the three study
groups. There was no significant statistical difference in age among the study groups found by one way ANOVA
that could have influenced the data (P= 0.964 for normal
group, P = 0.964 for glaucoma suspect group, and P =
0.810 for glaucoma group).
The hemifield sector analysis
The normal group
For the majority of the normal subjects both eyes were tested with only two subjects preferring a single eye to be tested. The intersector/hemi-ring differences between cor-responding hemifields were tested for significance. For each hemifield, six sectors and five hemi-rings were compared to their corresponding fellows in the opposite hemifield. Table 2 shows the results in detail; there was only one pair of sectors (1/6) found to be significant, and no hemi-rings (0/5) were found to be significant.
The glaucoma suspect group
Twenty glaucoma suspect patients (38 eyes) were tested. The majority of patients (9/20) were diagnosed as glau-coma suspect based on high intraocular pressure recorded on multiple occasions, (5/20) had suspicious visual field results but not confirmatory of glaucoma, (3/20) had suspicious optic disc appearances without established damage. The intersector/hemi-ring differences between corresponding hemifields were tested for significance. On each hemifield, six sectors and five hemi-rings were compared to their corresponding fellows in the opposite hemifield. Table 3 shows that 4/6 sectors were found to have a statistically significant SNR difference when compared to their corresponding fellows, while 1/5 hemi-rings was statistically significant.
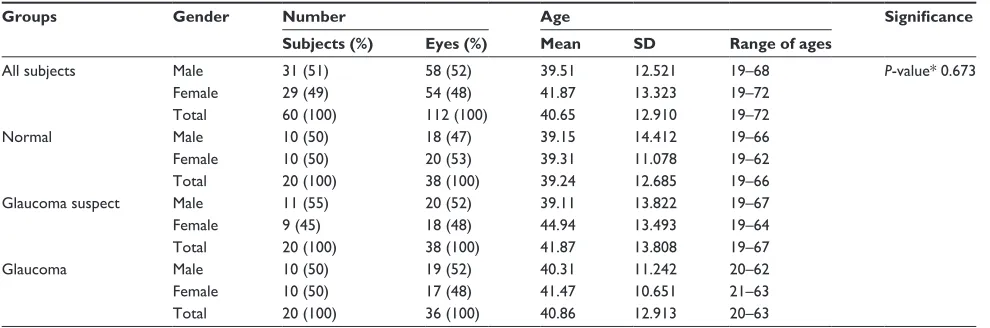
Table 1 Analysis of ages in all study groups
Groups Gender Number Age Significance
Subjects (%) Eyes (%) Mean SD Range of ages
All subjects Male 31 (51) 58 (52) 39.51 12.521 19–68 P-value* 0.673
Female 29 (49) 54 (48) 41.87 13.323 19–72
Total 60 (100) 112 (100) 40.65 12.910 19–72
normal Male 10 (50) 18 (47) 39.15 14.412 19–66
Female 10 (50) 20 (53) 39.31 11.078 19–62
Total 20 (100) 38 (100) 39.24 12.685 19–66
glaucoma suspect Male 11 (55) 20 (52) 39.11 13.822 19–67
Female 9 (45) 18 (48) 44.94 13.493 19–64
Total 20 (100) 38 (100) 41.87 13.808 19–67
glaucoma Male 10 (50) 19 (52) 40.31 11.242 20–62
Female 10 (50) 17 (48) 41.47 10.651 21–63
Total 20 (100) 36 (100) 40.86 12.913 20–63
Notes: *One way ANOVA test; Significant when P , 0.05. Abbreviations: AnOVA, analysis of variance, SD, standard deviation.
Dovepress Hemifield sector analysis for detecting glaucomatous visual defects
Clinical Ophthalmology downloaded from https://www.dovepress.com/ by 118.70.13.36 on 21-Aug-2020
Table 2 Comparison between SNR values in superior and inferior hemifield sectors and rings in the normal group
Variables Superior hemifield Inferior hemifield P-value*
N M SD N M SD
Pair 1 (SS1-IS1) 38 2.92 0.441 38 3.01 0.553 0.136
Pair 2 (SS2-IS2) 38 2.78 0.463 38 2.83 0.540 0.364
Pair 3 (SS3-IS3) 38 2.86 0.520 38 2.80 0.545 0.228
Pair 4 (SS4-IS4) 38 2.77 0.485 38 2.85 0.479 0.106
Pair 5 (SS5-IS5) 38 2.89 0.536 38 2.75 0.521 0.028
Pair 6 (SS6-IS6) 38 2.84 0.550 38 2.93 0.490 0.298
Pair 7 (SR1-IR1) 38 2.84 0.462 38 2.88 0.505 0.321
Pair 8 (SR2-IR2) 38 2.82 0.538 38 2.86 0.538 0.478
Pair 9 (SR3-IR3) 38 2.95 0.559 38 2.87 0.469 0.148
Pair 10 (SR4-IR4) 38 2.81 0.415 38 2.87 0.566 0.320
Pair 11 (SR5-IR5) 38 2.85 0.456 38 2.76 0.455 0.091
Notes: *Paired t-test, significant when P, 0.05.
Abbreviations: iS, inferior sector; iR, inferior ring; M, mean; SD, standard deviation; SnR, signal to noise ratio; SR, superior ring; SS, superior sector.
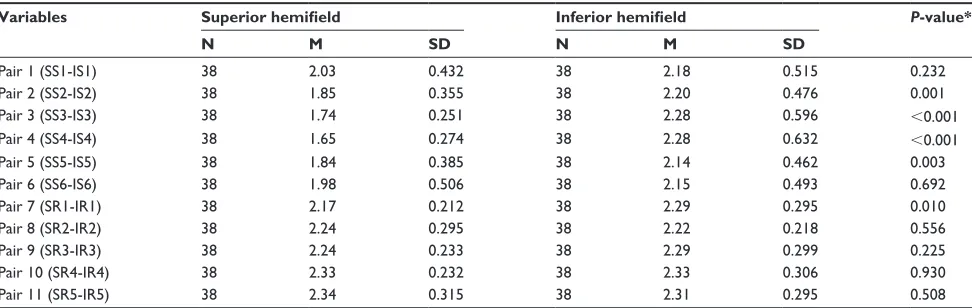
Table 3 Comparison between SNR values in superior and inferior hemifield sectors and rings in glaucoma suspect group
Variables Superior hemifield Inferior hemifield P-value*
N M SD N M SD
Pair 1 (SS1-IS1) 38 2.03 0.432 38 2.18 0.515 0.232
Pair 2 (SS2-IS2) 38 1.85 0.355 38 2.20 0.476 0.001
Pair 3 (SS3-IS3) 38 1.74 0.251 38 2.28 0.596 ,0.001
Pair 4 (SS4-IS4) 38 1.65 0.274 38 2.28 0.632 ,0.001
Pair 5 (SS5-IS5) 38 1.84 0.385 38 2.14 0.462 0.003
Pair 6 (SS6-IS6) 38 1.98 0.506 38 2.15 0.493 0.692
Pair 7 (SR1-IR1) 38 2.17 0.212 38 2.29 0.295 0.010
Pair 8 (SR2-IR2) 38 2.24 0.295 38 2.22 0.218 0.556
Pair 9 (SR3-IR3) 38 2.24 0.233 38 2.29 0.299 0.225
Pair 10 (SR4-IR4) 38 2.33 0.232 38 2.33 0.306 0.930
Pair 11 (SR5-IR5) 38 2.34 0.315 38 2.31 0.295 0.508
Notes: Table 3 shows that 4 pairs of sectors (4/6) have statistically significant difference in the SNR value, while only one hemi-ring (1/5) showed statistically significant difference. All other tested sectors and hemi-rings were not statistically significant; *Paired t-test, significant when P , 0.05.
Abbreviations: iS, inferior sector; iR, inferior ring; M, mean; SD, standard deviation; SnR, signal to noise ratio; SR, superior ring; SS, superior sector.
The glaucoma group
Twenty glaucoma patients (36 eyes) were tested. The majority of these patients (14/20) had simple open angle glaucoma, (3/20) had narrow angle glaucoma, and (1/20) had pseu-doexfoliation glaucoma. There was considerable variation in the severity of glaucomatous field changes amongst this group of patients. They ranged from mild glaucomatous
field losses to severe using the Hoddap-Anderson criteria.19
Most of the patients (13/20) had asymmetrical glaucomatous field changes between eyes, the remainder (7/20) had mild to moderate symmetrical field changes. Only 3/36 eyes exhibited advanced glaucomatous changes with symmetrical severe visual field loss across midline in both hemifields, the remainder (33/36) showed clear differences between the two corresponding hemifields. The intersector/hemi-ring differences between corresponding hemifields were tested for significance. For each hemifield, six sectors and five hemi-rings were compared to their corresponding fellows
in the opposite hemifield. Table 4 shows that all sectors and hemi-rings were statistically significant when compared to their corresponding fellows in the opposite hemifield. The results show that the majority of patients had asymmetrical glaucomatous visual field defects between the two eyes. The
mean SNR ± standard deviation values for the glaucoma
group were 1.70 ± 0.412, which is a low average response,
close to poor (SNR = 1). Table 4 shows that all pairs of sectors (6/6) and hemi-rings (5/5) showed a statistically significant SNR difference.
Discussion
This study used a novel analysis protocol to detect glaucoma-tous visual field defects by comparing different sectors and hemi-rings in the superior hemifield to their corresponding fellows in the inferior hemifield. These results confirm that the mfVEP test is able to detect glaucomatous visual field
defects accurately. Based on their findings, Hood et al8 and
Dovepress
Mousa et al
Clinical Ophthalmology downloaded from https://www.dovepress.com/ by 118.70.13.36 on 21-Aug-2020
Table 4 Comparison between SNR values in superior and inferior hemifield sectors and rings in glaucoma group
Variables Superior hemifield Inferior hemifield P-value*
N M SD N M SD
Pair 1 (SS1-IS1) 36 1.54 0.222 36 1.74 0.376 0.001
Pair 2 (SS2-IS2) 36 1.58 0.215 36 1.83 0.495 0.002
Pair 3 (SS3-IS3) 36 1.46 0.313 36 1.82 0.456 ,0.001
Pair 4 (SS4-IS4) 36 1.44 0.245 36 1.81 0.489 ,0.001
Pair 5 (SS5-IS5) 36 1.58 0.286 36 1.88 0.438 ,0.001
Pair 6 (SS6-IS6) 36 1.70 0.359 36 1.85 0.472 0.033
Pair 7 (SR1-IR1) 36 1.50 0.208 36 1.74 0.331 ,0.001
Pair 8 (SR2-IR2) 36 1.52 0.265 36 1.70 0.413 0.002
Pair 9 (SR3-IR3) 36 1.54 0.264 36 1.90 0.495 ,0.001
Pair 10 (SR4-IR4) 36 1.61 0.341 36 1.90 0.361 0.001
Pair 11 (SR5-IR5) 36 1.77 0.532 36 2.02 0.552 0.001
Notes: *Paired t-test, significant when P , 0.05.
Abbreviations: iS, inferior sector; iR, inferior ring; M, mean; SD, standard deviation; SnR, signal to noise ratio; SR, superior ring; SS, superior sector.
Chen et al20 tried to answer the following questions: can the
mfVEP detect damage earlier than standard visual field test-ing? Will the mfVEP be useful in monitoring progression? They concluded that although these questions are impor-tant, they are currently unresolved. No research to date has been carried out on the role of the mfVEP in monitoring glaucomatous progression. Nevertheless, the ability of the mfVEP to detect progression will be limited by its
repeat-ability.8,11,20 Recent evidence suggests that the mfVEP can
have a clear role for monitoring and detecting progression
of glaucoma, based on good repeatability figures.4–7 The
important issue of early detection of glaucoma has yet to be
thoroughly explored, although if glaucoma is diagnosed at an early stage and treated early, visual impairment caused by the disease progression may be limited or minimal.
In some patients, the mfVEP will surpass standard visual field testing using the HFA for detecting early damage. In other patients, the reverse will be true. There are many examples where the HFA and mfVEP are not consistent and do not agree in the detection of visual field defects. The mfVEP analysis protocol detected glaucomatous field defects in both glaucoma and glaucoma suspect patients with a good level of sensitivity and specificity. Sensitivity and specificity of the HSA protocol in detecting glaucoma
1 – Specificity
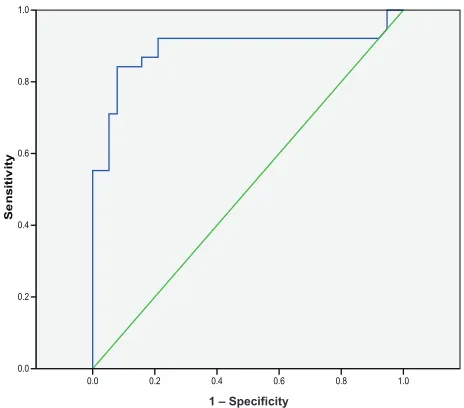
Figure 3 Receiver operating characteristic analysis for the glaucoma suspect group by multifocal VEP test in glaucoma suspect group.
Notes: Area under curve = 0.892 and sensitivity was 89%. The 79% at 2.38 SnR value was taken as the cutoff for a glaucoma suspect. The green line represents uniformed random values, the blue line is true data distribution.
Abbreviations: SnR, signal to noise ratio; VEP, visual evoked potential.
1 – Specificity
Figure 4 Receiver operating characteristic analysis for the glaucoma group by multifocal VEP test in glaucoma suspect group.
Notes: Area under curve = 0.989. Sensitivity was 97% and specificity was 86% for the detection of glaucoma. We calculated the 97% at the 1.99 SnR value as the cut-off for glaucoma. The green line represents uniformed random values, the blue line is true data distribution.
Abbreviations: SnR, signal to noise ratio; VEP, visual evoked potential.
Dovepress Hemifield sector analysis for detecting glaucomatous visual defects
Clinical Ophthalmology downloaded from https://www.dovepress.com/ by 118.70.13.36 on 21-Aug-2020
Figure 5 Components of the hemifield sector/hemi-ring analysis printout. Analysis components; color-coded averaged waveforms from the sector or hemi-ring (A), sector/hemi-ring waveform numbers (B), average SNR value for each sector/hemi-ring (C), positive peak amplitude (D), positive peak latency (E), color-coded sectors for comparison (F), color-coded hemi-rings for comparison (G).
Abbreviations: AMP, amplitude; n1, negative peak 1; P1, positive peak 1; PeT, peak time; SnR, signal to noise ratio.
was 97% and 86% respectively, whilst in glaucoma sus-pects it was 89% and 79% (Figures 3–4). These sensitivity values were similar to other findings for mfVEP perimetry using different analysis protocols. The majority of stud-ies identifying the role of the mfVEP in the detection of glaucomatous visual field defects confirmed its ability to detect existing visual field damage with high sensitivities ranging between 86% and 97.5%. For defects that are not detected by SAP, lower sensitivities are obtained, ranging between 76% and 92%, which is a good detection rate compared to the SAP given its limitations in the early stages
of glaucoma.6,7,20,21 Graham et al5 evaluated the role of the mfVEP in clinical practice. They tested 436 patients who were referred for glaucoma assessment, all undergoing mfVEP. They found that the results of the mfVEP correlated well with the stage of the glaucoma and the HFA mean deviation index, with an overall sensitivity for detecting glaucoma with established defects of 97.5%, and 95% for early defects. They reported that 92.2% of low risk suspects yielded a normal mfVEP. They showed evidence that the mfVEP is an effective method for detecting visual field loss in glaucoma. They suggested that the mfVEP test provides
Dovepress
Mousa et al
Clinical Ophthalmology downloaded from https://www.dovepress.com/ by 118.70.13.36 on 21-Aug-2020
a valuable aid to the clinician in categorizing patients with unreliable, variable, unconfirmed, or excessive subjective field loss. They concluded that the mfVEP is an effective method for detecting glaucomatous visual field defects, and that it provides the clinician with useful information about the visual field in the presence of an unreliable SAP test.
Goldberg et al9 also reported similar findings when he
com-pared the results of HFA visual field testing with mfVEP carried out on glaucoma patients. Comparing sectors and hemi-rings in each hemifield to their fellows in the opposite
hemifield will create an intraeye standardization method by making each sector a local reference to its corresponding one in the opposite hemifield. We believe that this interocu-lar standardization is superior to the two most commonly used analysis protocols: the inter-ocular analysis, where the results are binocular and each eye is compared to the other one in all its segments, and the analysis method, which compares the SNR values to normative values acquired from samples of different, normal populations. Although both eyes are almost identical in their responses under normal Figure 6 Role of the HSA protocol in identifying early field changes.
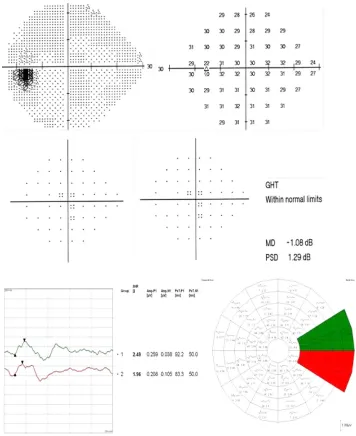
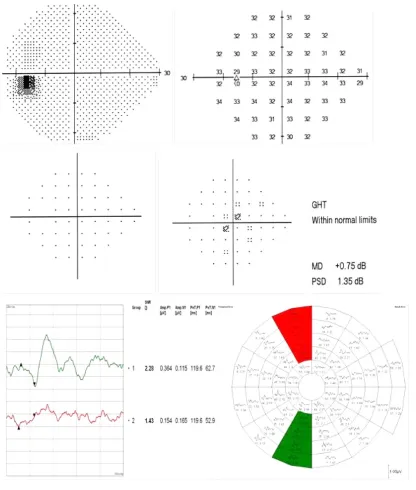
Notes: SITA standard 24-2 test and the mfVEP intersector HSA comparison in a glaucoma suspect patient. No significant visual field defects were recorded in the SITA test; neither in the total deviation or the pattern deviation plots. The GHT outcome was “within normal limits”. The intersector analysis showed a significant difference between the nasal sectors (SS1 = 2.49 and iS1 = 1.96) pointing to an early inferior reduced response. This difference could reflect an early functional change in the visual field that could not be detected by the SiTA standard test.
Abbreviations: AMP, amplitude; GHT, glaucoma hemifield test; HSA, hemifield sector analysis; IS1, inferior sector number 1; SS1, superior sector number 1; MD, mean deviation; mfVEP, multifocal visual evoked potential; n1, negative peak 1; P1, positive peak 1; PeT, peak time; PSD, pattern standard deviation; SiTA, swedish interactive threshold algorithm.
Dovepress Hemifield sector analysis for detecting glaucomatous visual defects
Clinical Ophthalmology downloaded from https://www.dovepress.com/ by 118.70.13.36 on 21-Aug-2020
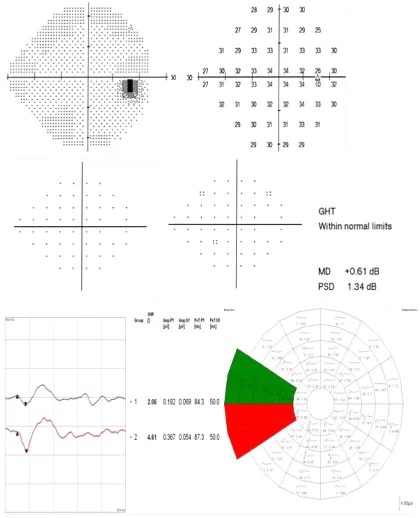
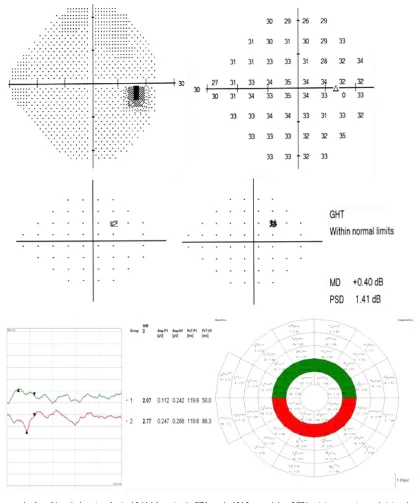
Figure 7 Another example of a possible early detection of a visual field defect using the SITA standard 24-2 test and mfVEP intersector HSA comparison in a glaucoma suspect patient.
Notes: No significant visual field defects were recorded in the SITA test; neither in the total deviation or pattern deviation plots. The GHT was “within normal limits”. The intersector analysis showed a significant difference between the nasal sectors (SS1 = 2.06 and iS1 = 4.61) pointing to an early superior reduced response. This difference could reflect an early functional change in the visual field which could not be detected by the SITA standard test.
Abbreviations: AMP, amplitude; GHT, glaucoma hemifield test; HSA, hemifield sector analysis; IS1, inferior sector number 1; SS1, superior sector number 1; MD, mean deviation; mfVEP, multifocal visual evoked potential; n1, negative peak 1; P1, positive peak 1; PeT, peak time; PSD, pattern standard deviation; SiTA, swedish interactive threshold algorithm.
circumstances22 it becomes very difficult to compare the
two eyes when both are similarly affected. The protocol described in this study is different in that it overcomes the poor detection problems of binocular analysis and makes the standard reference the sectors coming from within
the same eye, which should offer greater precision and accuracy. According to the pathophysiology of glaucoma, early defects usually originate as localized islands in one sector of a single hemifield, gradually progressing over time to form a larger defect in that hemifield, with similar
Dovepress
Mousa et al
Clinical Ophthalmology downloaded from https://www.dovepress.com/ by 118.70.13.36 on 21-Aug-2020
Figure 8 An additional example of a possible early detection of a visual field defect using the SITA standard 24-2 test and mfVEP intersector HSA comparison in a glaucoma suspect patient.
Notes: No significant visual field defects recorded in the SITA test. Some focal depression in the pattern deviation plot was present without any change in the total deviation plot. The GHT outcome was “within normal limits”. The intersector analysis showed a significant difference between the nasal sectors (SS1 = 1.43 and iS1 = 2.28) pointing to a significant superior reduced response compared to the inferior sector. This difference could reflect an early functional change in the visual field that could not be detected by the SiTA standard test.
Abbreviations: AMP, amplitude; GHT, glaucoma hemifield test; HSA, hemifield sector analysis; IS1, inferior sector number 1; SS1, superior sector number 1; MD, mean deviation; mfVEP, multifocal visual evoked potential; n1, negative peak 1; P1, positive peak 1; PeT, peak time; PSD, pattern standard deviation; SiTA, swedish interactive threshold algorithm.
changes beginning in the opposite hemifield. It should be remembered that when the glaucomatous visual field is advanced, both hemifields are equally damaged and this analysis protocol will become less effective at detecting a significant difference between the two hemifields. For this reason, we modified this analysis protocol and added an SNR grading scale for monocular analysis. The ability
of the HSA to detect early and subtle visual field changes compared to the standard SAP testing protocols has shown
good agreement with previous studies.16,20 Figure 5 shows
the components of the hemifield sector analysis protocol parameters, and how sectors and hemi-rings are evaluated. Figures 6-11 show examples of patients with suspicious presentation of glaucoma with unconfirmed diagnosis or
Dovepress Hemifield sector analysis for detecting glaucomatous visual defects
Clinical Ophthalmology downloaded from https://www.dovepress.com/ by 118.70.13.36 on 21-Aug-2020
Figure 9 An example of possible early detection of a visual field defect using the SITA standard 24-2 test and the mfVEP hemi-ring comparison analysis in a glaucoma suspect. Notes: No significant visual field defects were recorded in the SITA test. Some focal depression was present in the pattern deviation plot with a single location in the total deviation plot. The GHT was “within normal limits”. The inner hemi-ring (SR4-IR4) analysis showed a significant difference between the superior and inferior hemi-rings (SR4 = 2.07 and iR4 = 2.77) pointing to significant superior reduced response. This difference may reflect an early functional change in the visual field that could not be detected by the SiTA standard test.
Abbreviations: AMP, amplitude; GHT, glaucoma hemifield test; HSA, hemifield sector analysis; IR4, inferior ring number 4; SR4, superior ring number 4; MD, mean deviation; mfVEP, multifocal visual evoked potential; n1, negative peak 1; P1, positive peak 1; PeT, peak time; PSD, pattern standard deviation; SiTA, swedish interactive threshold algorithm.
patients considered as glaucoma suspect. These patients had both mfVEP and HFA SITA 24-2 tests done. The hemi-field sector analysis protocol detected focal defects in one hemifield compared the corresponding fellow hemifield, while no significant changes were seen in the Sap results. These SNR depressions could be considered as early glau-comatous visual field changes, and perhaps it will need
some close monitoring plan and reassessment on regular basis. However, because these mfVEP focal depressions are not conclusively considered a glaucomatous visual field defects, future longitudinal study is needed to follow those subjects to check on regular interval if they will develop glaucoma or not. As a theoretical framework for judging
whether SAP or mfVEP can be more beneficial, Hood et al8
Dovepress
Mousa et al
Clinical Ophthalmology downloaded from https://www.dovepress.com/ by 118.70.13.36 on 21-Aug-2020
Figure 10 A SITA standard 24-2 test and mfVEP test with HSA printout for a glaucoma patient with a moderate glaucomatous visual field defect.
Notes: The SITA test identified a diffuse cluster of significant defects shown in both the total and pattern deviation plots, confirmed by the GHT. The intersector hemifield analysis confirmed the defect, where it shows the superior four sectors (numbered 1–4) with lower SNR values compared to their inferior corresponding ones (numbered 5–8). This agreement is confirmatory of the role of mfVEP intersector analysis in the detection of visual field defects.
Abbreviations: AMP, amplitude; GHT, glaucoma hemifield test; HSA, hemifield sector analysis; MD, mean deviation; mfVEP, multifocal visual evoked potential; N1, negative peak 1; P1, positive peak 1; PeT, peak time; PSD, pattern standard deviation; SiTA, swedish interactive threshold algorithm; SnR, signal to noise ratio.
provided a better understanding of the two tests based upon a comparison of matched probability plots between the two tests. They concluded that the majority of the time the mfVEP can detect glaucomatous visual field defects earlier than SAP. However the reverse can also occur, assuming that SAP results are reliable. Their analysis suggested that the two tests will often agree. But regardless of the accuracy of mfVEP results and its ability to detect visual
field defects earlier, they predicted that it will not replace SAP tests in the near future. There are significant reasons that limit the use of mfVEP as a primary tool for objective visual field testing. The test time after including prepara-tion is lengthy especially when the two runs are carried out. The equipment is expensive compared to a perimeter and performing the test needs qualified and well trained tech-nical staff who can connect the electrodes accurately and
Dovepress Hemifield sector analysis for detecting glaucomatous visual defects
Clinical Ophthalmology downloaded from https://www.dovepress.com/ by 118.70.13.36 on 21-Aug-2020
Figure 11 A SITA standard 24-2 test and mfVEP test with HSA printout for a glaucoma suspect patient without any significant field defects. Notes: The GHT was “within normal limits”. The mfVEP intersector hemifield analysis showed a significant superior nasal reduction in the SNR value compared to its corresponding fellow sector in the inferior hemifield. SS1 shows a SNR value 1.99 (G4) and the IS1 SNR value is 5.18 (G1), indicating a superior nasal visual field defect. A repeated and reproducible mfVEP defect evidenced by the intersector analysis gave an indication that this defect was true and was detected at an earlier stage before SAP. Abbreviations: AMP, amplitude; G1, grade 1; GHT, glaucoma hemifield test; HSA, hemifield sector analysis; IS1, inferior sector number 1; SS1, superior sector number 1; MD, mean deviation; mfVEP, multifocal visual evoked potential; n1, negative peak 1; P1, positive peak 1; PeT, peak time; PSD, pattern standard deviation; SiTA, swedish interactive threshold algorithm.
monitor for any intratest errors. As we initially assumed, normal subjects did not show any statistically significant difference between the two hemifields, and this is because all normal responses range almost equally across the entire field, so such large hemifield differences are not expected in normal responses. This confirms that the intersector analysis protocol can identify normal visual field without significant defects. In all the examples reported here, the mfVEP analysis protocol detected significant focal reduc-tion in one hemifield compared to its corresponding fellow
in the opposite hemifield. This significant difference, when it is reproducible and repeatable, can give a good indication that there is an ongoing process of field changes that require attention, even in the absence of standard HFA defects, especially in the presence of suspicious risk factors or unreliable HFA results.
There are some limitations that make the mfVEP test either unreliable or unsuitable. These limitations could be related to technical (operational) or test-taking errors. The technical part includes limitations that can also be found
Dovepress
Mousa et al
Clinical Ophthalmology downloaded from https://www.dovepress.com/ by 118.70.13.36 on 21-Aug-2020
in standard HFA testing, such as the eyelid occluding part of the field, correction of refractive errors,23 clarity of the
ocular media,8,24 and excessive eye movements. The
influ-ence of eye movements especially in mfVEP could be a very important confounding factor as it is in the HFA test. Additionally, patient unreliability or level of cooperation is not an uncommon problem in mfVEP testing. The test itself seems very lengthy and inconvenient to some test subjects, even if they are healthy normal subjects. Patient inattentive-ness is another problem that can corrupt the VEP waveforms
with alpha waves and sleep spindles.25,26 The sectors at the
periphery are in some locations over 7° in width, leaving
large spaces in the peripheral field as “untested” or at least without a recordable response. In this case it is difficult to establish a diagnosis as a confirmed visual field defect considering only one response from such a large area; two or three adjacent points with individual responses would have been more confirmatory, as proved before in many studies.9,24,25
Conclusion
The mfVEP is an effective objective method for detect-ing glaucomatous visual field defects. The HSA protocol showed good sensitivity and specificity in detecting early glaucomatous field defects compared to standard HFA test-ing protocols. The use of the mfVEP analysis protocol can be beneficial in patients with unreliable HFA tests, possess-ing risk factors for suspicion in the absence of significant defects with perimetry, and as a baseline for all glaucoma suspect patients. Despite its limitations and relatively long test duration, the mfVEP provides very important information pertaining to early glaucomatous visual field changes.
Disclosure
The authors report no conflicts of interest in this work.
References
1. Kerrigan-Baumrind LA, Quigley HA, Pearse ME, Kerrigan DF, Mitchell RS. Number of ganglion cells in glaucoma eyes compared with threshold visual field tests in the same persons. Invest Ophthalmol Vis Sci. 2000;41(3):741–748.
2. Quigley HA, Dunkelberger GR, Green WR. Retinal ganglion cell atrophy correlated with automated perimetry in human eyes with glaucoma. Am J Ophthalmol. 1989;107(5):453–464.
3. McKendrick AM, Turpin A. Combining perimetric suprathreshold and threshold procedures to reduce measurement variability in areas of visual field loss. Optom Vis Sci. 2005;82(1):43–51.
4. Graham SL, Klistorner AI, Grigg JR, Billson FA. Objective perimetry in glaucoma: recent advances with multifocal stimuli. Surv Ophthalmol. 1999;43(Suppl 1):S199–S209.
5. Graham SL, Klistorner AI, Goldberg I. Clinical application of objective perimetry using multifocal visual evoked potentials in glaucoma practice. Arch Ophthalmol. 2005;123(6):729–739.
6. Thienprasiddhi P, Greenstein V, Chu D, et al. Detecting early functional damage in glaucoma suspect and ocular hypertensive patients with the multifocal VEP technique. J Glaucoma. 2006;15(4):321–327. 7. Thienprasiddhi P, Greenstein VC, Chen CS, Liebmann JM, Ritch R,
Hood DC. Multifocal visual evoked potential responses in glaucoma patients with unilateral hemifield defects. Am J Ophthalmol. 2003; 136(1):34–40.
8. Hood DC, Greenstein VC. Multifocal VEP and ganglion cell damage: applications and limitations for the study of glaucoma. Prog Retin Eye Res. 2003;22(2):201–251.
9. Goldberg I, Graham SL, Klistorner AI. Multifocal objective perim-etry in the detection of glaucomatous field loss. Am J Ophthalmol. 2002;133(1):29–39.
10. Hood DC, Zhang X, Greenstein VC, Kangovi S, Odel JG, Liebmann JM, Ritch R. An Interocular Comparison of the Multifocal VEP: A Possible Technique for Detecting Local Damage to the Optic Nerve Invest. Ophthalmol Vis Sci. 2000;41:1580–1587.
11. Moschos MM, Georgopoulos G, Chatziralli IP, Koutsandrea C. Multifocal VEP and OCT findings in patients with primary open angle glaucoma: a cross sectional study. BMC Ophthalmol. 2012;12:34. 12. Celesia GG, Kaufman D, Cone S. Effects of age and sex on pattern
electroretinograms and visual evoked potentials. Electroencephalogr Clin Neurophysiol. 1987;68(3):161–171.
13. one.aao.org [homepage on the Internet]. Preferred Practice Pattern Guidelines for Primary Open-Angle Glaucoma; Primary Angle-Closure Glaucoma; Primary Open-Angle Glaucoma Suspect. AAO publications; 2010. Available from: http://one.aao.org/CE/PracticeGuidelines/ PPP_Content.aspx?cid=e2387c8a-e51c-4c21-be20-c30fbf4f3260. Accessed March 26, 2013.
14. Spry PG, Henson DB, Sparrow JM, North RV. Quantitative comparison of static perimetric strategies in early glaucoma: test-retest variability. J Glaucoma. 2000;9(3):247–253.
15. Aulhorn E, Harms H. Visual Perimetry. In: Jameson D, Horvich CM, edi-tors. Handbook of Sensory Physiology. Berlin: Springer-Verlag; 1972;7. 16. Harwerth RS, Carter-Dawson L, Smith EL 3rd, Crawford ML. Scaling
the structure – function relationship for clinical perimetry. Acta Ophthalmol Scand. 2005;83(4):448–455.
17. Hood DC, Bach M, Brigell M, et al; Internation Society for Clinical Electrophysiology of Vision. ISCEV Standard for clinical multifocal elec-troretinography (mfERG) (2011 edition). Doc Ophthalmol. 2012;124(1): 1–13.
18. Baseler HA, Sutter EE, Klein SA, Carney T. The topography of visual evoked response properties across the visual field. Electroencephalogr Clin Neurophysiol. 1994;90(1):65–81.
19. Hodapp E, Parrish RK, Anderson D. Clinical decisions in glaucoma. St. Louis: Mosby-Year Book, Inc., 1993:52–61.
20. Chen C, Hood DC, Zhang X, et al. Repeat reliability of the multifocal visual evoked potential in normal and glaucomatous eyes. J Glaucoma. 2003;12(5):399–408.
21. Mansberger SL, Sample PA, Zangwill L, Weinreb RN. Achromatic and short-wavelength automated perimetry in patients with glaucomatous large cups. Arch Ophthalmol. 1999;117(11):1473–1477.
22. Hood DC, Zhang X, Winn BJ. Detecting glaucomatous damage with the multifocal visual evoked potentials: how can a monocular test work? J Glaucoma. 2003;12(1):3–15.
23. Graham SL, Klistorner AI, Grigg JR, Billson FA. Objective VEP perimetry in glaucoma: asymmetry analysis to identify early deficits. J Glaucoma. 2000;9(1):10–19.
24. Hood DC, Zhang X. Multifocal ERG and VEP responses and visual fields: comparing disease-related changes. Doc Ophthalmol. 2000; 100(2–3):115–137.
25. Wu LL, Suzuki Y, Kunimatsu S, Araie M, Iwase A, Tomita G. Frequency doubling technology and confocal scanning ophthalmoscopic optic disc analysis in open-angle glaucoma with hemifield defects. J Glaucoma. 2001;10(4):256–260.
26. Hood DC, Odel JG, Winn BJ. The multifocal visual evoked potential. J Neuroophthalmol. 2003;23(4):279–289.
Dovepress Hemifield sector analysis for detecting glaucomatous visual defects
Clinical Ophthalmology downloaded from https://www.dovepress.com/ by 118.70.13.36 on 21-Aug-2020
Clinical Ophthalmology
Publish your work in this journal
Submit your manuscript here: http://www.dovepress.com/clinical-ophthalmology-journal
Clinical Ophthalmology is an international, peer-reviewed journal covering all subspecialties within ophthalmology. Key topics include: Optometry; Visual science; Pharmacology and drug therapy in eye diseases; Basic Sciences; Primary and Secondary eye care; Patient Safety and Quality of Care Improvements. This journal is indexed on
PubMed Central and CAS, and is the official journal of The Society of Clinical Ophthalmology (SCO). The manuscript management system is completely online and includes a very quick and fair peer-review system, which is all easy to use. Visit http://www.dovepress.com/ testimonials.php to read real quotes from published authors.
Dovepress
Dove
press
Mousa et alClinical Ophthalmology downloaded from https://www.dovepress.com/ by 118.70.13.36 on 21-Aug-2020