Estimating uncertainty of temperature measurements for studies
of flow boiling heat transfer in minichannels
Dariusz Michalski1*
, Kinga Strąk2, Magdalena Piasecka3 1-3
Faculty of Mechatronics and Mechanical Engineering, Kielce University of Technology, Al. 1000-lecia P.P. 7, 25-314 Kielce, Poland
Abstract. This paper presents the method of estimating the uncertainty of temperature measurements
conducted using K-type thermocouples in the study of flow boiling heat transfer in minichannels. During heat transfer experiments, the fluid temperature at the inlet and outlet of the minichannel is measured with thermocouples connected to a DaqLab 2005 data acquisition station. The major part of the experimental setup for calibration of temperature measurement included a calibrator of thermocouples. The thermocouples were manufactured by Czaki Thermo-Product, Poland. The temperatures recorded with the thermocouples were compared statistically while measuring the temperature of demineralised water at several characteristic points at liquid phase change or using the reference temperature known from the calibrator. The experimental error of the temperature measurement method was determined according to the principles of statistical analysis. Estimates of the mean value and the experimental standard deviation of the experimental error as well as the confidence interval for a single experimental error and the measurement accuracy were presented. The uncertainty of the difference in temperature was also calculated.
1 Introduction
Contact and contactless methods can be used for measuring temperature. Previous authors’ works presented estimation of temperature measurement for studies of flow boiling heat transfer in minichannels [1, 2]. The comparison of selected two methods for temperature measurement as follows:
- infrared thermography and liquid crystals thermography contactless surface temperature measurements - were discussed in [1],
- using thermocouples (contact method) and infrared camera (contactless method) - were described in [2].
The common contact method for temperature measurement is using thermocouples for measuring the surface temperature or fluid temperature. T. J. Seebeck discovered in 1821 that it was possible to create an electrical voltage by soldering two different metals (known as “the Seebeck effect”). The voltage (electromotive force) can be measured by using two metallic elements (with different Seebeck coefficients) are joined together at one end [3]. In the world literature, researchers often use thermocouples connected to the data acquisition stations for temperature measurement as a convenient and accurate method. Several examples are described below.
In the paper [4] presented the impact of metallic porous microlayer on pressure drop and heat transfer of stainless steel plate heat exchanger. Thermocouples of J-type were used to measure of temperature in four locations i.e. at the inlet and outlet of heat exchanger cold and hot sides.
The heat transfer coefficient determination in research on single-phase laminar flow of water was discussed in [5]. The fluid temperature at the inlet and outlet to/from the test section was measured by K-type thermocouples (Omega®, 0.5 mm bead diameter, accuracy ±0.1 after calibration).
In paper [6] was described the subcooled flow boiling research and the validation for the infrared camera measurements. During experiments, K-type thermocouples were attached to the external face of the heater. The fluid temperature at the inlet and outlet of the test section were measured with T-type thermocouples and ambient temperature fluctuations - with J-type thermocouples.
Estimating uncertainty of temperature measurements obtained from thermocouples can be conducted by the conventional method presented in the Guide to the expression of Uncertainty in Measurement (GUM) or the numerical Monte Carlo method [7]. Several papers on this subject were presented in [2].
Analyzing of temperature from E-type thermocouples and relationship between the thermal electromotive force and temperature were discussed in [8].
This paper presents the method of estimating uncertainty of temperature measurements conducted using K-type thermocouples. Such measurements are conducted in research on flow boiling heat transfer in minichannels. The main aim of this work is to calculate accuracy of fluid temperature measurements by K-type thermocouples using elements of statistical analysis. Estimation of uncertainty of difference temperature was also discussed.
2 Experiment
2.1 Experimental stand for study of flow boiling heat transfer
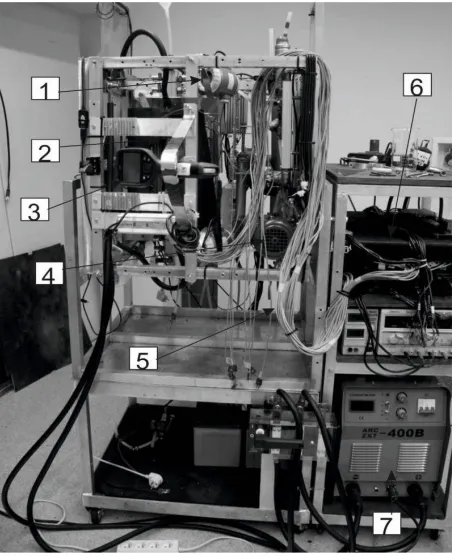
A view of the experimental stand used for flow boiling research is presented in Fig. 1.
Fig. 1. A view of the main systems of the experimental setup: 1 - a pressure meter, 2 - a test section; 3 - an infrared camera, 4 - a gear pump, 5 - a thermocouples, 6 - a data acquisition station, 7 - an inverter welder.
Fig. 2. The cross-section view of the test section: 1 - a front cover, 2,5 - a Teflon plate, 3 - a graphite plate, 4 - a heated plate, 6 - a channel body, 7 - an o-ring, 8 - a temperature measurement by thermocouple sensor, 9 - a glass panel.
The essential part of the experimental stand is a test section with a single rectangular minichannel or parallel minichannels asymmetrically heated [9-13]. The heated plate for the working fluid flowing along the minichannel is made of an alloy. Temperature of the
outer plate surface is measured using contactless temperature methods (infrared thermography or liquid crystal thermography) or contact method (with using thermocouples). Two-phase flow structures are observed through the glass panel at the other side of the plate. At the inlet and outlet of the test section, pressure meters and K-type thermocouples are installed.
The cross-section view and image of the test section with a minichannel are shown in Fig. 2 and Fig. 3, respectively.
Fig. 3. A view of the test section with a minichannel.
2.2 Experimental stand for temperature calibration
The major parts of the experimental setup for temperature calibration included (Fig. 4): an instrument for calibration of the thermocouples – a calibrator (1), thermocouples type 221-b-100 manufactured by Czaki Thermo-Product, Poland [14] (2), a compensation cable type Lx2 (3), a DaqLab 2005 data acquisition station (4), a PC computer with a specialist software (5) and an absolute pressure meter (6).
Fig. 4. A view of the experimental setup for temperature calibration: 1 - an instrument for calibration of thermocouples (a calibrator), 2 - thermocouples, 3 - compensation cables, 4 - a data acquisition station, 5 -a PC computer with data visualization and an acquisition software,
The instrument for calibration of the thermocouples type 9102 HDRC (a calibrator), manufactured by Hart Scientific (USA) [15] was used for temperature calibration experiments. The view of the calibrator is shown in Fig. 5. Thermocouples input (TC1 and TC2) are marked in this figure.
Fig. 5. A view of an instrument for calibration of
thermocouples (a calibrator) with marked TC1 and TC2 input.
2.3 Experimental methodology of temperature calibration
Two tested thermocouples’ sensors were put to the upper hole of the calibrator (TC1, TC2 input, Fig. 5) and connected due to compensating cables (3, Fig. 4) to the DaqLab 2005 data acquisition station (4). The measurement data collected at this station was transferred via the Ethernet interface to a PC computer (5). The computer was equipped with DaqView data acquisition software.
The measurements were carried out in the laboratory at 25 °C ambient temperature and atmospheric pressure of 0.975 bar. Eleven series of measurements were taken at reference temperatures in the range from 0 to 100 °C, with a temperature step of 10 °C. The reference temperature (Tref) was set on the calibrator. When temperature was stabilized during time about 15 minutes, n measurements were collected with a time step of 1 s. The recorded temperature was assumed as the arithmetic mean of 100 sampling during the selected time step. Averaging was conducted by the data acquisition station. Then, temperature was increased by ten degrees using the calibrator. Such temperature calibration procedure was repeated until the reference temperature equal to 100 °C was achieved.
3 Thermocouples
3.1 Basic data
Thermocouples are temperature sensors that respond to a change in the temperature with a change in the thermoelectric force. The K-type thermocouples applied to measure the temperature of the fluid were 0.5 mm in diameter. They were capable of measuring temperature in the range from −40 °C to 600 °C. The thermocouples were manufactured by Czaki Thermo-Product, Poland (type TP-221) with Tmax = +600 ºC. They have
a NiCr-NiAl K-type sheathed thermocouple sensor with an outer diameter of 0.5 mm. The measurement junction was galvanically isolated from the sheath (type b) and its length was L = 100 mm.
K-types thermocouples are oxidation-proof resistant to high temperature, a reducing atmosphere and sulphur compounds. They can operate at temperature up to 1000 °C or even 1100 °C; they are more resistant to high temperature than other thermocouples made of non-noble metals [14].
A scheme of used in experiments a K-type thermocouple is presented in Fig. 6.
Fig. 6. A scheme of a K-type thermocouple, Czaki Thermo-Product, Poland [14].
The accuracy of temperature measurement for K-type thermocouples was estimated at 1.5 °C in the range -40 °C ÷ 375 °C, according to manufacturer [14].
4 Results
4.1 Basic assumptions for analysis
The temperatures recorded with the thermocouples were compared statistically while measuring the temperature of demineralised water at several characteristic points at liquid phase change or using the reference temperature known from the calibrator. The experimental error of the temperature measurement method was determined according to the principles of statistical analysis. Estimates of the mean value and the experimental standard deviation of the experimental error as well as the confidence interval for a single experimental error and the measurement accuracy were presented. The uncertainty of the difference in temperature was also calculated.
4.2 Determination of corrections of temperature measurement for tested thermocouples
Corrections of temperature measurement CTi calculation were based on the following relationship [16 - 20]:
= − + + ± , (1)
where: CDR - correction for the DaqLab 2005 data acquisition station resolution, CIC - correction for the instrument for calibration of the thermocouples (a calibrator), i- number of the tested thermocouple.
= − + , (2)
The uncertainty of measurement resulting from resolution capability of the DaqLab 2005 was estimated as follows [21, 22]:
=
√ , (3)
where: a - DaqLab 2005 data acquisition station temperature measurements resolution, a = 0.1 ºC.
Uncertainty resulting from the applied etalon – the instrument for calibration of the thermocouples – was estimated as follows [21, 22]:
= ( ), (4)
where: U(Tref) - extended uncertainty of the instrument for calibration of the thermocouples, U(Tref) = 0.5 ºC [15], k - the expansion coefficient, k = 2 [1, 2, 21].
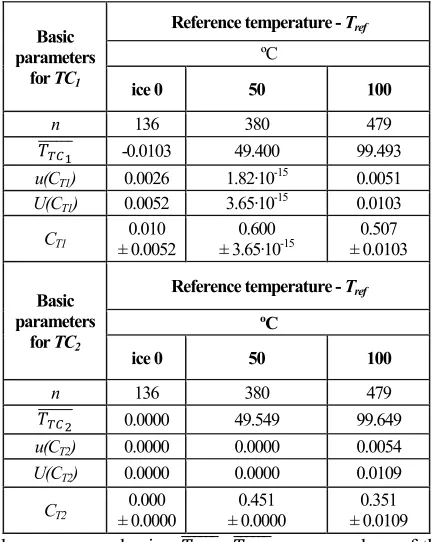
Table 1 shows the results of statistical analysis including: the selected corrections of temperature measurement obtained as the difference between the thermocouple’s measurement (TTC1 or TTC2) and the presetting temperature Tref.
Table 1. Selected corrections for temperature measurement for tested thermocouples.
Basic parameters
for TC1
Reference temperature - Tref
ºC
ice 0 50 100
n 136 380 479
-0.0103 49.400 99.493
u(CT1) 0.0026 1.82∙10-15 0.0051 U(CT1) 0.0052 3.65∙10-15 0.0103
CT1
0.010 ± 0.0052
0.600 ± 3.65∙10-15
0.507 ± 0.0103
Basic parameters
for TC2
Reference temperature - Tref
ºC
ice 0 50 100
n 136 380 479
0.0000 49.549 99.649
u(CT2) 0.0000 0.0000 0.0054
U(CT2) 0.0000 0.0000 0.0109
CT2
0.000 ± 0.0000
0.451 ± 0.0000
0.351 ± 0.0109 where: n - sample size, , – mean values of the temperature for each thermocouple, u(CT1), u(CT2) – uncertainty of correction for each thermocouple, U(CT1), U(CT2) – extended uncertainty correction for each thermocouple, CT1, CT2 – correction for each thermocouple.
Figure 7 presents the correction of temperature measurement CTi as a function of the reference temperature Tref. Values of corrections of temperature for both thermocouples do not exceed 0.6 °C and they are the highest for the reference temperature equal to 50 °C.
Fig. 7. Correction of temperature measurementCTi as a function of the reference temperature - Tref.
The maximum value of correction of temperature measurement was approx. 0.704 ± 0.0023ºC in the temperature range which was taken in experimental analysis.
4.3 The relative experimental error
The investigations included determining the measurement accuracy for two tested thermocouples. It was assumed that values of the reference temperature are based on the experimental results recorded with thermocouples and compared to values of temperature presetting on the instrument for calibration of the thermocouples [20, 21].
The relative experimental error (EME) was calculated using the following dependence [22], similarly as in [1, 2]:
=
_ , (5)
where: TTCi - temperature recorded with thermocouples (the test method), i - number of a tested thermocouple, Tref - the reference temperature, set on the calibrator.
The assumption that the reference temperatures are known from the calibrator was made similarly as reported in [2]. The relative error of the TC measurement was determined like in [16, 22].
The procedure for mean value of the experimental error (EME ) and the confidence interval (CI) calculation was carried out as follows [21]:
1. determination of the experimental errors for the TC measurement,
2. calculation of the mean values of the experimental errors,
3. determination of the intervals of confidence for the mean values of the experimental errors with normal distribution.
4.4. Method accuracy for the thermocouple measurement
The values of the relative experimental error were used to estimate the method accuracy MA. The calculations were based on the following relationship:
= | ± ∙ | ∙ 100%, (6)
-0.100.00 0.10 0.20 0.30 0.40 0.50 0.60 0.70
0 10 20 30 40 50 60 70 80 90 100
C
o
rr
ec
ti
o
n
o
f
te
mp
er
at
u
re
me
as
u
re
me
n
t
Reference temperature
-PT1 PT2 ℃
where: – mean value of the relative experimental error, k – the expansion coefficient for the level of significance = 0.05, k = 2 [21], and s – experimental standard deviation of the experimental error.
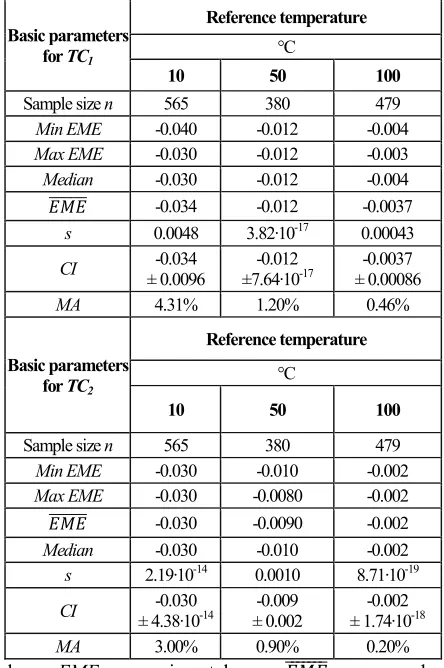
The method accuracy (MA) determined with Eq. 6 [8] was used to qualitatively assess the measurement accuracy of the Czaki Thermo-Product TP-221 K-type thermocouples employed in the tests. Table 2 shows the results of statistical analysis including the relative experimental error obtained by comparing thermocouples measurements (TTC1 and TTC2) with the temperature presented on the calibrator (the reference temperature).
From the method accuracy (MA) results shown in Table 2 it is evident that all values of parameters obtained for two thermocouples used for the measurement of the fluid temperature are similar. In certain ranges, they can be used interchangeably. Estimating of the accuracy of the temperature measurement system in scientific research can reach max. 15% [22]. In the case considered, the maximum value of MA was below 4.5% in the tested temperature range from 0 to 100 C.
Figure 8 presents the mean values of the relative experimental error as a function of the reference temperature Tref. The relative experimental method errors for both thermocouples were approximated on the following functions:
= −4 ∙ 10 + 0.0007 − 0.0369 (7)
The determination coefficient R2 = 0.9892 (Eq. 7). = −4 ∙ 10 + 0.0007 − 0.0416 (8)
The determination coefficient R2 = 0.9861 (Eq. 8).
Fig. 8. Mean values of the relative experimental error as a function of the reference temperatureTref.
In both cases, very high values of the determination coefficient were obtained. It means a very good adjustment of these functions which last coefficients in Eqs. (7, 8) differ slightly and other coefficients are equal.
Table 2. The selected method accuracy and basic statistical parameters of the experimental error.
Basic parameters for TC1
Reference temperature
°C
10 50 100
Sample size n 565 380 479
Min EME -0.040 -0.012 -0.004 Max EME -0.030 -0.012 -0.003 Median -0.030 -0.012 -0.004
-0.034 -0.012 -0.0037
s 0.0048 3.82∙10-17 0.00043
CI -0.034
± 0.0096
-0.012 ±7.64∙10-17
-0.0037 ± 0.00086
MA 4.31% 1.20% 0.46%
Basic parameters for TC2
Reference temperature
°C
10 50 100
Sample size n 565 380 479
Min EME -0.030 -0.010 -0.002 Max EME -0.030 -0.0080 -0.002 -0.030 -0.0090 -0.002 Median -0.030 -0.010 -0.002 s 2.19∙10-14 0.0010 8.71∙10-19
CI -0.030
± 4.38∙10-14
-0.009 ± 0.002
-0.002 ± 1.74∙10-18
MA 3.00% 0.90% 0.20%
where: EME – experimental error, – mean values of the relative experimental error, s – experimental standard deviation, CI – confidence interval, MA – method accuracy.
4.5 Estimation of uncertainty of the difference in temperature measurement for tested thermocouples
In this chapter estimation of uncertainty of difference in temperature measurement received from the tested thermocouples were calculated and discussed. The difference in fluid temperature at the inlet and outlet to/out of the test section with minichannels are necessary for local heat transfer calculations according to mathematical methods based on experimental results from research on flow boiling heat transfer [9 - 12, 24 - 34].
The calculations of the difference in temperature ΔT between two thermocouples’ measurements ware based on the following relationship:
∆ = − (9)
where: TTC1, TTC2 - values of temperature measured by each thermocouple.
The uncertainty of the difference in temperature ΔT was calculated using the following formula, similarly as in [21, 22]:
MA T1 MA T2 MA T1 MA T2 MA T1 MA T2 MA T1 MA T2 MA T1 MA T2 1.22% 0.99% 1.12% 0.62% 1.06% 0.83% 0.79% 0.63% 1.27% 1.00% Mediana EMEMediana EME Mediana EMEMediana EME Mediana EMEMediana EME Mediana EMEMediana EME Mediana EMEMediana EME
-0.01 -0.01 -0.01 -0.006 -0.01-0.00833 -0.00714-0.00571 -0.01125 -0.01
-0.04 -0.03 -0.02 -0.01 0.00
0 10 20 30 40 50 60 70 80 90 100
Serie1
Serie2
Wielob. (Serie1) Wielob. (Serie2)
Reference temperature -Tref, oC
1 2
1= −4 ∙ 10−6 2+ 0.0007 − 0.0369
2= 0.9861
2= 0.9892
2= −4 ∙ 10−6 2+ 0.0007 − 0.0416
(∆ ) = (∆ ) + (10)
where: s2(∆T) - difference values of temperature measurement variance, u(TDaq) - the uncertainty of measurement resulting from the resolution capability of DaqLab 2005 data acquisition station (Eq. 3).
Confidence interval was calculated based on the following relationship [21, 22]:
= ∆ ± ∙ (∆ ) (11)
where: ∆ – mean difference values of temperature measurement, k – the expansion coefficient for the level of significance = 0.05, k = 2 [21], u(T) - uncertainty of difference in values of temperature measurement (Eq. 10).
Table 3. Selected basic parameters for the difference in temperature measurement.
parameters
Reference temperature - Tref
°C
ice 0 0 10
n 136 292 565
∆ -0.003 0.031 -0.050
u(T) 0.1017 0.1123 0.1118
U(T) 0.2033 0.2247 0.2237
CI -0.003
± 0.2033
0.031 ± 0.2247
-0.050 ± 0.2237
parameters
Reference temperature - Tref
°C
20 30 40
n 491 272 334
∆ -0.100 -0.104 -0.163
u(T) 0.1001 0.1058 0.1110
U(T) 0.2002 0.2117 0.2220
CI -0.100
± 0.2002
-0.104 ± 0.2117
-0.163 ± 0.2220
parameters
Reference temperature - Tref
°C
50 60 70
n 380 567 423
∆ -0.149 -0.133 -0.133
u(T) 0.1118 0.1105 0.1105
U(T) 0.2237 0.2211 0.2210
CI -0.149
± 0.2237
-0.133 ± 0.2211
-0.133 ± 0.2210
parameters
Reference temperature - Tref
°C
80 90 100
n 362 441 479
∆ -0.189 -0.150 -0.176
u(T) 0.1047 0.1118 0.1089
U(T) 0.2094 0.2237 0.2178
CI -0.189
± 0.2094
-0.150 ± 0.2237
-0.176 ± 0.2178
Table 3 shows the results of the selected basic parameters for the difference in temperature measurement by thermocouples with presetting temperature on a calibrator of thermocouples.
The dependence of mean difference values of temperature measurement ∆ in a function of the reference temperature Tref is presented in Fig. 9.
Fig. 9. Mean difference values of temperature measurement ∆ as a function of the reference temperatureTref..
5 Conclusions
The uncertainty of fluid temperature measurements by K-type thermocouples conducted in research on flow boiling heat transfer in minichannels was estimated. It was possible due to the results obtained from temperature calibration experiments conducted on the research stand for calibration of temperature measurement included a calibrator of thermocouples. The temperatures recorded with the thermocouples were compared statistically while measuring the temperature of demineralised water at several characteristic points at liquid phase change or using the reference temperature known from the calibrator of thermocouples.
The analysis was performed to determine of the experimental error of the temperature measurement method according to the principles of statistical inference followed by the estimation of: the mean value and the experimental standard deviation of the experimental error and the confidence interval for a single experimental error and the measurement accuracy. Values of corrections of temperature for both thermocouples do not exceed 0.6 °C and are the highest for 50 °C. The maximum value of correction of
temperature measurement was approx.
0.704 ± 0.0023 ºC in the tested temperature range. The uncertainty of the difference in temperature was also calculated. Uncertainty (approx. 0.1 ºC) and extended uncertainty (approx. 0.2 ºC) of the difference in temperature for all reference temperatures were similar. The maximum value of confidence interval of the difference in temperature was approx. - 0.2 ± 0.21 ºC for each case.
0.00 0.05 0.10 0.15 0.20
0 10 20 30 40 50 60 70 80 90 100
Reference temperature
-Te
m
pe
ra
tu
re
d
iff
er
en
ce
,
oC
Nomenclature
a the DaqLab data acquisition station
temperature measurements
resolution
ºC
C correction
CI confidence interval EME experimental error
mean values of the relative experimental error
MA method accuracy %
i number of a thermocouple k the expansion coefficient n number of measurements R2 coefficient of determination s experimental standard deviation
T temperature ºC
TC thermocouple u() uncertainty
U() extended uncertainty Greek symbols
level of significance
T the difference in temperature ºC ∆ mean of the difference in
temperature values
ºC
Subscripts
Daq the DaqLab data acquisition station
DR the DaqLab data acquisition station resolution IC the instrument for calibration of
thermocouples - the calibrator ref reference
TC thermocouple
i number of a thermocouple
The research reported here in was supported partially by a grant from the National Science Centre, Poland (No. DEC-2016/23/N/ST8/01247).
References
1. M. Piasecka, D. Michalski, K. Strąk, EPJ Web Conf. 114 (02094) (2016)
2. D. Michalski, K. Strąk, M. Piasecka, EPJ Web Conf., 143 (02075) (2017)
3. M. Genix, P. Vairac, B. Cretin, Int. J. Therm. Sci. 48, 1679–1682 (2009)
4. J. Wajs, D. Mikielewicz, Appl. Therm. Eng. 93,. 1337–1346 (2016)
5. B. Mehta, A. Dhyani, S. Khandekar, Proc. of the 21st National & 10th ISHMT-ASME Heat and Mass Transfer Conf. 1–6 (2011)
6. C. E. Estrada-Perez, J. Yoo, Y. A. Hassan, Int. J. Multiph. Flow, 73, 17–33 (2015)
7. J. V. Pearce, P. M. Harris, J. C. Greenwood, Int. J. Thermophys. 31(8), 1517–1526 (2010)
8. V. A. Drebushchak, Thermochim. Acta, 603, 218–226 (2015)
9. K. Strąk, M. Piasecka, B. Maciejewska, Int. J. Heat Mass Transf. 117, 375–387 (2018)
10. B. Maciejewska, K. Strak, and M. Piasecka, Int. J. Numer. Methods Heat Fluid Flow 28(1), 206–219 (2018)
11. B. Maciejewska, M. Piasecka, Int. J. Heat Mass Transf. 107, 925–933 (2017)
12. B. Maciejewska, M. Piasecka, Heat Mass Transf. 53, 1211–1224 (2017)
13. M. Piasecka. Metrol. Meas. Syst. 20(2), 205-216 (2013)
14. https://www.czaki.pl/en/catalogue
15. https://Archive-Resources.Coleparmer.Com/ Manual_pdfs/90910-07%20manual.Pdf
16. ISO 10012:2003 Measurement management systems -Requirements for measurement processes and measuring equipment
17. Guide to the Expression of Uncertainty in Measurement BIPM, IEC, IFCC, ISO, IUPAC, IUPAP, OIML. (Polish edition) (1999)
18. EA-4/02 Evaluation of the Uncertainty of Measurement in Calibration; September rev01 (2013)
19. Guidelines on the Calibration of Digital Multimeters EURAMET cg-15 Ver. 3.0 (2015) 20. S. Adamczak, Measurement of Surface Texture.
Form Profiles, Waviness and Roughness (in Polish), WNT, Warsaw, Poland (2008)
21. M. L. Tiku, Aust. J. Stat. 22, 260–275 (1980) 22. S. Adamczak, D. Michalski, Metrol. Meas. Syst.
11(3), 221–234 (2004)
23. PN-EN 60584-1:2014-04 - Termoelementy Część 1: Specyfikacje i tolerancje EMF (in Polish)
24. B. Maciejewska, K. Strąk, M. Piasecka, Procedia Eng. 157, 82–88 (2016)
25. M. Piasecka, K. Strąk, B. Maciejewska, Heat Transf. Eng. 38(3), 332–346 (2017)
26. K. Strąk, M. Piasecka, EPJ Web Conf. 180, paper No. 02098 (2018)
27. K. Strąk, M. Piasecka, EPJ Web Conf. 143, paper No 02116 (2017)
28. B. Maciejewska, K. Strąk, M. Piasecka, EPJ Web Conf. 114, paper No. 02068 (2016)
29. M. Piasecka and K. Strąk, EPJ Web Conf. 114, paper No. 02095 (2016)
30. B. Maciejewska, M. Piasecka, K. Strąk, XIth Int. Conf. Computational Heat, Mass and Momentum Transf., May 21-24 2018, Cracow, Poland (2018) 31. W. Depczyński, A. Piasecki, M. Piasecka, K. Strąk,
E3S Web Conf. 19, paper No. 03012 (2017)
32. M. Piasecka, K. Strąk, Trans. Inst. Fuid-Flow Mach. 128, 97–118 (2015)
33. M. Piasecka, K. Strąk, B.Grabas, Arch. Metall. Mater. 62(4), 1983–1990 (2017)