Importance of Construction Sequence Analysis
in design of High Rise Building
Santosh Panigrahi1, Dr. Vikram Patil2, Madan S. H3, Somanagouda Takkalaki4
1
Civil Engineering, B.R.Harne College of Engineering & Technology, Mumbai, Maharashtra 421503, India
2 Civil Engineering, B.R.Harne College of Engineering & Technology,
Mumbai, Maharashtra 421503, India
3
Civil Engineering, B.R.Harne College of Engineering & Technology, Mumbai, Maharashtra 421503, India
4 Civil Engineering, B.R.Harne College of Engineering & Technology,
Mumbai, Maharashtra 421503, India
Abstract
While analyzing Tall structure in Conventional method the gravity loads are applied after modeling the whole structure. In actual practice the complete frames are constructed at various stages and the stability of frames varies accordingly. The applied load assumed in Conventional method will be unsuitable as per the actual construction practice. The frame should be analyzed at every construction stage considering the effect of variation of loads at each stage. This methodology is known as construction sequential analysis.
In this project the realistic structure in seismic zone III as per IS 1893:2002 (Part 1) considered to study the effect of construction sequence. Tall building of three different heights has been considered for comparative study and effect on columns and beams has been studied based on different structural parameters. Based on study the necessity of the construction sequence analysis for tall building has been understood.
Keywords: Linear Static analysis, Linear Dynamic analysis, Construction Sequence analysis, Tall buildings, Etabs version 15.
1. Introduction
A failure of the structure during construction is most vulnerable. During the construction process failure of the structures or partially completed structures often occurs. It is not necessary that the collapse of the structure is due to construction error. It may be due to lack of information during design. Generally, finite element analysis with linear static elastic method has been considered for calculation of summations of vertical column loads to determine the behavior of structures. As the construction of tall building goes on increasing with height in construction phase, the typical approach of analysis for various structural responses like Deflection, Axial loads; Shear Force and Bending Moments may have diverged from the
actual behavior. During analysis it was unable to consider so many parameters that are complex in nature. But due to advance method of finite element modeling and simulation, nonlinear analysis became very easy to accelerate proper design of structures especially high-rise.
Linear Static Analysis (LSA):
In linear static analysis first mode of the structure is considered for analysis. The modeling of the entire frame of the structure has done and then all the loads are applied after the modeling of the complete structure.
Linear Dynamic Analysis (LDA):
Linear Dynamic Analysis is also known as response spectrum analysis. In this analysis, the structure is modeled and analyzed as a multi-degree of freedom system with linear elastic stiffness matrix. The response spectrum procedure is accurate as compared to the LSA because all the higher modes are considered for analysis in this procedure. Both linear static and linear dynamic procedure are based on Conventional Method.
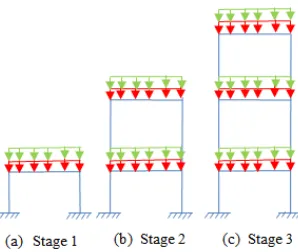
2. Construction Sequence Analysis (CSA)
constructed in stage wise as shown in the fig.2. This analysis will provide more reliable results and hence the method should be adopted in usual practice.
Fig. 1 Conventional Analysis
Fig. 2 Construction Sequence Analysis
2.1
Effect of Construction Sequence Analysis
In High Rise buildings the important facts that have very significant effect on accuracy of analysis but are rarely considered in practice during analysis, they are:
1) The effect on Structural members in terms of response due to sequential application of load during construction. 2) The effect of differential column shortening of the external and internal column supports due to the different tributary areas.
As the construction of building proceeds, the structural members are added in stage wise and the dead load is carried by that part of building completed at that particular stage of construction. Hence, the stresses and displacements distribution in the part of the completed structure at any stage due to partial dead load of members installed at that stage does not depend on the geometry, properties or the presence of members com-posing the rest of the overall structure and can be obtained correctly by summating the results of analysis at each stage. The results of the analysis of the overall structures can be obtained incorrectly by ignoring this effect. Therefore, it is very important to analyze the structure at every construction stage.
3. Objective and Scope
1) The main objective of this work is to reduce the potential for structural failure during the construction phase ultimately reducing the risk of injury and delays in construction projects.
2) To understand the high-rise structure behavior analytically during construction at different stages using construction sequence analysis.
3) Comparative study of Construction Sequence analysis with the conventional method.
4) To calculate the percentage, change in the values of various structural parameters like deflection, Bending moments, shear force and axial force of the structural elements with conventional method of analysis and Construction sequence analysis.
The Scope of work is limited to
• Detailed analytical study on Construction
Sequence Analysis of high-rise buildings using Etabs version 15 for three different height of buildings as 20 stories, 45 stories and 68 stories of R.C.C. Buildings.
• To determine the effect on structure by providing
shear wall system, Study of Transvsrse structure supporting floating column and
• Comparative study of Conventional method of
analysis with Construction Sequence Analysis.
4. Methodology
Staged construction is a feature that permits you to define a sequence of stages where the portions of the structure can be either added or can be removed; similarly selective load can be applied to portions of the structure. Staged construction is considered a type of nonlinear static analysis due to the feasibility of the change in analysis of structure during the course of the analysis. Consideration of material and geometric nonlinearity is optional. Sequence of stages has to be defined for each nonlinear staged-construction analysis case. In a single analysis any number of stages can be defined as per the requirement. For each stage specify
1) Duration, in days if time-dependent affects needs to be considered. If the user doesn’t want to consider time-dependent effects in a given stage, the duration should be assigned as zero. In this project time dependent affects are not considered.
Each stage is analyzed separately in the order the stages are defined. These occur instantaneously in time, i.e., the analysis may be incremental, but no time elapses from the point-of-view of the material. The stage is analyzed as follows:
1) The groups to be added, if any, are processed. For each non-joint object added, all joints connected to that object also added, even if they are not explicitly included in the group.
2) All specified loads will be increased linearly during the course of the analysis. Loads specified on all objects in a group will only be applied to objects that are actually present in the structure or are being added in this stage.
5. Problem Statement
The present study conducted on ongoing project of DB Crown in Prabhadevi, Mumbai involves conducting sequential analysis. The aim of study is to find out the differences in forces & displacement of an irregular shaped high rise building using Etabs 15.0 software as compared to normal linear dynamic analysis.
In this present study sequential analysis of 20 story, 45 story and 68 story will be carried keeping the plan same as shown in Figure 3. The plan dimension in X direction is 64.8m and in Y direction is 38.1m. In the elevation typical floor height 3.0m.
Fig. 3 Typical floor Plan
In this present study sequential analysis of 20 story, 45 story and 68 story will be carried keeping the plan same as shown in Fig.3. The plan dimension in X direction is 64.8m and in Y direction is 38.1m. In the elevation typical floor height 3.0m.
• Building 1: story’s 20 and height is 67.55m.
• Building 2: story’s 45 and height is 159.35m.
• Building 3: story’s 68 and height is 249.15m.
• Transfer Girder Level: 2nd podium level and 1st typical level.
• Size of Transfer Girder GB1: 750mm X 2000mm.
• Floating Column: FC1
• Column from Base: C3
• Beams supporting on floating column: B1
• Minimum thickness of Wall: 230 mm.
• Maximum thickness of Wall: 900 mm.
• Grade of Concrete: M70, M60, M50, M40.
• Grade of reinforcement: Fe 500.
• Seismic Zone (Z): III
• Seismic Zone Factor: 0.16
• Response Reduction Factor ( R ): 4
• Importance Factor: 1
• Soil Type: Hard Soil
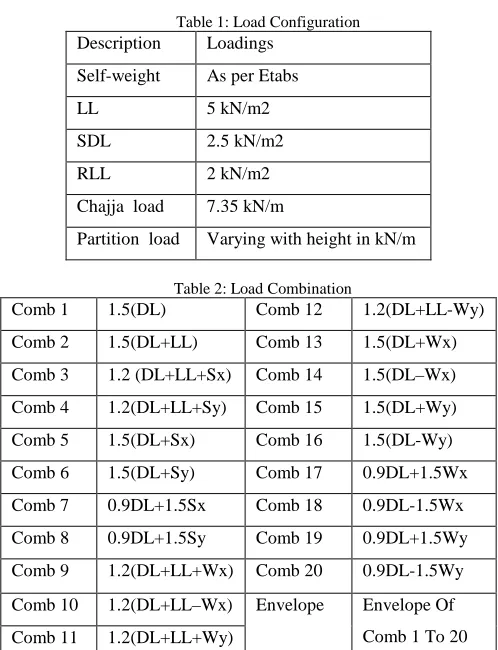
Table 1: Load Configuration Description Loadings
Self-weight As per Etabs
LL 5 kN/m2
SDL 2.5 kN/m2
RLL 2 kN/m2
Chajja load 7.35 kN/m
Partition load Varying with height in kN/m
Table 2: Load Combination
Comb 1 1.5(DL) Comb 12 1.2(DL+LL-Wy)
Comb 2 1.5(DL+LL) Comb 13 1.5(DL+Wx)
Comb 3 1.2 (DL+LL+Sx) Comb 14 1.5(DL–Wx)
Comb 4 1.2(DL+LL+Sy) Comb 15 1.5(DL+Wy)
Comb 5 1.5(DL+Sx) Comb 16 1.5(DL-Wy)
Comb 6 1.5(DL+Sy) Comb 17 0.9DL+1.5Wx
Comb 7 0.9DL+1.5Sx Comb 18 0.9DL-1.5Wx
Comb 8 0.9DL+1.5Sy Comb 19 0.9DL+1.5Wy
Comb 9 1.2(DL+LL+Wx) Comb 20 0.9DL-1.5Wy
Comb 10 1.2(DL+LL–Wx) Envelope Envelope Of
Comb 1 To 20 Comb 11 1.2(DL+LL+Wy)
Note: DL= self-weight, SDL, Chajja, Partition load
LL= Live, RLL= Reducible Live, Sx, Sy = Dynamic Seismic Force; Wx, Wy= Dynamic Wind force.
5.1
Procedure used for Nonlinear Analysis in Etabs
1) Created 2 models for each of RC framed 20, 45
and 68 story in computer program Etabs v.15. Model 1 is for Conventional method and Model 2 is for Construction sequence analysis.
2) Define the static load to be used in the analysis.
3) Define dynamic function need to be used for
4) Define Auto Construction sequence load case with load case Dead and SDL having scale factor 1.0.
5) Replace Dead and SDL type load case in default
load combination.
6) Run the model for basic linear dynamic analyses
and Construction sequence analysis.
7) Review results of various structural parameters.
6. Results
The structure has been studied for parameters axial force, bending moment, shear force and deflection for conventional method and compared with CSA for Envelope combination as shown below.
6.1
Building 1 of 19 story
Fi g. 4 Axial Force of FC1
From Fig. 4 for FC1 axial force in model 1 is 4827kN and in model 2 it is 6164kN having difference of 28% at P2 level and increasing upto maximum 54% at story 18.
Fig. 5 Axial Force of C3
From Fig. 5 for C3 axial force in model 1 is 26373kN and in model 2 it is 34957kN having maximum difference of 33% at B2 level.
Fig. 6 Bending Moment of GB1
From Fig. 6 for GB1 the variation of Bending Moment is 24% at midspan and 28% support respectively.
Fig. 7 Shear Force of GB1
From Fig. 7 for GB1 the variation of Shear Force is 26%.
Fig. 8 Deflection of GB1
From Fig. 8 for GB1 the variation of Deflection is 29%.
Fig. 10 Support Bending Moment of B1
From Fig. 9, 10 For B1 bending moment at midspan in model 1 is 519kNm & in model 2 it is 640kNm with difference of 23% at P2 level and reducing at P8 level & at Support in model 1 is 1076kNm & in model 2 it is 1383kNm with difference of 29% at P2 level and reducing at P9 level in CSA.
Fig. 11 Shear Force of B1
From Fig. 11 for B1 Shear force in model 1 is 501kN and in model 2 it is 631kN with difference of 26% at P2 level and reducing at P8 level in CSA.
6.2
Building 2 of 45 story
Fi g. 12 Axial Force of FC1
From Fig. 12 for FC1 it can be seen that axial force in model 1 is 6565kN & in model 2 it is 9129kN having difference of 40% at P2 level and increasing upto maximum 85% at story 44.
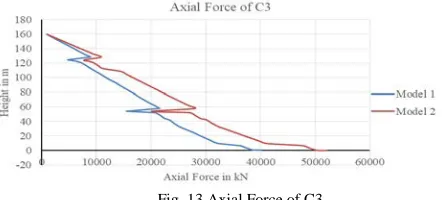
Fig. 13 Axial Force of C3
From Fig. 13 for C3 it can be seen that axial force in model 1 is 40051kN and in model 2 it is 52086kN having difference of 31% at B2 level and increasing upto maximum 65% at story 36.
Fig. 14 Bending Moment of GB1
From Fig. 14 for GB1 the variation of Bending Moment is 32% at midspan and 28% support respectively.
Fig. 15 Shear Force of GB1
From Fig. 15 for GB1 the variation of Shear Force is 29%.
Fig. 16 Deflection of GB1
Fig. 17 Midspan Bending Moment of B1
Fig. 18 Support Bending Moment of B1
From Fig. 17, 18 For B1 Bending moment at midspan in model 1 is 599kNm & in model 2 it is 890kNm with difference of 49% at P2 level and reducing above story 20 & in support in model 1 is 1364kNm and in model 2 it is 1842kNm having difference of 35% at P2 level and reducing above story 20 in CSA.
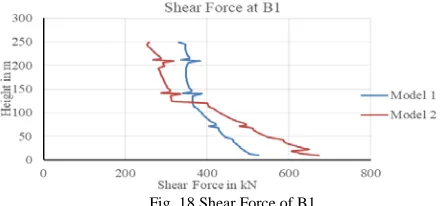
Fig. 18 Shear Force of B1
From Fig. 18 for B1 Shear force in model 1 is 567kN & in model 2 it is 731kN having diff. of 29% at P2 level & reducing above story 22 in CSA.
6.3
Building 3 of 68 story
Fig. 19 Axial Force of FC1
From Fig. 19 for FC1 axial force in model 1 is 10239 kN and in model 2 it is 13617 kN having difference of 33% at P2 level with maximum difference of 67% at story 68.
Fi g. 20 Axial Force of C3
From Fig.20 for C3 axial force in model 1 is 60856kN and in model 2 it is 83528kN having difference of 38% at B2 level with maximum difference of 55% at story 38.
Fig. 21 Bending Moment of GB1
From Fig. 21 for GB1 the variation of Bending Moment is 33% at midspan and 28% support respectively.
Fig. 22 Shear Force of GB1
Fig. 23 Deflection of GB1
From Fig. 23 for GB1 the variation of Deflection is 27%.
Fig. 24 Midspan Bending Moment of B1
Fig. 25 Support Bending Moment of B1
From Fig. 24, 25 for B1 bending moment at midspan in model 1 is 903kNm & in model 2 it is 1327kNm having difference of 47% at P2 level and reducing above story 30 & in Support in model 1 is 1415kNm and in model 2 it is 2058kNm having difference of 45% at P2 level and reducing above story 34 in CSA.
Fig. 18 Shear Force of B1
From Fig.18 for B1 Shear force in model 1 is 526kN and in model 2 it is 673kN having difference of 28% at P2 level and reducing above story 34 & in B2 Shear force in model 1 in CSA.
Table 3 - Results of GB1 for 19 storey
Parameters location Model 1 Model 2 % difference Bending
moment (kNm)
Midspan 17417 21643 24
Support 2815 3598 28
Shear Force (kN)
Support 3341 4211 26
Defn (mm) Midspan 68.8 88.66 29
Table 4 - Results of GB1 for 45 storey
Parameters location Model 1 Model 2 % difference Bending
moment (kNm)
Midspan 24145 31967 32
Support 14182 18158 28
Shear Force (kN)
Support 5800 7483 29
Deflection (mm)
Midspan 59.6 77 29
Table 5 - Results of GB1 for 68 storey
Parameters location Model 1 Model 2 % difference Bending
moment (kNm)
Mid- span
24354 32345 33
Support 14301 18369 28
Shear Force (kN)
Support 5847 7567 29
Deflection (mm)
Mid-span
65.1 82.6 27
7. Conclusion
The structure has been studied for parameters axial force, shear force, bending moment and deflection for Envelope combination by conventional method and compared with CSA for columns and beams as shown below.
1) The Envelope Forces of Dead load and Live load including Earthquake and Wind forces combination in CSA are higher than Conventional method.
2) The Axial Force in Floating Column supported by Girder Beams and the Columns starring form base increases by approximately 30% to 80% in CSA as compared to Conventional method concludes that ignoring CSA can probably underestimate the Column Axial Force which can effect in design of Columns.
3) The Transfer Girder Bending Moment, Shear Force and Deflection increases by approximately 25% in CSA as compared to Conventional method concludes that the CSA method should be adopted to avoid the probability of failure of Girder Beam.
and linearly reduces for above story which concludes that the Beam Forces can be probably overestimated at top story and underestimated at bottom story using conventional approach.
5) Shear Forces probably increases at bottom levels and goes on reducing at top levels in CSA which get ignored in Conventional method.
Hence it is necessary to consider the Construction Sequence Analysis method for tall buildings.
References
[1] M. Asce and E-Doo Kim, Chang-Koon Choi “Multistory Frames Under Sequential Gravity Loads” Journal of Structural Engineering, ASCE, Vol 111 No.11, Nov 1985, pp 2373-2384
[2] Hye-Kyo Chung, Chang-Koon Choi, Dong-Guen Lee and E. L. Wilson “Simplified Building Analysis with Sequential Dead Loads-CFM” Journal of Structural Engineering, ASCE, Vol 118, No.4, April 1992, pp 944-954
[3] A. R. Mari, P. J. S. Cruz; and P. Roca “Nonlinear Time-Dependent Analysis of Segmentally Constructed Structures” Journal of Structural Engineering, ASCE, Vol 124, No.3, March 1998, pp 278-287
[4] W. Jayasena, M. T. R. Jayasinghe, “Effects of Axial Shortening of Columns on Design and Construction of Tall Reinforced Concrete Buildings” Practice Periodical on Structural Design and Construction, ASCE, Vol 9, No.2, May 2004, pp 70-78
[5] Hyo-Gyoung Kwak, “Time-dependent analysis of RC frame structures considering construction sequences” Building and Environment, ELSEVIER, Vol 41, No.10, Oct 2006, pp 1423-1434
[6] A. Vafaia, M. Ghabdian, H.E. Estekanchi and C.S. Desai, “Calculation of Creep and Shrinkage in Tall Concrete Buildings using Nonlinear Staged Construction Analysis” Asian Journal of Civil Engineering, Building and Housing, Vol 10, No.4, 2009, pp 409-426
[7] H.S. Kim and S.H. Shin, “Column Shortening Analysis with Lumped Construction Sequences” Procedia Engineering, ELSEVIER, Vol 14, Oct 2011, pp 1791-1798
[8] H. L. Yip, F. T. K. Au, S. T. Smith, “Serviceability Performance of Prestressed Concrete Buildings Taking into Account Long-Term Behaviour and Construction Sequence” Procedia Engineering, ELSEVIER, Vol 14, 2011, pp 1384-1391
[9] Taehun Ha and Sungho Lee, “Advanced Construction Stage Analysis of High-rise Building Considering Creep and Shrinkage of Concrete” Advances in Structural Engineering and Mechanics, 2013, pp 2139-2147
10] K M Pathan, Sayyad Wajed Ali, Hanzala T Khan, MS Mirza, Mohd Waseem, Shaikh Zubair, “Construction Stage Analysis of RCC Frames” International Journal of Engineering and Technology Research, issue 3, June 2014, pp 54-58
[11] Giray Ozay, W. Njomo, “Sequential analysis coupled with optimized substructure technique modelled on 3D-frame construction process” Engineering Structures, ELSEVIER, Vol 80, Oct 2014, pp 200-210
[12]Yousuf Dinar, Munshi Md. Rasel, Muhammad Junaid Absar Chowdhury, Md. Abu Ashraf, “Chronological Construction Sequence Effects on Reinforced Concrete and Steel Buildings” The International Journal of Engineering and Science, issue 1, Dec 2014, pp 52-63
[13]Nishant Dubey, Ranjan S. Sonparote, Ratnesh Kumar, “Effect of construction sequence analysis on seismic performance of tall buildings” Journal of Civil engineering and Environmental Technology, Vol 2, June 2015, pp 44-49. [14] Sagupta R. Amin, S.K. Mahajan, “Analysis of Multi Storied
RCC Building for Construction Sequence Loading” International Journal of Modern Trends in Engineering and Research, Vol 2, Issue 7, July 2015, pp 977-981
[15]V.Subba Rao Jagarlamudi, K. Manoj, “Study and Comparison of Construction Sequence Analysis with Conventional Lumped Analysis Using Etabs” International Journal & Magazine of Engineering Technology, Vol 2, Sept 2015, pp 265-268
[16]Mohammed Abdul Rahman, Prof. Mrs. K. Mythili, “Construction Sequence Analysis of a Building with Vertical Discontinuity” Global Journal of Engineering Science and Researches, Vol 2, Issue 10, Oct 2015, pp 79-85
[17] Geethu Girija Das, Dr. Praseeda K.I, “Comparison of Conventional and Construction Stage Analysis of a RCC Building” International Journal of Science Technology & Engineering, Vol 3, Issue 3, Sept 2016, pp 50-57
[18] Meghana. B.S and T.H. Sadashiva Murthy, “Comparison of Linear Static Analysis and Construction Sequence Analysis on Multistorey Building with RC Floating Column Resting on RC and Composite Transfer Girders” International Journal of Engineering Trends and Technology, Vol 36, No 7, June 2016, pp 343-346
[19] Ankur Dubey and Dr. Sudhir S Bhadauria, “Comparative analysis of a 50 storey RCC frame with Shear wall for conventional loading and construction sequence loading” International Research Journal of Engineering and Technology, Vol 04, No 5, May 2017, pp 1419-1424
[20] Vignesh Kini K, Rajeeva S V, “Comparison of Response Spectrum analysis and Construction sequence analysis of RC and Steel concrete composite multi story building with floating columns” International Journal of Research in Engineering and Technology, Vol 06, Issue No 5, May 2017, pp 63-68
I.S. Codes
[21] IS 456 (2000) - “Plain and Reinforced Concrete – Code of Practice’.
[22] IS1893(2000) Part I, ‘Criteria for Earthquake Resistant Design of Structures’, Part I, Bureau of Indian Standards, New Delhi, India.
[23] IS 875(Part 1) 1987 – “Code of Practice for Design Loads (Other than Earthquake) for buildings and Structures “, Part 1- Dead Loads
[24] IS 875(Part 2) 1987 – “Code of Practice for Design Loads (Other than Earthquake) for buildings and Structures “, Part 2- Imposed Loads
Santosh D. Panigrahi P.G Student of B. R. Harne College of Engineering and Technology, Mumbai University.
Dr. Vikram A. Patil Principal and Guide of B. R. Harne College of Engineering and Technology, Mumbai University completed his Ph.D in Structural Engineering from IIT-Roorkee.
Mr. Madan S. H. Assistant Professor and Co-Guide of B. R. Harne College of Engineering and Technology, Mumbai University completed his Masters in Structural Engineering from VTU University, Karnataka