Available online: https://edupediapublications.org/journals/index.php/IJR/ P a g e | 2905
Portfolio Management and Risk Perception-A Study on Equity
Investors in Hyderabad City
Mrs. A.P. SHALINI
Associate Professor, Villa Marie PG College for Women, Somajiguda, Hyderabad - 500 082, INDIA
Abstract
Recognizing the significant factors impelling individual investor’s decision to create portfolio choices is vital to understand their different investment behaviour. This study discovers individual investor’s first choice for portfolio and as an interim measure investigates impacts of risk perception and risk tolerance on their investment decision. Precisely it has been decide socio-economic status difference in investment preference for portfolio choices with respect to investor’s income level and age. Analysis on investment experiments to acquire some evidences from a sample of 80 respondents in survey. The result shows that investor’s decisions to create their portfolio choices are considerably and negatively related to personal income level. This finding incriminates that investor with higher risk tolerance level shows higher likelihood to make their investment decision on portfolio choices it is found that male investor exhibits much preference on portfolio choices with higher percentage of total return.
Keywords: Risk Perception, Risk Management, Portfolio Management, Equity Investors
Introduction
Portfolio management concerns the assembling and maintenance of an assortment of investment. It is investment of funds in different variety of securities where the total amount of risk of the portfolio is minimized, while expecting maximum return from it. It primarily consists of diminishing risk instead of increasing return. Return is understandably significant although, the eventual objective of portfolio manager is to attain a chosen level of return by incurring the minimum possible risk.
Available online: https://edupediapublications.org/journals/index.php/IJR/ P a g e | 2906
investors in efficient markets, behavioural finance presumes people are normal. Regardless of great intensity of interest in this area, not much research looks at the principal factors that perhaps may lead to individual differences and play a substantial role in shaping people’s financing and investment strategies in evolving market.
Literature Review
Literature on Behaviour Finance Perspective of Individual Investor
As an outcome of traditional finance theory looks to play a restricted role in understanding this issues for instance; why do individual investors trade, how do they accomplish the task, how do they choose their portfolios to adapt their conditions and why do returns diverge so swiftly even across stocks for reasons other than risk. In the new pitch of behaviour finance or pretended behaviour economic, this could interpret about individual investors behave in their invest choice more utterly. Most of behavioural finance researchers frequently claimed that the genuineness results presents no unified theory contrasting traditional finance theory look as
expected utility investigation issues of
behavioural finance research. Maximizations using rational beliefs its means those scholars in
this field really hypothetical that whole investors in financial market are rationales; they can’t influenced through any factors except maximum profit. Most of the authors show behaviour finance perspective on individual investor, such as Deaux and Emswiller (1974), Lenney (1977), Maital et al. (1986), Thaler and Johnson (1990) and Beyer and Bowden (1997). Those authors are to exclaim that individual investor would demonstrate different risk attitude when facing investment alternatives Later instruction in our research, we called risk perception and risk tolerance of individual investor. Paralleling with previously research, the current study is paying attention on psychological factors and external factors about how to affect investor’s investment decision and portfolio choice. For example, Annaert et al. (2005), Wang et al. (2006) point out the impact of information asymmetric problem on investor behave; this is additional subject in behavioural finance field.
Literature on Risk Perception, Risk Tolerance and Portfolio Choice
Available online: https://edupediapublications.org/journals/index.php/IJR/ P a g e | 2907
(1997), Grable and Lytton (1999), Grable (2000), Hallahan et al., (2003), Hallahan et al., (2004), Frijns et al., (2008), and Veld and Veld-Merkoulova (2008). In terms of diverse risk perception or risk tolerance level, individual investor may demonstrate distinct reaction base upon their psychology factor and economic situation that would lead to heterogeneous portfolio choice for individual investors. Therefore, it is important to distinguish and attitudinal how the individual investors with different risk perceptions and risk tolerance make their invest products choice on investment plan, in specific socio-economic status differentials may make their choice show a discrepancy and difference
Grable and Joo (1997), Grable and Lytton (1999), and Grable (2000) Financial risk tolerance is defined as the maximum amount of uncertainty that someone is willing to take when making a financial decision. Though the significance of assessing financial risk tolerance is well documented, in practice the assessment process tends to be very challenging due to the subjective nature of risk taking (the risk of investor willing to reveal their risk tolerance) and objective factors like
Droms, (1987), Hallahan et al., (2004) Risk tolerance embodies one persons’ attitude on the way to taking risk. This indication is a significant concept that has implications for both financial service providers and consumers (investors). Later, risk tolerance is one factor which may define the appropriate composition structure of variety of assets in a portfolio which is optimal and satisfied investors invest preference in terms of risk and return relative to
the needs of the individual investors.
Literature on Investor’s Socio-Economic Status and Risk Tolerance
Available online: https://edupediapublications.org/journals/index.php/IJR/ P a g e | 2908
and net assets. Precisely, though debate remains on some issues, a variety of common findings are usually observed. There are five phenomenon in socio-economic status variables differential and portfolio choice which are as follows: First, risk tolerance declines with age (e.g., Morin and Suarez 1983; Roszkowski, Snelbecker, and Leimberg 1993). Second, females have a lower preference for risk than males (e.g., Roszkowski, Snelbecker, and Leimberg 1993; Grable 2000). Third, risk tolerance increases with education level (e.g., Roszkowski, Snelbecker, and Leimberg 1993; Haliassos and Bertaut 1995). Fourth, risk tolerance increases with income level and net assets (e.g., Cohn et al. 1975; Roszkowski, Snelbecker, and Leimberg 1993; Bernheim, Skinner, and Weinberg 2001). Fifth, single (i.e., unmarried) investors are more risk tolerant than married (e.g., Roszkowski, Snelbecker, and Leimberg 1993
Objectives
To understand the risk perception of
equity investors in Hyderabad city
To bring out the significance of portfolio
management of equity investors
To understand the Investors knowledge
and experience of investing in equities
Scope
The study has a broader scope as it relates to investment in equities and also understanding of individual investors about the equities. The study also helps us to know the portfolio management of equity investors
Research Methodology
The study has been carried out through survey method from the sample size of 80 respondents by providing a list of questionnaire. The sample has been selected on random basis.
Data Analysis
Available online: https://edupediapublications.org/journals/index.php/IJR/ P a g e | 2909
Type of Investment Preferred and Time taken for Evaluation of Performance of
Investment by the Respondents
Table - 1
Sl. No Type of No. of % Period of No. of %
Investment Respondents Time Respondents
1 Bonds 21 26.25 Monthly 29 36.25
2 Equities 43 53.75 Quarterly 18 22.50
3 Bank Deposits 16 20.00 Annually 20 25.00
4 T-Bills 0 0.00 Over 5 Years 13 16.25
Total 80 100.00 Total 80 100.00
From the above table, it shows that 53.75% of the respondent’s preferred Equity type of investments, 20% of the respondents preferred Bank Deposits and 26.25% of the respondents preferred bonds type of investment. No one prefers T Bills. , it has been also clear that 36.25% of the respondents judge the
performance of investment in a month, 22.50% of the respondents judge the performance of investment Quarterly, 25% of the respondents judge the performance of investment Annually and 16.25% of the respondents take over 5 years to judge the performance of the investment.
Performance about their Financial Future and age from which the Respondents are investing
Table - 2
Sl. No Financial No. of % Age of Investing No. of %
Future Respondents Respondents
1 Very optimistic 19 23.75 Age 60 Plus 15 18.75
2 Positive 27 33.75 Age 50 to 59 19 23.75
3 Unsure 23 28.75 Age 40 to 49 22 27.50
4 Pessimistic 11 13.75 Age below 40 24 30.00
Total 80 100.00 Total 80 100.00
From the above table, it shows that 33.75% of the respondents are positive about their financial future, 23% of the
Available online: https://edupediapublications.org/journals/index.php/IJR/ P a g e | 2910
respondents are Pessimistic. It is found that 23.75% of the respondents have invested in age between 50 to 59 years, 27.50% of the respondents have invested in the age between 40 to 49 years, 30% of the
respondents have invested in the age less than 40 years, and 18.75% of the respondents have invested in the age 60 and above. It is revealing that people under 40 years 30% have been investing.
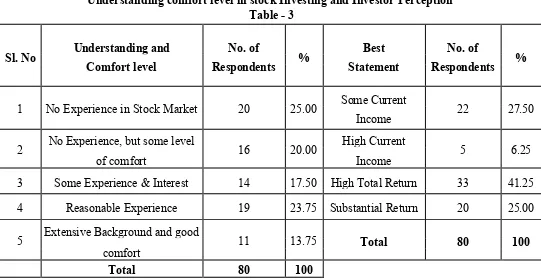
Understanding comfort level in stock Investing and Investor Perception Table - 3
Sl. No Understanding and No. of % Best No. of %
Comfort level Respondents Statement Respondents
1 No Experience in Stock Market 20 25.00 Some Current 22 27.50
Income
2 No Experience, but some level 16 20.00 High Current 5 6.25
of comfort Income
3 Some Experience & Interest 14 17.50 High Total Return 33 41.25
4 Reasonable Experience 19 23.75 Substantial Return 20 25.00
5 Extensive Background and good 11 13.75 Total 80 100
comfort
Total 80 100
From the above table, shows that 25% of the respondents have no experience in stock market, 23.75% of the respondents have reasonable experience, 20% of the respondents have no experience but some level of comfort, 17.5% of the respondents have some experience and interest and
Available online: https://edupediapublications.org/journals/index.php/IJR/ P a g e | 2911
substantial return.
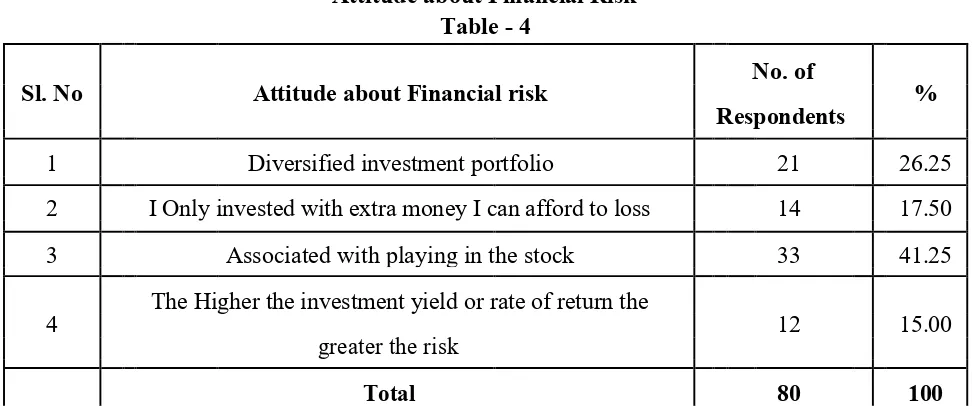
Attitude about Financial Risk Table - 4
Sl. No Attitude about Financial risk No. of %
Respondents
1 Diversified investment portfolio 21 26.25
2 I Only invested with extra money I can afford to loss 14 17.50
3 Associated with playing in the stock 33 41.25
4 The Higher the investment yield or rate of return the 12 15.00
greater the risk
Total 80 100
From the above table, it is clear that playing in the stock market, 26.25% of the respondents have diversified investment portfolio, 17.5% of the respondents afford to
loss, and 15% of the respondents has an attitude that the higher the investment yield or rate of return the greater the risk and 41.25% of the respondents associated with playing in the stock.
Time Horizon for Withdrawals and Growth Expected Of Investment in 5 Years
Table - 7
Sl. No Time Horizon for No. of % Growth No. of %
withdrawals Respondents Expected Respondents
1 Currently 25 31.25 0 to 15% 21 26.25
2 Less than 3 Years 15 18.75 15% to 30% 19 23.75
3 Between 6 to 15 Years 28 35.00 30% to 50% 23 28.75
4 After 15 Years 12 15.00 Above 50% 17 21.25
Available online: https://edupediapublications.org/journals/index.php/IJR/ P a g e | 2912
From the above table, it is found that 35% of the respondents will make withdrawals between 6 to 15 years, 31.25% of the respondents currently need to make withdrawals, 18.75% of the respondents will withdraw in less than 3 years and 15% of the respondents will withdraw after 15 years. It
is clear that 28.75% of the respondents expect their investment to grow from 30% to 50%, 26.25% of the respondents expect their investment to grow from 0 to 15%, 21.25% of the respondents expect a growth above 50% and 23.75% of the respondents expect a growth from15% to 30%.
Sharing Information about Risk with Consultant, Learns from Risk and Measure toControl Risk
Table – 8
Sl. No Feel Free RespondentsNo. of % From RiskLearn RespondentsNo. of % Control RiskMeasure to RespondentsNo. of %
1 Yes 51 63.75 Yes 27 33.75 Avoidance 35 43.75 2 No 29 36.25 No 53 66.25 Modification 45 56.25
3 Total 80 100 Total 80 100 Total 0 100
From the above table, it is found that 63.75% of the respondents feel free to share information on risk with consultant and 36.25% the respondents do not feel free to share information with the consultant. It is found that 66.25% of the respondents do not learn from their risk and 33.75% of the respondents learn from their risk. The table shows that 56.25% of respondents control the risk by modification and 43.75% of the respondents avoid risk
Findings
45% of the respondents are not experienced
in the stock market.
The highest proportion of the
respondent i.e. 30% belongs to the age
between below 40 of age years.
53.75% of the respondents are
purchased Equities type of investments.
23.75% of the respondents are optimistic of
their financial future.
41.25% of the respondents describe high
total return as best statement.
41.25% of the respondents are
associated with playing in the stock
market.
28.75% of the respondents are
Available online: https://edupediapublications.org/journals/index.php/IJR/ P a g e | 2913
56.25% of respondents control the risk by
modification.
Conclusion
The study is made to find out “Risk perception and portfolio management of equity investors”. The study reveals that the investors in Hyderabad city are not aware of portfolio which would minimize risk and maximize the return. And also it is clear that the investors in Hyderabad city have low level of understanding about risk and the importance of portfolio management as they are not aware these factors. Hence proper should to be taken in order to improve the awareness level in the minds of the
investors. Most of the respondents are not
aware of Portfolio Management. So, proper
guidance can be given to them. This is to create awareness. A regular investor friendly seminar can be organized to suit the timings of the investing public. For instance, such seminars can be interactive sessions, arranged at frequent intervals. The newsletters published help investors. Hence newsletters / bulletins can be published for guidance. Efforts should be taken to popularize Equity through appropriate publicity measures.
Bibliography
Alex Kane: (Mar- 1982) Skewness Preferences and Portfolio Choice, Journal of Financial and Quantitative Analysis,
Vol 17, No.1
Asai, M. and M. McAleer (2007), Portfolio index GARCH: a class of parsimonious dynamic covariance models, Unpublished Paper, University of Western
Australia
Bollerslev, T. (1990), modelling the coherence in short-run nominal exchange rates: a multivariate generalized ARCH model, Review of Economics and
Statistics, 72
Campbell, J.Y. (1987), Stock returns and the term structure, Journal of Financial
Economics, 18, 373-399
Chen, N.F., R. Roll and S.A. Ross (1986), Economic forces and the stock markets,
Journal of Business
Fama, E.F. and K.R. French (1989), Business conditions and expected returns on stocks and bonds, Journal of Financial
Economics
Available online: https://edupediapublications.org/journals/index.php/IJR/ P a g e | 2914
Theory of Investment, the American
Economic Review, Vol.6.
Freid.D Arditti,(Mar, 1967), Risk and the
Required on Equity, Journal of
Finance,Vol.22.
Harry Markowitz (1992) Portfolio
Selection: Efficient Diversification of Investments, New Haven, Yale University
Press.
Jorion, P. (2000), Value at Risk: The New Benchmark for Managing Financial Risk,
McGraw-Hill, New York.
McAleer, M. (2005), Automated Inference and Learning in Modelling Financial Volatility, Econometric Theory.
PrasanaChandra (2006) Projects Planing
Analysis Selection
Financing-Implementation-and Review, Tata