A Study On Soil-Structure Interaction Of Free-Standing Pile Group Foundation
Using Finite Element Analysis By Using “Ansys” Software And Results
Comparing With Pile Load Test “Is : 2911”.
R. Anbalagan. D. Durga Naga Laxmi Devi Geotechnical Engineering, Civil, Geotechnical Engineering, Civil,
NMDC LIMITED Hyderabad, INDIA. Assistant professor, SPEC, Hyderabad, INDIA Email : [email protected] Email : [email protected]
Abstract— This paper research explained about “SOIL-STRUCTURE INTERACTION OF FREE-STANDING PILE GROUP
FOUNDATION USING FINITE ELEMENT ANALYSIS BY USING “ANSYS” SOFTWARE. Analysis of free-standing pilegroup
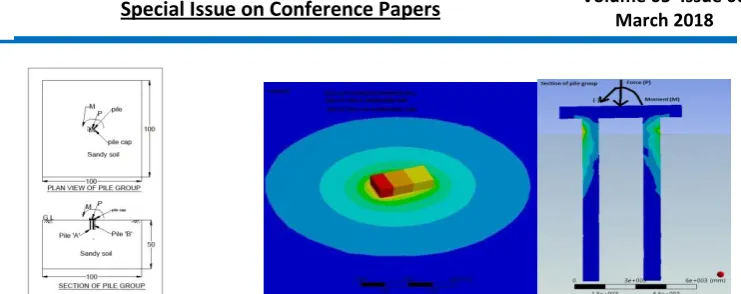
foundation has been carried out by using finite element method to evaluate the deflection & deformations developed under structural load conditions and compare the results with IS: 2911(Part :4) Pile load test. Pile group foundation in sand medium by considering constant pile diameter, having different spacing of pile and having different pile length with different loading combinations. The model consist of sand medium of 100m x100m x 50m is considered and pile group (1x2) in the surrounding soil with end bearing piles are considered. The diameter of RCC pile assumed as (d) 1.0m, Length of pile is ”l/d = 10 & 20”, Spacing of pile is “s/d= 3 & 4” for Model-I & model -II respectively and thin raft assumed as 6m x3m x 0.75m which is placed above 0.5m from natural ground level. Two different models with two different loading condition such as Moment only applied and Force + Moment are applied as added in different cases too.
Keywords— Free standing piles, sand medium, end bearing piles, FEM, ANSYS software.
1. Introduction
Pile Foundation, which is a composite structure consisting pile and raft has been proved to be an appropriate alternative instead of conventional Raft/ Mat foundations. Raft foundation covers the entire area of the structure, transmitting the entire structural load and reduces differential settlements, whereas piles are relatively long & slender members that transmit foundation loads through soil strata of low bearing capacity to deeper soil (By skin friction piles) or resisting in high bearing capacity like rock strata (End bearing piles). Here, analysis of free-standing pile group foundation has been carried out by using finite element software ANSYS. For understanding the behavior of pile group foundation parametric studies has been carried out in sand medium by constant pile diameter, having different spacing of pile and having different pile length with different loading combinations.
Project object is to simulate free-standing pile group foundation in sandy soil using Finite Element Analysis to evaluate the deflection & deformations developed under structural load conditions and compare the results with IS: 2911(Part :4) Pile load test. The results of these studies have led to an improved understanding of the soil-structure interaction problem and providing greater confidence for its use in further Engineering practice. The Concept of free-standing pile group foundation states that a pile group where the pile cap is not in contact with the ground surface like a pile raft foundation and the contact pressure between the pile cap and the soil is neglected if any, which means all loads, are taken by the free-standing piles. (Refer sectional view at Fig.3.1) The earlier years geotechnical
engineers have started to take this pile & pile cap into account in design of pile foundation.
Free-standing pile group foundation is important to understand prior to the analysis. When raft foundations were used the raft-soil interaction is presented. Similarly, the free-standing piles and their interaction with the adjacent soil has been discussed here, i.e. pile-soil interaction and when piles are placed in a group are also discussed. In this dissertation focus is on free-standing pile group foundation in sandy soil. The presentation of free-standing piles are therefore embedded and confined to cohesion less soil. Thus, end bearing piles in sand soil has been envisaged in this study. Pile group foundation consists of free-standing piles (1x2) and thin element of raft which is mounted on top of piles and placed above 500mm from natural ground level. Raft will be used to prevent subsidence. Pile group foundation is challenging design problems, which they are 3D by nature and that soil-structure interaction and to the behavior of deep foundations are noted.
3D finite element models (FEM) are carried out by using programs developed by ANSYS Work bench Release 14.5 for analysis. In this study, two alternative models and four different loading conditions are introduced. Two different models and with two different loading condition such as Moment only and Force + Moment are applied. Three-dimensional plane strain non-linear analysis under vertical load is carried out using finite element modeling in ANSYS software to determine settlement of foundation.
Review of Literature 1.0 Literature related to the project work:
resistance under lateral load using finite element analysis is presented. The parametric study of pile-soil-cap interaction under lateral load is performed on single and different pile groups such as 2x1, 3x1 and 4x1. The analysis of pile groups showed that the pile cap contributes approximately 40 % of lateral resistance for 2x1 pile group, further this value increases around 2% as the number of piles increases in a group. The quantitative analysis presented in this study is very useful in better understanding the behaviours of pile caps under lateral loads. Conclusions have been drawn for in this study are (i) The pile cap has a good contribution against the lateral load. (ii) The different factors like the length of pile, position of pile cap, spacing etc. influence in lateral resistance of pile cap. (iii) In case of single pile, the cap contributes 33.16 % - 35.43 % and 36.02 % - 39.98% lateral resistance for pile length of 10 m and 15 m respectively for different position of pile cap. (iv) Greater the depth of pile cap from the ground level implies greater lateral resistance of the cap. Thus pile cap with single pile contributes around 33% lateral resistance. (v) In case of pile group, the pile cap contributes around 37.5 % - 42.06 %, 39.49 % - 42.90 % and 41.76 % - 44.83 % in case of 2x1, 3x1 and 4x1 pile group respectively; for different spacing and different position of pile cap. (vi) At maximum spacing, cap contributes around 40.11 %, 40.25 % and 43.43% lateral resistance irrespective of position of pile cap. Thus pile cap contributes around 37 % lateral resistance for 2x1 pile group with increment of around 2% for increasing of single number of pile in a group.
2.0 Literature related to the project work :
N. Venkateshwaran et al. (pp.747-752) The foundations for tall buildings are usually subjected to a combination of vertical, lateral and Overturning forces. Piled raft foundation is an economical and efficient foundation for tall buildings in which the load from the superstructure is transferred to the soil by load sharing mechanism between raft and pile and thereby reducing the settlement. In the present study, laboratory model tests and numerical analysis were carried out to study the behavior of piled raft foundation subjected to vertical load. The test was conducted on plain raft and piled raft model with different configurations viz. 1x1, 2x2 and 3x3 in homogeneous loose sand. The experimental results were analyzed and calibrated using PLAXIS 2D. The percentage settlement reduction observed experimentally and numerically were compared and reported. It was observed that the
properly, will not only lead to a safe and efficient structure, but also an overall economy of the project. Conclusions of laboratory study with plain raft and piled raft on loose sand foundation medium was conducted and the following observations were made. (i) The failure load has increased from 234N for plain raft to 390N, 505N and 578N for piled raft of 1x1, 2x2 and 3x3 configurations respectively. This account to about 67%, 116% and 146% increase in the carrying capacity for piled raft of 1x1, 2x2 and 3x3 respectively. (ii) The settlement of plain raft is 7mm and it has reduced to 3.19mm, 2.40mm and 2.02mm when piled raft of 1x1, 2x2 and 3x3 configuration is used. This is about 54%, 66% and 71% for the respective combination. (iii) With the increase in area ratio, the % reduction in settlement initially increase rapidly and thereafter attains a marginal value and also the % increase in load carrying capacity increases rapidly at first and then it maintains a gradual increase. (iv)Analysis using PLAXIS 2D compares well with the experimental values and hence it can be used for studies on piled raft system of other configurations.
Soil boundary conditions & Modelling Nodes constituting bottom of the soil zone is fixed against both vertical and horizontal directions whereas the zone away from pile raft, i.e., the vertical surface of soil at the boundary is restricted against horizontal movements. The horizontal boundary (H) was placed at 5 times the PILE-RAFT cluster diameter (5D) and the vertical boundary (V) is placed at 2.5 times the PILE Length or RAFT cluster diameter (3D). For validation of ANSYS, immediate settlement in medium sand are noted for two different models and the same is compared with the results obtained from ANSYS. Diameter of pile is 1.0 m (d) and thin raft size is 6.0 m x 3.0 m x 0.75m for both Models
Model-1: Pile Length(l) is 10m (l/d=10)
spacing of pile (s) is 3m (i.e s/d=3 for 10m length pile)
Case-I : Loading condition : Moment applied
Case-II : Loading condition : Force + Moment applied
Model-2: Pile Length(l) is 20m (l/d=20)
Spacing of pile (s) is 4m (i.e s/d=4 for 20m length pile)
Case-III : Loading condition : Moment applied
Figure 3.1 Geometry of soil profile & pile group foundation modeling. Figure 3.2 ANSYS Typical plan & section of soil profile & pile group foundation modeling.
The material properties are subsequently assigned to pile & sand medium. These are implemented to model for the interaction between the pile and the surrounding soil. The diameter of pile assumed as (d) 1.0m, Length of pile (l)=10m (l/d = 10), Spacing of pile(s) assumed as 3.0m (s/d=3) and thin raft assumed as 6m x3mx0.75m for model-1.
The soil model is 100*100*50m3, thus the same width as the plane strain model. One work plane was defined at the found level, the work plane has two cluster, where the one in the idle was created to assign the raft and the load. A borehole was defined (the dot in the upper left corner in Figure 3.3) which is 10-meter-deep / 20m deep and with the ground water level situated at top of the ground surface. The boundary at the bottom of the model is totally rigid, and the side-boundaries are
rigid in the two horizontals directions. Three different elements are present in the model, volume element for the soil, floor element for the raft and embedded pile for the pile.
Drucker-Prager model
The Drucker-Prager model (DP-model) is an elastic-plastic model. The general behavior of an elastic perfectly plastic material. The model is isotropic and does not account for soils stress-dependency, i.e. soils tendency to stiffen with increased pressure. ANSYS recommend using this material model in an initial simulation of soil because it is relatively fast and fairly accurate.
Analysis
The calculation was performed as plastic calculation and with standard settings for the iterative procedure. The long time settlements were studied and the undrained behavior was therefore ignored. Just one calculation phase was defined, including activation of all the elements and the load.
Table 3.1 Two different models and four different cases condition.
Pile group Foundation- Model 1 Pile group Foundation- Mode-2
S.No Descripition Case I Case II Case III Case IV
1 Pile diameter in m (d) 1.0 1.0 1.0 1.0
2 Length of Pile in m (l) 10.0 10.0 20.0 20.0
3 Spacing of pile in m (s) 3.0 3.0 4.0 4.0
4 Distance between top of pile & GL (m)
0.5 0.5 0.5 0.5
5 Size of Raft (m3) 6.0x3.0x0.75 6.0x3.0x0.75 6.0x3.0x0.75 6.0x3.0x0.75
6 Moment applied (kNm 14000 10000 34000 25000
7 Max force applied (kN) 0 1800 0 4000
Results of Model 1 & 2 (Case-I ,II, III & IV)
The three dimension model has been performed using ANSYS work bench 14.5 versions thee following output and response of sandy soil and foundations upward (+) & downward (-) deformation, stress and strain of elastic & plastic are noted and tabulated in Table 4.1.
Max Settlement as per IS :2911 :
IS:2911(Part4)–1985 ( Refer : Clause no: 6.1.6.1) Routine test shall be carried out on groups of pile, the maximum settlement not exceeding 25 mm.
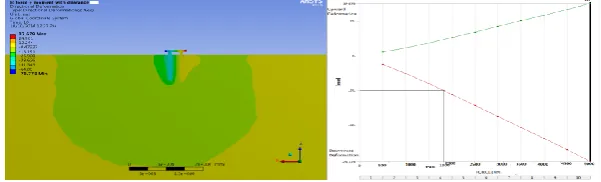
Upward & Downward Deformation Model –1 ,Case- I
Figure 4.1, Case-1, Vertical displacement of both upward & downward . Legend; red = = 56.787 mm & blue = -57.514mm.
Figure 4.2 Case -1, Graph showing the Vertical displacement vs Moment applied. Legend; red = = 56.787 mm & blue = -57.514mm.
In figures 4.1, the vertical displacement on both upward & downward are shown, the downward displacement is 1.28% more with correspondence to upward displacement for pile length of 10m in moment applied condition.
The downward maximum displacement indicated in blue in colour at top of pile raft near pile „A‟ and minimum displacement indicated in green in colour at centre of pile raft. Similarly, The upward maximum displacement indicated in red in colour at top of pile raft near pile „B‟ and minimum displacement indicated in green in colour at centre of pile raft.
In figures the graph showing vertical displacement on both upward & downward, the maximum settlement of pile 25mm is corresponding to moment of 14000 kNm for pile length of 10m in moment applied condition. Model –1, Case II
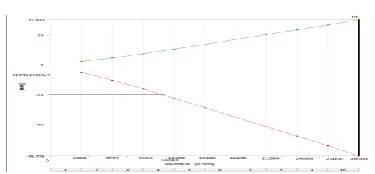
The upward (+) & downward (-) deformed mesh is illustrated in Figure 4.3 and the distribution of vertical displacement graph is illustrated in Figure 4.4, for a section trough the pile group. The maximum settlement of the pile raft is (-) 76.7mm and the minimum is (+) 37.67mm, thus a differential settlement of 39.03mm.
Figure 4.3, Case-II, Vertical displacement of both upward & downward. Legend; red = = 37..67 mm & blue = -76.778 mm.
Figure 4.4. Case-II Graph showing Vertical displacement against Force.
The vertical displacement on both upward & downward are shown, the downward displacement is 103.61% more with correspondence to upward displacement for pile length of 10m in force and moment applied condition.
The downward maximum displacement indicated in blue in colour at top of pile raft near pile „A‟ and minimum displacement indicated in green in colour at centre of pile raft. Similarly, The upward maximum displacement indicated in red in colour at top of pile raft near pile „B‟ and minimum displacement indicated in green in colour at centre of pile raft.
In figures 4.4, the graph showing vertical displacement on both upward & downward, the maximum settlement of pile 25mm is corresponding to force of 1800 kN for pile length of 10m in Force & Moment applied condition
Figure 4.5. Case-II Graph showing Vertical displacement against Moment.
Table 4.2 Comparison of results of two different loading condition case I & II.
3D Response Case -I Case-II Unit Upward deformation (+) 56.7 37.679 mm Downward deformation (-)57.56 (-) 76.778 mm
Diff in deformation 0.8 39.1 mm
Diff deformation 1.76 104 %
Moment Applied (M) 30000 30000 kNm
Force, (P) 0 5000 kN
Model –2 ,Case III
Deformation of upward & downward is illustrated in Figure 4.7 and the distribution of vertical displacement graph is illustrated in Figure 4.8, for a section view of the pile group. The maximum settlement of the pile raft is (-) 46.755mm and the minimum is (+) 46.733mm, thus a differential settlement of 0.022mm towards Z axis.
Figure 4.7, Case-III, Vertical displacement of both upward & downward. Legend; red = = 46.273mm & blue = -46.755mm.
Figure 4.8. Case -III, Graph showing the Moment vs deflection angle.
In figures 4.7, the vertical displacement on both upward & downward are shown, the downward displacement is 1.41% more with correspondence to upward displacement for pile length of 20m in force applied condition.
The downward maximum displacement indicated in blue in colour at top of pile raft near pile „A‟ and minimum displacement indicated in green in colour at centre of pile raft. Similarly, The upward maximum displacement indicated in red in colour at top of pile raft near pile „B‟ and minimum displacement indicated in green in colour at centre of pile raft.
Figure 4.9. Case -III, Graph showing the Moment vs deformation for both up & downward. Legend; red = = 46.273 mm & blue = -46.755mm.
In figures 4.9, the graph showing vertical displacement on both upward & downward, the maximum settlement of pile 25mm is corresponding to moment of 34000 kNm for pile length of 20m in moment applied condition.
Figure 4.10. Case-IV, Vertical displacement distribution both upward & downward. Legend; red = 21.245 mm & blue = -61.46
Figure 4.11. Case-IV Graph showing the Force vs displacement for both upward & downward 5 mm.
In figures 4.10, the vertical displacement on both upward & downward are shown, the downward displacement is 189% more with correspondence to upward displacement for pile length of 20m in force & Moment applied condition.
The downward maximum displacement indicated in blue in colour at top of pile raft near pile „A‟ and minimum displacement indicated in green in colour at centre of pile raft. Similarly, The upward maximum displacement indicated in red in colour at top of pile raft near pile „B‟ and minimum displacement indicated in
green in colour at centre of pile raft.
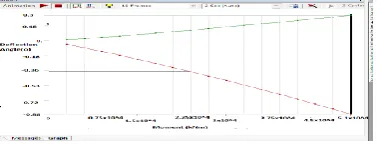
In figures 4.11, the graph showing displacement for both upward & downward, the maximum settlement of pile 25mm is corresponding to Force of 4000 kN for pile length of 20m in force & Moment applied condition.
In figures 4.12, the graph showing deflection angle for both upward & downward, the maximum settlement of pile 25mm (0.36 degree) is corresponding to moment of 32500 kNM for pile length of 20m in force & Moment applied condition.
Figure 4.12. Case-IV Graph showing Moment vs Deflection angle for both upward & downward. Legend; red = = 21.245 mm & blue = -61.465mm.
Comparison of upward & downward deformation for four different loading condition and its soil response has been tabluated in Table figure 4.3. Comparison of results of two different loading condition case III & IV.
3D Response Case -III Case-IV Unit Upward deformation (+) 56.7 21.245 mm
Downward deformation (-) 57.56 61.465 mm
Diff in deformation 0.8 40.22 mm
Diff deformation in % 1.41% 189 %
Moment Applied (M) 34000 25000 kNm
Force, (P) 0 4000 kN
TOTAL DEFORMATION Model –1 , Case I
The total deformed of model–1, Case – I is illustrated in Figure 4.14 and the distribution of vertical displacement graph
Figure 4.14. Case-I, Overall settlement of pile group. Legend; red = = 76.0 mm & blue = 0 mm
Figure 4.15. Case-I, total deformation vs moment applied
The maximum displacement indicated in red in colour at top edge of pile raft near both pile „A‟ & „B‟ and minimum displacement indicated in blue in colour at surface of pile.
Model –1, Case II
The total deformed of model–1, Case –II is illustrated in Figure 4.16 and the distribution of vertical displacement graph is illustrated in Figure 4.17 for a section trough the pile group. The overall deformation of the pile is (-) 91.5mm.
Figure 4.16. Case-II, Overall settlement of pile group. Legend; red = = 91.5 mm & blue = 0 mm Figure 4.17. Case-I, total deformation vs Force applied
The maximum displacement indicated in red in colour at top edge of pile raft near pile „A‟ and minimum displacement indicated in blue in colour at surface of pile and pile „B‟.
Model –2, Case III
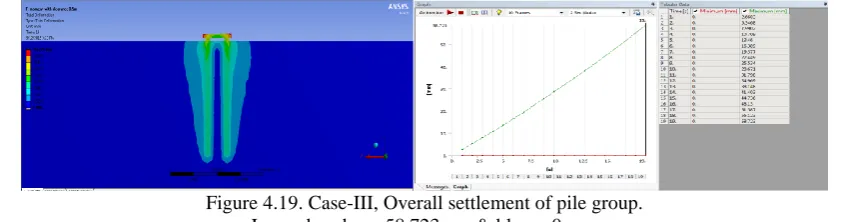
The total deformed of model –2, Case –III is illustrated and the distribution of vertical displacement graph is illustrated in Figure 4.19 for a section trough the pile group. The overall deformation of the pile is (-) 58.723mm.
Figure 4.19. Case-III, Overall settlement of pile group. Legend; red = = 58.723mm & blue = 0 mm
The maximum displacement indicated in red in colour at top edge of pile raft near both pile „A‟ & „B‟ and minimum displacement indicated in blue in colour at surface of pile.
Model –2 ,Case IV
The total deformed of model –2, Case –IV is illustrated and the distribution of vertical displacement graph is illustrated in Figure 4.20 for a section trough the pile group. The overall deformation of the pile is (-) 69.321mm.
1. When Moment only applied in Case I, the effect of vertical downward deformation of pile “A” (-57.5mm) has undergone lower displacement when compared to pile “B” vertical downward deformation (-56.7mm) and similarly in Case III also (Pile A is 57.56mm & Pile B is 56.70mm).
2. Axial Force applied along with Moment in Case II, the effect of vertical downward deformation of Pile “A” is 76.778mm (say 100%) and compared with Pile “B” the upward deformation is reduced to 50% i.e 37.6mm and similarly in Case IV also (Pile A is 61.465mm(100%) & Pile B is 35% i.e 21.245mm). 3. The overall deformation in Case I & II are 114.20 &
114.378mm respectively which is having L=10.0m & S=3.0m but Case III & IV deformation are 114.26mm & 82.71mm respectively which is having L=20.0m & S=4.0m. Therefore, length increase deformation is reducing in pile group foundation.
REFERENCES
1. U.K.Nath, P.J.Hazarika, V.Giri, A.M.Tesfaye (2011) “Study of lateral Resistance of Pile cap using Finite Element Analysis” International journal of emerging trends in Engineering and Development, Issue1, Vol -1, pp. 15- 31.
2. W.D.Guo & E.H.Ghee (2010) “Model test on Free-standing passive pile groups in Sand” Janvary 2010, Conference paper on Physical Modelling in Geotechnics –Springman, Laue & Seward (eds), Taylor & Francis Group, London, pp. 873-878.
3. Mohammed Fattah (2013) “Bearing Capacity of Pile Group and Piled Raft Foundations on Sandy”Journal of Engineering and Development, Vol. 17, No.2, 2013, ISSN 1813- 7822 by IRAQ, pp. 64-96.
4. Jian Zhang, Yuchuan Tang (2007) University of California, Los Angeles “Finite Element Modeling of Shallow Foundations on Nonlinear Soil Medium” Publication on Earthquake Engineering, UCLA Civil and Environmental Engineering, UC Los Angeles.
5. Sanjeev Kumarh and Michael L. Hall (2004) “An approximate method to determine lateral force on piles or piers installed to support a structure through sliding soil mass” Journal.
6. Sanjeev Kumarh, Latika Lalvani & Mather Omar (2004) “Non-linear response of single piles in sand subjected to lateral loads using khmax Approach”. 7. H.S. Chore, R.K. Ingleand V.A. Sawant (2012)
“Non-linear analysis of pile groups subjected to lateral loads using „p-y‟ curve” Interaction and Multiscale Mechanics” Vol.5, No.1, pp.57-73.
8. E.Y. N Oh & D. G. Lin (2006) Griffith University, Queensland, Australia “Numerical Analysis of Piled Raft Foundation in Sandy and Clayey Soils” Paper presentation on 2D & 3D analysis.