IJEDR1604137
International Journal of Engineering Development and Research (www.ijedr.org)901
An Enhanced K-Means Clustering Algorithm to
Remove Empty Clusters
1Anshul Yadav, 2Sakshi Dhingra
1Student of Master in Technology, 2Assistant Professor
Department of Computer Science & Application, Chaudhary Devi Lal University, Sirsa
________________________________________________________________________________________________________
Abstract - Today in the modern era, everyone has to retrieve a large amount of data from a vast collection of data. This
process of retrieving useful data in the understandable form is data mining. Clustering is an important data analytic technique which has a significant role in data mining application. Clustering is the method of arranging a set of similar objects into a group. Partition based clustering is an important clustering technique. This technique is centroid based technique in which data points splits into k partition and each partition represents a cluster. A widely used partition based clustering algorithm is k- means clustering algorithm. But this algorithm also has some limitations. These limitations can be reduced by some improvements in existing algorithm. One of the limitations and its development discussed in this paper.
Keywords - Data Mining, Clustering, K-Means.
________________________________________________________________________________________________________
I.INTRODUCTION
Data mining is an interdisciplinary subfield of computer science. It is the use of automatic data analysis techniques to uncover previously undetected relationship among data items [1]. It allows users to analyze data from various angles and dimensions, classified it and precise the relation recognized [2]. Data mining can be done by passing through different phases and using supervised and unsupervised learning. There are a different type of techniques in data mining process i.e. classification, clustering and regression. Miscellaneous field uses data mining technology because of fast access of data and valuable information from the vast amount of data. Data mining technologies have been applied successfully in many areas like marketing, telecommunication, fraud detection, financial data analysis, medical and many other scientific applications [5].
Clustering is the essential aspect of data mining. It is the technique of grouping of data in different groups by of their similarity measures. It means data items in the same group that are called cluster are more similar to each other than to those in other groups. Clustering is an unsupervised learning. A good clustering method will produce high superiority cluster with high intraclass similarity and low interclass similarity [4]. It is a common technique for statistical data analysis used in many fields of machine learning, image analysis, pattern recognition, bioinformatics and image retrieval [1].
II.LITERATURE REVIEW
Clustering techniques mainly used two algorithms: Hierarchical algorithm and Partition algorithm. In the hierarchical algorithm, the dataset is divided into smaller subset in a hierarchical manner whereas in partition algorithm dataset is partitioned into the desired number of sets in a single step. K-means clustering is most popular partition algorithm [2]. It uses in many application for producing the accurate result because of its simplicity of implementation.
Rishikesh et al. [7] present a review on some variations of k-means algorithms. These algorithms remove some common problems of the basic k-means algorithm like a number of iteration in the algorithm, selection of initial cluster center, defining the number of cluster and clustering large data set. All these problems and algorithms to find the solution of these challenges discussed in this review paper.
M. K. Pakhira et al. [8] present a modified k-means algorithm in this research paper. This m_k-means algorithm provides a concept to modify the center vector updating procedure of the basic k-means. The only difference between basic k-means and m_k-means is at the center computation step. This paper present the performance comparison of both algorithms by the rate of convergence and quality of the solution.
K. A. Abdul Nazeer et al. [9] present an improved k-means algorithm which provides a systematic method for finding initial centroid and for assigning data points to the cluster. But this method also has a common problem of k-means that is the value of a number of clusters is still required to give as input.
Y. S. Thakre et al. [10] discussed the evaluation of performance of the k-means algorithm with multiple databases and with various distance metrics. In this paper, k-means algorithm evaluated for a different number of clusters for recognition rate. This paper works help to choose suitable distance metric for a particular application.
Nimrat Kaur et al. [11] proposed an algorithm using matrix method for assigning the data points to the cluster. This method requires less number of iterations to get good quality clusters.
K-means Algorithm
IJEDR1604137
International Journal of Engineering Development and Research (www.ijedr.org)902
each cluster is selected for clustering and then according to chosen centroid, data points having a minimum distance from given cluster, is assigned to that particular cluster. Euclidean Distance is used for calculating the distance of data point from the particular centroid.Old k-means algorithm consists of following steps:
1. Initialization: In this first step data set, the number of clusters and centroid that we defined for each cluster.
2. Classification: The distance is calculated for each data point from centroid and data point having the minimum distance from the centroid of a cluster is assigned to that particular cluster.
3. Centroid Recalculation: Clusters generated previously, centroid is again repeatedly calculated means recalculation of the centroid.
4. Convergence Condition: Some convergence conditions are given as below: 4.1 Stopping when reaching a given or
defined the number of iterations. 4.2 Stopping when there is no exchange of data points between clusters.
4.3 Stopping when a threshold value is achieved.
5. If all of above conditions are not satisfied, then go to step 2 and the whole process repeat again, until given conditions are not satisfied.
Suppose that a dataset of n data points 𝑥1, 𝑥2, …, 𝑥𝑛such that each data point is within d, problem of finding minimum variance clustering of dataset into k clusters is that of finding k points {𝑚𝑗} (j=1, 2, …, k) within d such that
1
𝑛∑ [min 𝑑
2(𝑥 𝑖,𝑚𝑗) 𝑛
𝑖=1 ] ………. (1)
is minimized, where d(𝑥𝑖, 𝑚𝑗) denotes the Euclidean distance between 𝑥𝑖 and 𝑚𝑗. The points {𝑚𝑗} (j=1, 2,…, k) are known as cluster centroids. The problem within equation (1) is to find k cluster centroids, such that average squared Euclidean distance (mean squared error, MSE) between a data point and its nearest cluster centroid is minimized. The k-means algorithm provides an easy method to implement an approximate solution to equation (1). The reasons for the popularity of k-means are ease & simplicity of implementation, scalability, speed of convergence and adaptability to sparse data. The k-means algorithm could be thought of as a gradient descent procedure, which begins at starting cluster centroids, and iteratively updates these centroids to decrease objective function within equation (1).
The k-means always converge to a local minimum. The particular local minimum found depends on starting cluster centroids. The problem of finding global minimum is NP-complete. The k-means algorithm updates cluster centroids till local minimum is found. Before k-means algorithm converges, distance and centroid calculations are done while loops are executed a number of times, say l, where positive integer l is known as the number of k-means iterations. The precise value of l varies depending on initial starting cluster centroids even on the same dataset. So computational time complexity of algorithm is O(nkl), where n is a total number of objects within the dataset, k is required number of clusters we identified and l is the number of iterations, k≤n, l≤n.
Old K-means algorithm
MSE=large number;
Select initial cluster centroids {𝑚𝑗}j k=1;
Do
Old MSE=MSE; MSE1=0; For j=1 to k
𝑚𝑗=0; 𝑛𝑗=0;
end for For i=1 to n For j=1 to k
Compute squared Euclidean distance 𝑑2 (𝑥 𝑖, 𝑚𝑗); end for
Find closest centroid 𝑚𝑗 to 𝑥𝑖, ;
𝑚𝑗=𝑚𝑗+𝑥𝑖; 𝑛𝑗=𝑛𝑗+1; MSE1=MSE1+𝑑2 (𝑥
𝑖, 𝑚𝑗); end for
For j=1 to k
𝑛𝑗=max (𝑛𝑗, 1); 𝑚𝑗=𝑚𝑗/𝑛𝑗; end for
MSE=MSE1;
IJEDR1604137
International Journal of Engineering Development and Research (www.ijedr.org)903
Advantages [2] of K-means clustering are that it is very simple, fast and robust. It is easily understandable. If the data set is well separated from each other, then it gives best results. The clusters do not have overlapping character. These are also non-hierarchical within nature. But some limitations are also there in old k-means algorithm. One significant limitations of this algorithm are the presence of empty clusters. When k-means clustering is applied on a dataset some empty clusters are also generated which do not have any data item. But still these empty clusters occupies some memory which is of no use.Enhanced k-means algorithm: The proposed work is to eliminate limitations of the K-mean clustering algorithm. Working of enhanced k-means clustering is same as old k-means algorithm. Advancement in enhanced algorithm is that when given convergence conditions are satisfied then previously generated clusters are rechecked. Clusters where no data points are allocated to a cluster under consideration during assignment phase are eliminated.
1. Initialization: In this first step data set, the number of clusters and centroid that we defined for each cluster.
2. Classification: The distance is calculated for each data point from centroid and data point having minimum distance from centroid of a cluster is assigned to that particular cluster.
3. Centroid Recalculation: Clusters generated previously, centroid is again repeatedly calculated means recalculation of centroid. 4. Convergence Condition: Some convergence conditions given as below:
4.1 Stopping when reaching a given or defined the number of iterations. 4.2 Stopping when there is no exchange of data points between clusters.
4.3 Stopping when a threshold value is achieved.
5. If all of above conditions are not satisfied, then go to step 2 and whole process repeat again, until given conditions are not satisfied.
6. Elimination of Empty Cluster: Clusters generated previously are rechecked. Clusters where no data points are allocated to a cluster under consideration during assignment phase are eliminated.
Figure1: Enhanced k-means algorithm
Enhanced k-means algorithm
MSE=large number;
Select initial cluster centroids {𝑚𝑗}j k=1;
Do
Old MSE=MSE; MSE1=0; For j=1 to k
𝑚𝑗=0; 𝑛𝑗=0;
end for For i=1 to n For j=1 to k
Compute squared Euclidean distance 𝑑2 (𝑥
𝑖, 𝑚𝑗); end for
Find closest centroid 𝑚𝑗to 𝑥𝑖;
IJEDR1604137
International Journal of Engineering Development and Research (www.ijedr.org)904
MSE1=MSE1+ (𝑥𝑖, 𝑚𝑗);end for For j=1 to k
𝑛𝑗=max (𝑛𝑗, 1); 𝑚𝑗=𝑚𝑗/𝑛𝑗; end for
MSE=MSE1;
while (MSE<Old MSE) For j=1 to k
If (sizeof(𝑚𝑗==0)) {
remove 𝑚𝑗 }
end for
This concept is described by the following example: 2 5 6 8 12 15 18 28 30 Suppose K=3
C1=2, C2=12, C3=30
2 5 6 8 12 15 18 28 30
C1 C2 C3
The distance is calculated for each data point from centroid and data point having minimum distance from centroid of a cluster is assigned to that particular cluster.
So cluster according to distance are as follow 12-5>5-2
So cluster for data point 5 is C1 6-2>12-6
So cluster for data point 6 is C1 In same way, cluster would be assigned
2 5 6 8 12 15 18 28 30
C1 C1 C1 C2 C2 C2 C2 C3 C3 Data member of C1 are 2, 5, 6
Data Member for C2 are 8,12,15,18 Data Member for C3 are 28, 30
Clusters generated previously, centroid is again repeatedly calculated means recalculation of the centroid. So mean of cluster C1 is (2+5+6)/3=4.3
Mean of cluster C2 is (8+12+15+18)/4=13.25 Mean of cluster C3 is (28+30)/2=29
Now distance would be recalculated with new mean and cluster of data point would be changed according to new distance
2 5 6 8 12 15 18 28 30
C1 C1 C1 C2 C2 C2 C2 C3 C3
For example take 8 from C2 cluster. Now recalculate the distance 8-4.3=3.7
13.25-8=5.25
So now the distance of 8 from C1 is less than C2 so now 8 would be the member of C1.
III.RESULTS
Data Set Used: Two data sets from real projects are used.
The first data set used is of the sugar mill project. Data is taken from storage database of sugar mill. This storage database has data about items used in sugar mill that is item_id, item head, item type, quantity, item unit. Opening quantity of data items used in sugar mill is taken from this database.
The second data set is an another real project data base. It is the data set of an MLM company. This dataset contains serial_number, customer_name, left status, customer_id, sponser_id etc. Serial_number and left status of customers is taken from this data set.
IJEDR1604137
International Journal of Engineering Development and Research (www.ijedr.org)905
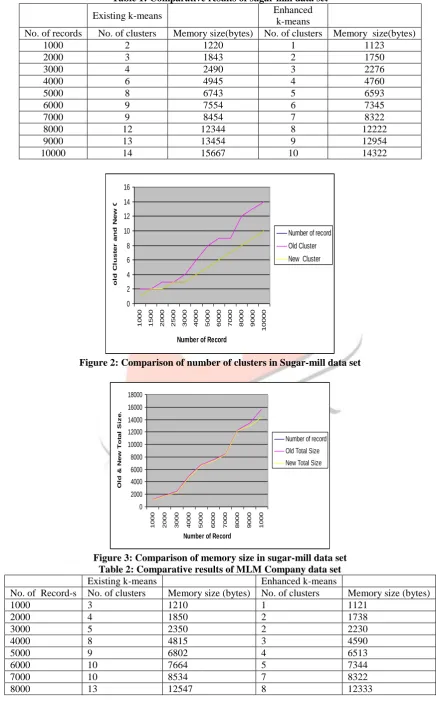
Figure2 and Figure4 are the graphical represen-tation of comparison of number of clusters and Figure3 and Figure5 represent the comparison in size of clusters.Table 1: Comparative results of sugar mill data set
Existing k-means Enhanced
k-means
No. of records No. of clusters Memory size(bytes) No. of clusters Memory size(bytes)
1000 2 1220 1 1123
2000 3 1843 2 1750
3000 4 2490 3 2276
4000 6 4945 4 4760
5000 8 6743 5 6593
6000 9 7554 6 7345
7000 9 8454 7 8322
8000 12 12344 8 12222
9000 13 13454 9 12954
10000 14 15667 10 14322
Figure 2: Comparison of number of clusters in Sugar-mill data set
Figure 3: Comparison of memory size in sugar-mill data set Table 2: Comparative results of MLM Company data set
Existing k-means Enhanced k-means
No. of Record-s No. of clusters Memory size (bytes) No. of clusters Memory size (bytes)
1000 3 1210 1 1121
2000 4 1850 2 1738
3000 5 2350 2 2230
4000 8 4815 3 4590
5000 9 6802 4 6513
6000 10 7664 5 7344
7000 10 8534 7 8322
8000 13 12547 8 12333
0 2 4 6 8 10 12 14 16
1000 1500 2000 2500 3000 4000 5000 6000 7000 8000 9000
10000
Number of Record
ol d C lus te r a nd N e w C lus te r
Number of record
Old Cluster
New Cluster
0 2000 4000 6000 8000 10000 12000 14000 16000 18000
1000 2000 3000 4000 5000 6000 7000 8000 9000 1000
Number of Record
O ld & N e w To ta l S iz e .. .. .. .. ..
Number of record
Old Total Size
IJEDR1604137
International Journal of Engineering Development and Research (www.ijedr.org)906
9000 15 13555 10 12666
10000 16 15887 11 14511
Figure 4: Comparison of number of clusters in MLM company dataset
Figure 5: Comparison of memory size in MLM Company dataset
IV.CONCLUSIONS
Clustering is the process of grouping objects that belongs to the same class. Similar objects are grouped in one cluster and dissimilar objects are grouped in another cluster. One major problem with K-means clustering is that empty clusters are generated during execution, if within case no data points are allocated to a cluster under consideration during assignment phase. In this paper, two databases are considered from real life projects, one is from sugar mill and another is from MLM company. Both algorithms are applied on both databases. The number of clusters generated in case of old k-means is more because in this case empty clusters are generated. In the case of enhanced k-means number of clusters are less than the previous case because empty clusters are removed here. The comparative result shows that when number of records are 10000 then number of clusters generated in case of old k-means are 16 and in case of enhanced k-means number of clusters are 11. This difference of 5 clusters illustrates that there are five empty clusters generated in old k-means which are removed in enhanced k-means algorithm and memory size also decrease in this case. So, results show that as the number of records increase, number of empty clusters also increases in old k-means algorithm. When enhanced k-means algorithm is applied, number of clusters get reduced because empty clusters have been removed in this case. This algorithm also save the clustered data as text files on the disc, this provides the persistence to the clustered data so that it could be used in future without re-clustering.
V.REFERENCES
[1] Sharmila, R.C Mishra, “Performance Evaluation of Clustering Algorithms”, International Journal of Engineering Trends and Technology, 2013
[2] Pranjal Dubey, Anand Rajavat, “Implementation Aspect of K-Means Algorithm For Improving Performance”, Proceedings of 28th IRF International Conference, Pune, India, 7th June 2015
[3] Kehar Singh , Dimple Malik, Naveen Sharma, “Evolving Limitations in k-means Algorithm in Data Mining and their Removal”, International Journal of Computational Engineering & Management, April 2011
[4] Amandeep Kaur Mann, Navneet Kaur, “Review Paper on Clustering Techniques”, Global Journal Of Computer Science and Technology Software & Data Engineering, 2013
[5] S. D. Gheware , A. S. Kejkar, S. M. Tondare, “Data Mining: Task, Tools, Techniques and Applications”, International Journal of Advanced Research in Computer and communication Engineering, Oct 2014
[6] Anshul Yadav, Sakshi Dhingra, “A Review on K-Means Clustering Technique”, International Journal of Latest Research And Trends in Technology, July-Aug 2016
[7] Rishikesh Suryawanshi, Shubha Puthran, “Review of Various Enhancement for Clustering Algorithm in Big Data Mining”, International Journal of Advanced Research in Computer Science and Software Engineering, 2015
Comparative Analysis
0 5 10 15 20 25 30
1000 2000 3000 4000 5000 6000 7000 8000 9000 1000 0
No of record
N
o
of
c
lus
te
r
New Cluster
Old Cluster
0 2000 4000 6000 8000 10000 12000 14000 16000 18000
N umbe
r of r ecor
d
100020003000400050006000700080009000
Old Total Size
IJEDR1604137
International Journal of Engineering Development and Research (www.ijedr.org)907
[8] Malay K. Pakhira, “A Modified k-means Algorithm to Avoid Empty Clusters”, International Journal of Recent Trends inEngineering, May 2009
[9] K. A. Abdul Nazeer, M. P. Sebastian, “Improving the Accuracy and Efficiency of K-means Clustering Algorithm”, Proceedings of the World Congress on Engineering, July 2009
[10] Y. S. Thakre, S. B. Bagal, “Performance Evaluation of K-means Clustering Algorithm with Various Distance Metrics”, International Journal of Computer Application, Jan 2015
[11] Nimrat Kaur Sidhu, Ranjeet Kaur, “Redefining and Enhancing K-means Algorithm”, International Journal of Innovative Research in Computer and Communication Engineering, May 2013
[12] Michael Hahsler, "Introduction to rules – A computational environment for mining association rules and frequent item sets" Journal of Statistical Software, 2005
[13] Michael Hahsler, “A Probabilistic Comparison of Commonly Used Interest Measures for Association Rules”, 2015
[14] Hipp, J., Güntzer, U., Nakhaeizadeh, G., "Algorithms for association rule mining --- a general survey& comparison". ACM SIGKDD Explorations Newsletter, 2000
[15] Pei, Jian, Han, Jiawei, Lakshmanan, Laks V. S., “Mining frequent item sets with convertible constraints”, in Proceedings of17th International Conference on Data Engineering, April 2–6, 2001
[16] Agrawal, Rakesh, Srikant, Ramakrishnan, “Fast algorithms for mining association rules in large databases”, in Bocca, Jorge B., Jarke, Matthias, Zaniolo, Carlo; editors, Proceedings of 20th International Conference on Very Large Data Bases (VLDB), Santiago, Chile, September 1994, pages 487-499
[17] Shafeeq Ahamed, K. S. Hareesha, “Dynamic Clustering of Data with Modified K-Means Algorithm”, International Conference on Information and Computer Networks, 2012