170
Analysis of Traffic Condition on Ring Road in Nagpur
City
Mr. Amol R.Rode
1, Ms. Swati R.Shewale
2Asst Prof Civil Deptt, JCOET, Yavatmal1, Asst prof, civil deptt, VNIET, Nagpur2 Email:[email protected]1, [email protected]2
Abstract- Traffic signal operations are often the determining factor in the functioning of urban street systems.
Efficient signal control policies help in improving the mobility and in reducing the congestion in an urban area. They allow effective utilization of existing, which is particularly relevant in today’s funding climate. Proper design and evaluation procedures are essential in optimizing the performance of urban arterial streets. Various parameters such as peak hour traffic volume, traffic composition, average speed of vehicles, signal timings, coordination or lack of it, accident data, delays, emissions from the vehicle etc., will be considered. Based on the data collected a model will be created in simulation software for existing condition analysis. Also compare the control delay calculated by TSIS Software, & HCS software 2000 and HCM 2000. New traffic control strategies will be developed by using optimization technique and their effectiveness will be tested with a simulation model, preferred control strategy. Noise level data at each intersection during morning and evening peak hour are also analyzed on subsequently L10, L50, L90 and Leq. Noise descriptors were identified and remedial are also suggested to control the noise level. The present research primarily aims at evaluating various characteristics of traffic flow and noise pollution of Nagpur city by conducting experimentations at wider range of values for important parameters. This paper deals with experimental study of detailed traffic analysis of ring road of Nagpur city and formulating the strategies for effective traffic operation of the street.
Index Terms- Data Collection, Software’s (Traffic Software Integrated System, Highway Capacity Software
2000) and Manual (Highway Capacity Manual 2000).
1. INTRODUCTION
Traffic signal operations are often the determining factor in the functioning of urban street systems. Efficient signal control policies help in improving the mobility and in reducing the congestion in an urban area. They allow effective utilization of existing, which is particularly relevant in today’s funding climate. Proper design and evaluation procedures are essential in optimizing the performance of urban arterial streets. Nagpur is now the third largest city in Maharashtra faces traffic congestion particularly in the different road intersection due to rapid and uncontrolled development by an unacceptable level of disparity in transportation demand and supply scenario
resulting in environmental degradation as well as delay and fuel loss. When the vehicles are waiting for
171 of Effectiveness for signalized intersections. The LOS
for urban streets is based on the average travel speed on the arterial and the urban street classification. The average travel speed is computed from the length of the segments and the running times, which includes control delay of through movements at signalized intersections. The estimation of delay at signalized intersection becomes an important factor for accurate performance analysis. Benekohal, Elzohairy and Saak [6] discuss that the delays for optimized conditions for PASSER II and PASSER IV were not significantly different than the delay before optimization. For Synchro, the delays for optimized conditions were significantly lower than the delays before optimization. Gartner and Stamatiadis [3] describe procedures that dramatically improve the computability of such models and bring them into the realm of real-time application. Schmidt C.W. [7] discuss thatthe general noise level increases in towns and cities increases, mainly due to traffic. If a job entails concentration, the effect of noise on the worker will make the work much more tiring than if the job demands little though concentration. The effect of noise on the health of individuals, especially over a period of years, is an area of research that needs to be explored. Chepesiuk et.al. [1] discussed the noise comes from many sources; the most significant source is from transportation, particularly traffic noise. Highway noise emanates from three sources. (a) the engine, (b) the exhaust, and (c) the friction vehicle of the tyres on the road. Once typical highway speed are reached, the predominant noise forms due to interaction between tyre and road of light trucks and cars and on other hand heavy trucks produce a high volume of noise from all three sources even at low speeds . Gartner and Deshpande [4] developed an application of harmonic analysis for traffic signal performance evaluation and optimization. Link Performance Functions in synchronized signal networks measure delay or travel time as a function of
offsets.Deshpande, N. H. Gartner and M. L. Zarrillo [2] discuss the highway capacity as a scarce resource which needs to be allocated economically. Traffic control at signalized intersections involves balancing competing demands of different traffic streams for limited capacity at the intersection. Similarly, progression schemes on two-way arterial streets involve a compromise between the demands of opposing and competing traffic streams along the arterial. In these and similar cases there is a tradeoff between the performance potential that each traffic stream can attain and there is a need for determining the most effective signal controls under given circumstances. Deshpande et al [5] discuss several approaches for urban street performance estimation and effects of progression schemes on the arterial. They utilize the previously developed Cyclic Coordination Function to quantify the quality of progression in conjunction with the HCM procedure and to analyze the LOS on an urban street. Both one-way and two-way scenarios are considered. Additionally, the Progression Potential Frontier concept is used to quantify tradeoffs in performance of an arterial street considering one-way and two-way progressions. This paper deals with experimental study of detailed traffic analysis of ring road of Nagpur city and formulating the strategies for effective traffic operation of the street.
2. METHODLOGY
172 peak hour are also analyzed on subsequently L10, L50,
L90 and Leq. Noise descriptors were identified and remedial are also suggested to control the noise level. The data program was designed to collect following parameters in
(1) Classified traffic volume
(2) Noise level data from each intersection
2.1 Identification of location
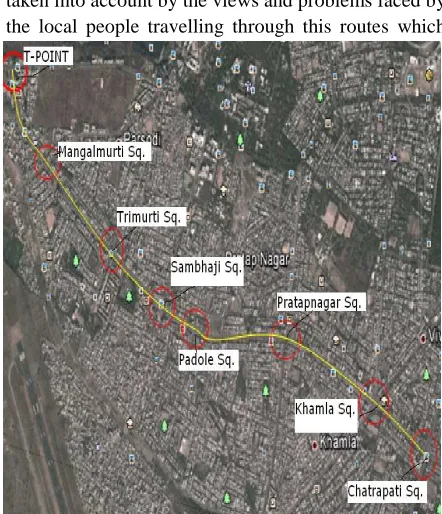
The arterial streets are design for the heavy traffic which is consisting of number of intersections. One of the most useful arterial streets in Nagpur city is Chatrapati sq. to Hingna T-Point Ring Road (Fig.1). The location are identified on the basis of traffic flow taken into account by the views and problems faced by the local people travelling through this routes which
[image:3.595.69.290.292.549.2]faces heavy traffic congestion at morning and evening peak period due to heavy traffic, which leads to accidents and environmental imbalance.
Fig. 1 Layout plan for traffic study
2.1 Traffic volume study
In India, manual method is used to determine traffic volume from the intersection also from routes. Sometime traffic is very high at that time it is not possible to count traffic volume more accurately by manually, for that time lapse photographic technique is employed. To estimate the traffic volume, the
vehicles have been classified in Two Wheeler (Bicycles, Motorcycle) and Four Wheeler ( Car, Trucks, Buses).To determine the volume density of the traffic counting is done in morning and evening of peak hour and in regular interval.
2.2 Noise Level Study
173 also available in certain models of sound level meters.
This is the desired parameter for assessment of
ambient noise levels (Fig.2). For the present study Noise level meter model 210: type 2 is used.
Fig.2 Noise level meter
3. EXPERIMENTAL WORK AND PROCEDURE
The arterial streets are design for the heavy traffic which is consisting of number of intersections. One of the most useful arterial streets in Nagpur city is Chatrapati square to Hingna T-Point Ring Road (Fig.1).The location are identified on the basis of traffic flow taken into account by the views and problems faced by the local people travelling through this routes which faces heavy traffic congestion at morning and evening peak period due to heavy traffic, which leads to accidents and environmental imbalance. This study consist of the data collection from given street which includes signal timing (North bound, South bound, East bound, West bound), Traffic volume data and Noise Level data from each intersections at morning and evening peak period and also by using collected data analyzed given road. In India, manual method is used to determine traffic volume from the intersection also from routes. Sometime traffic is very high at that time it is not
possible to count traffic volume more accurately by manually, for that time lapse photographic technique is employed. In the present study, the manual method is used to collect the traffic volume data. Based on the collected data a model is created in simulation software (Traffic Software Integrated System or TSIS) for existing condition analysis, from TSIS model, output is obtained which consist of Delay, Control Delay, Fuel Consumptions, and by using Highway Capacity Software (HCS 2000) & Highway Capacity Manual (HCM 2000) Control delay is calculated. Manual Control delay is calculated by using Eq-1. Noise levels are taken under metrological condition using a sound level meter (Fig.2) at a distance of 1.0 meter from the pavement edge road side, all the noise levels are recorded at morning and evening peak hour and with the collected noise level data constant pressure levels (Leq) are calculated for each intersection by using Eq-2.
3 2 1
(
PF
)
d
d
d
d
=
+
+
--- (1)
(
)
60
2 90 10 50L
L
L
Leq
=
+
−
--- (2)Analysis of data
Traffic Software Integrated System (TSIS
)
TSIS is an integrated development environment that enables users to conduct traffic operations analysis. Although TSIS has been available since the early 1990s, it was not until 1995 that it became a Windows-based product. With the introduction of TSIS 5.0, the environment has become more integrated and supports an open component architecture that allows you to add and configure your own (or third-party) tools. TSIS 5.1 continues to use that open architecture.
Highway Capacity Software (HCS2000)
174 Intersections, Unsignalized Intersections, Urban
Streets (Arterials), Freeways, Weaving Areas, Ramp Junctions, Multilane Highways, Two-Lane Highways and Transit. HCS2000 is a state-of-the-art Windows application with a comprehensive Help system and the highest level of professional technical support.
Highway Capacity Manual (HCM 2000)
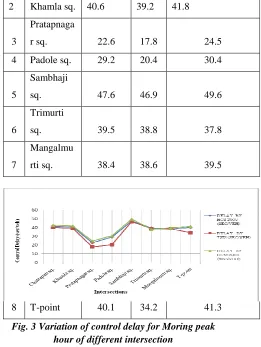
HCM 2000 analyzes the control delay in urban streets and it also may be used to analyze suburban streets that have a traffic signal spacing of 3.0 km or less. Both one-way and two-way streets can be analyzed; however, each travel direction of the two-way street requires a separate analysis. The traffic surveys generated data on traffic volume and also the delays experienced by vehicles entering the intersection from each arm. The total traffic volumes at the intersections are presented in Table.1. The control delays are obtained from the traffic volume data & signal timing obtained from each signalized intersection. For the analysis of data three methods i.e. traffic software integrated system (TSIS) , Highway Capacity Software (HCS) 2000 and manual of Highway Capacity Manual 2000 to calculate control delay for morning peak hour (Table.1and Fig.3) and evening peak hours ( Table.2 & Fig.4) and fuel consumptions. After comparing all the results obtained from the three methods, the TSIS software gives better results than other two methods.
Table- 1 Variation of control delay for morning peak
hour of different intersection (9.00am-10.00am)
Sr . N o.
Intersectio ns
Delay by HCM 2000 (Sec/Veh )
Delay by TSIS (Sec/ Veh)
Delay by HCS2000 (Sec/Veh)
1
Chatrapati
sq. 41.3 40.1 42.6
2 Khamla sq. 40.6 39.2 41.8
3
Pratapnaga
r sq. 22.6 17.8 24.5
4 Padole sq. 29.2 20.4 30.4
5
Sambhaji
sq. 47.6 46.9 49.6
6
Trimurti
sq. 39.5 38.8 37.8
7
Mangalmu
rti sq. 38.4 38.6 39.5
[image:5.595.303.564.82.429.2]8 T-point 40.1 34.2 41.3
Fig. 3 Variation of control delay for Moring peak hour of different intersection
Table- 2 Variation of control delay for evening peak
hour of different intersection (5.00pm-6.00pm)
Sr.
No. Intersections
Delay by HCM
2000 (Sec/Veh)
Delay by TSIS (Sec/Veh)
Delay by HCS2000 (Sec/Veh)
1 Chatrapati sq. 47.6 46.3 46.8
2 Khamla sq. 40.6 39.8 41.9
3 Pratapnagar sq. 20.1 14 23.6
4 Padole sq. 56.3 54.3 58.6
5 Sambhaji sq. 48.6 46.4 49.7
6 Trimurti sq. 20.5 19.4 22.6
7 Mangalmurti sq. 29 21.8 32.5
175
Fig. 4 Variation of control delay for evening peak
hour of different intersection (5.00pm-6.00pm)
Noise level intensity and Fuel consumption
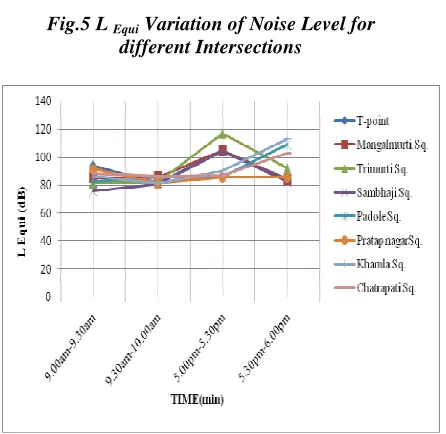
[image:6.595.302.525.76.293.2]When measuring long term noise exposure, the noise level is not always steady and may vary considerably, in an irregular way to over the measurement period. This uncertainty can be solved by measuring the continuous equivalent level , which is defined as, the constant sound pressure level which would have produced the same total energy as the actual level over the given time. It is denoted as Leq. The display of Leq facility is also available in certain models of sound level meters. This is the desired parameter for assessment of ambient noise levels (Table.3 and Fig.5) and fuel consumption shown in Table-4
Table.3 Leq Variation of Noise Level for different
Intersections
Fig.5 L Equi Variation of Noise Level for different Intersections
Table. 4 Fuel consumption at different intersection
(Liter or gallon)
4. Comparison of Data
The comparison of Control Delay has been done by comparing the value of High capacity manual and Intersections
Fuel Consumptions
4wheeler (liter/hr)
Fuel Consumptions 2 wheeler
(liter/hr)
Gallon Liter Gallon Liter
T-Point 0.14 0.529 0.17 0.64
Mangalmurti
Sq. 0.08 0.3 0.23 0.86
Trimurti Sq. 0.05 0.189 0.26 0.98 Sambhaji
Sq. 0.09 0.34 0.20 0.75
Padole Sq. 0.08 0.3 0.29 1.09 Pratapnagar
Sq. 0.06 0.22 0.24 0.9
Khamla Sq. 0.15 0.56 0.19 0.71 Chatrapati
Sq. 0.08 0.3 0.22 0.83
Total 0.75 2.755 1.8 6.781
[image:6.595.62.534.343.723.2]176 estimated control delay by using Traffic software
integrated system and highway capacity software presented in this project. Eight intersection of ring road have been taken up for comparison, Fig.6 and Fig.7 shows the comparison of data Highway capacity manual and estimated control delay by using Traffic Software Integrated System and Highway Capacity Software for morning peak hour and evening peak hour. The control delays have been calculated. It can be observed from Fig.7 and Fig.8 the percentage difference is well within ±5%.
Fig.6 Variation of control delay using Highway capacity manual and estimated control delay by using Traffic software integrated system and highway
capacity software ( Morning peak hour)
Fig.7 Variation of control delay using Highway capacity manual and estimated control delay by using
Traffic software integrated system and highway capacity software (Evening Peak hour)
5. CONCLUSION
The present study is conducted for wide range of control delay, fuel consumptions and noise pollution to maintain high degree accuracy to be applicable for the traffic flow with wider traffic volume data, signal timing and noise level data from each intersection of ring road. The study is conducted on important parameter affecting the Control Delay, fuel consumptions and noise pollution is done at each intersection by using TSIS, HCS2000 & HCM2000.Based on the data obtained from studies on control delay, the following conclusion are drawn
The control delay at all eight important intersections is more than 40 seconds/ vehicle during peak hours of traffic. TSIS software gives better results than HCM-2000 & HCS-2000 for analyzing the control delay.
Comparison estimated control delay data of Highway capacity manual with Traffic software integrated system (TSIS) and highway capacity software (HCS) that the percentage difference is well within ±5%. At Eight signalized intersection in Ring Road Nagpur 9.53 liters/hr of fuel is wasted everyday due to idling of vehicles. Converting these figures into monetary terms the total losses work out to be Rs. 8925/- per day.
177 important intersection of ring road, Nagpur city are
84.389 dB (A) and 95.80 dB (A) during daytime and night time respectively, which is ill effective on human health and environment.
REFERENCES
[1] Chepesiuk, R. (2005). “The effects of living in a Noisy World, Environmental Health Regulations in terms of Section 25 of the Environmental Conservation Act”, 1989 (Act No.73 of 1989), No. R. 154.
[2] Gartner N. H., R. Deshpande and C. Stamatiadis.(2011). “Assessing Performance Potential of Signalized Intersections and Arterials”. Procs. 6th Intern. Symp. on Highway Capacity and Quality of Service, Stockholm, Sweden, July 2011, H.N. Koutsopoulos and K.L. Bang (eds.), Elsevier, Rotterdam, pp. 492-503.
[3]
Ga
rtner N. H. and C. Stamatiadis. (2004)Progression Optimization Featuring Arterial and Route Based Optimization. Journal of ITS, Vol (8), April.
[4] Gartner, N.H. and R. Deshpande. (2009) Harmonic Analysis and Optimization of Traffic Signal Systems. Transportation and Traffic Theory 2009: Golden Jubilee, (Editors: William H.K. Lam, S.C. Wong and Hong K. Lo). Springer, New York, pp. 345-364.
[5] R.M.Deshpande, N. H. Gartner and M. L. Zarrillo(2010),“ Urban Street Performance: Level-of-Service and Quality of Progression Tradeoff Analysis. In Transportation Research Record 2173, TRB, National Research Council, Washington, D.C., USA 2010, pp. 57-63.