Lyrics-based Analysis and Classification of Music
Michael Fell Computational Linguistics
Saarland University D-66123 Saarbr¨ucken mic.fell@gmail.com
Caroline Sporleder
Computational Linguistics & Digital Humanities Trier University
D-54286 Trier
sporledc@uni-trier.de
Abstract
We present a novel approach for analysing and classifying lyrics, experimenting both with n-gram models and more sophisticated features that model different dimensions of a song text, such asvocabulary, style, semantics, orientation towards the world, and song structure. We show that these can be combined with n-gram features to obtain performance gains on three different classification tasks: genre detection, distinguishing the best and the worst songs, and determining the approximate publication time of a song.
1 Introduction
The ever growing amount of music available on the internet calls for intelligent tools for browsing and searching music databases. Music recommendation and retrieval systems can aid users in finding music that is relevant to them. This typically requires automatic music analysis, e.g., classification according to genre, content or artist and song similarity. In addition, automatic music (and lyrics) analysis also offers potential benefits for musicology research, for instance, in the field of Sociomusicology where lyrics analysis is used to place a piece of music in its sociocultural context (Frith, 1988).
In principle, both the audio signal and the lyrics (if any exist) can be used to analyse a music piece (as well as additional data such as album reviews (Baumann et al., 2004)). In this paper, we focus on the contribution of the lyrics. Songwriters deploy unique stylistic devices to build their lyrics. Some of those can be measured automatically and we hypothesise that these are distinctive enough to identify song classes such as genre, song quality and publication time. There is, in fact, strong empirical evidence that it is worthwhile to look deeper into lyrical properties when analysing and classifying music. For example, it has been shown that classifiers that incorporate textual features outperform audio-only classifiers on most classification tasks (Mayer et al., 2008a; Mayer and Rauber, 2011; Li and Ogihara, 2004). Lyrics are also often easier to obtain and process than audio data, and non-musicians, in particular, often rely strongly on lyrics when interacting with a music retrieval system (Baumann and Kl¨uter, 2002; Bainbridge et al., 2003). Moreover, lyrics do not only add semantic content, they can serve as an (easily observable) proxy for the melodic, structural and rhythmic properties of the audio signal. Melody and rhythm, for example, can often be traced in the stress pattern of the text (Nichols et al., 2009), while a song’s overall structure is reflected in the order of textual elements such as chorus, verse and bridge. Psychological research also provides evidence the audio and textual content are indeed processed independently in the brain and hence are complementary for our appreciation of a song (Besson et al., 1998).
We extend previous research on lyrics-based song classification in two important ways: First, while earlier approaches mostly used fairly shallow textual features, such as bags-of-words, we designed fea-tures that model semantic and stylistic properties of lyrics at a much deeper level and show that these features can indeed be beneficial. Second, we address two novel classification tasks beyond genre detec-tion, namely distinguishing ‘best’ and ‘worst’ songs1and determining the approximate publication time, and show that these can also be tackled by lyrics analysis.
This work is licensed under a Creative Commons Attribution 4.0 International Licence. Page numbers and proceedings footer are added by the organisers. Licence details:http://creativecommons.org/licenses/by/4.0/
1There is a growing body of work on automatic hit prediction but we would argue that this is a different task as hits are not necessarily qualitatively good songs and vice versa.
2 Related Work
This study draws on earlier work on text classification, including genre detection (Lustrek, 2007) and authorship attribution (Stamatatos, 2009; Holmes, 1994), but also more specifically on poetry analysis (Simonton, 1990) and, in particular, lyrics-based music classification. Generally, shallow features, such as average word and sentence length, part-of-speech and function word distribution tend to work well for authorship and genre classification, while content word distribution is more indicative of the topic. Recent work on text classification has also employed deeper features, such as distributions of syntactic constructions (see e.g., Kim et al. (2010)). However, not all features that work well for prose carry over to song lyrics. Syntax, for example, is strongly constrained by meter. On the other hand, additional features like meter and rhyme properties might be useful. So far, most studies on lyrics classification have used rather simple features, for example (tf-idf weighted) bags-of-words (Neumayer and Rauber, 2007; Mahedero et al., 2005; Logan et al., 2004), sometimes enriched by synonymy and hypernymy information (Scott and Matwin, 1998). Mayer et al. (2008a; 2008b) also include POS tag distributions, simple text statistics (avg. word length, proportion of hapax legomena per document/line, distribution of punctuation marks and digits, words per minute) and simple (end-of-line) rhyme features. Li and Ogihara (2004) use a similar feature set but also include function word distributions. Finally, Hirjee and Brown (2010) analyse Rap lyrics and focus exclusively on rhyme features, providing a sophisticated statistical rhyme detector which can also identify in-line and slant rhymes. We build on this work but extend the feature space with more explicit modelling of abstract stylistic and linguistic dimensions such as vocabulary, style, semantics, orientation of the song content with respect to the world and overall song structure.
3 Material
Since no large lyrics dataset was publicly available (cf. Mayer and Rauber (2011)), we had to collect our own.2 Song lyrics are widely available across the internet in the form of user-generated content. We chose Lyricsmode3 because of its large coverage and subjectively high consistency. Even so, a certain amount of inconsistency and noise remains. We employed heuristics to clean the data, e.g., to remove duplicate song texts and normalise the notation style of different users.4 Only English lyrics were included; songs in other languages were filtered out using language detection.5 Furthermore, to minimise data sparseness, songs were only included if more than 20 song texts were available for the corresponding artist. The final corpus consists of roughly 400k English song texts of 7.2k artists.6 For the experiments, the lyrics were POS tagged7and chunked.8
In addition to the lyrics themselves, we need three types of metadata for our experiments: genre information, quality ratings, and publication time. In all experiments, we classify songs rather than artists or albums. However, to avoid artist effects on our results, we control for the artist, i.e., we make sure that the test set does not contain (songs of) an artist if the training set already contains (songs of) the same artist; test and training set are completely disjunct with respect to artists.9 Because of this, we need to ensure a sufficient number of artists for each output class in the three experiments.
2The Million Song Database (Bertin-Mahieux et al., 2011), a large publicly available data set for music classification, does not contain lyrics and the only available data set that does contain lyrics, SLAC (McKay et al., 2010), only contains lyrics for 160 songs, which is too small to train and test on.
3http://www.lyricsmode.com
4See Fell (2014) for more details on the heuristics used in the present study and Knees et al. (2005) for an overview of the types of noise typically encountered and general methods for cleaning.
5A freely available Java library for language detection (Shuyo, 2010) was used.
6Note that there is no guarantee that the artist also wrote the lyrics. The corpus might contain covers and lyrics/songs that were written ‘on request’. However, performers do not choose their songs randomly but try to stick to songs that fit in with their preferred genre and style.
7http://nlp.stanford.edu/software/tagger.shtml 8https://opennlp.apache.org
Genre information was obtained fromAllmusic,10 which classifies artists and bands according to 21 coarse-grained genres and numerous subgenres. We excluded artists who experimented with several genres like Peter Gabriel (Pop/Rock, International) or Prince (R&B, Pop/Rock, Electronic) because in that case it is not clear which genre a particular song belongs to. As most genres occur only sparsely in our corpus, we focused on the nine most common genres,11resulting in a data set of 4,712 artists from the nine major genres with the following numbers of artists per genre: Pop/Rock: 2602, Metal: 1140, Rap: 390, Country: 225, R&B: 153, Religious: 118, Reggae: 38, Blues: 26, Folk: 20.
Besides genre, we retrieved album ratings and publication years fromRateyourmusic.12Album ratings range from 0 stars (worst) to 5 stars (best) and are typically averaged over hundreds to thousands user ratings. To exclude “one-hit-wonders”, only artists with at least two rated albums were considered. Theoretically, it would be possible to assign all songs a rating by transferring an album rating to all songs in the album. However, in practice this is difficult to do robustly because album ratings and lyrics come from different sites and are not trivial to align. Song listings for an album are sometimes incomplete and song titles noisy, making it difficult to map album ratings directly to songs. As a way around this we map album ratings to artists (which are much more robustly identifiable from the metadata) and then compute an overall artist rating as the median over all album ratings for the artist. Each song by the artist is then assigned this rating. Basically, we hypothesise that a good artist consistently writes good songs, which is, obviously, a simplifying assumption.
4 Features
We designed 13 feature classes, consisting of one or more related features each, and grouped them into five abstract sets, reflecting different stylistic and linguistic dimensions (see Table 1).13
Model Dimension Feature Classes
topK vocabulary: output class specific top 100 n-grams (n≤3) extended vocabulary: type-token ratio, non-standard words
style: POS/chunk tags, length, echoisms, rhyme features semantics: imagery
orientation: pronouns, past tense
song structure: chorus, title, repetitive structures
Table 1: Overview of features
As a baseline (topK), we implemented an n-gram model, which captures words and collocations that are most specific to an output class. This model can be considered ‘uninformed’ in that it does not attempt to represent abstract stylistic or structural properties. We rank n-grams according to the tf-idf for the class (i.e., the genres are considered ‘documents’ and the frequency of an n-gram is incremented by 1 for each song in which it occurs). To reduce the impact of vocabulary preferences of individual artists, we then re-rank by discounting n-grams which are too artist-specific. The top 100 n-grams (forn ≤3) are represented in the feature vector.14
The remaining features (extended) attempt to model the following five dimensions of the lyrics: VOCABULARY: These features estimate the vocabulary richness (type-token ratiofor n-grams up to
n = 3) and the use ofnon-standard words, i.e., uncommon and slang words. Uncommon words are defined as words not found in Wiktionary.15 Slang words are defined as words contained in the Urban Dictionary,16 but not in Wiktionary. We encode the (normalised) logarithmic frequency of slang words and the ratio of uncommon words to all words.
10http://www.allmusic.com
11We excluded the, also fairly frequent, genre Electronic as it is mainly musically defined (Logan et al., 2004). 12http://www.rateyourmusic.com
13Note that features are normalised by the length of the lyrics where necessary.
14The total number of encoded n-gram features is maximally 300 per output class but can be less, since n-grams common to multiple classes are encoded only once.
STYLE: We employed thePOS and chunk tag distributions as proxies for syntactic structure. To reduce data sparseness, all tags are mapped to supertags such as V, N, ADV. We also implemented variouslengthfeatures (lines per song, tokens per song, tokens per line). Rhymestructure is modelled by encoding the output of the rhyme detection tool by Hirjee and Brown (2010), which detects perfect and imperfect in-line and line final rhymes. Repetitions of letters (“riiiiise”) or words (“money, money”) are common in lyrics and often caused by a mismatch between number of syllables and line meter but they can also be employed as a means for emphasis and indicating emotion. We collectively dub such repetitionsechoisms. We also group in-line (slant) rhymes (“burning turning”, “where were we”) under ‘echoisms’. Echoisms are computed by looking for words with letter repetitions or word sequences with a relatively high similarity (according to an edit distance measure). Frequencies per type (letter reduplication, word repetition) and sequence length (less or more than 3 words) are encoded.
SEMANTICS: Lyrics can vary widely with respect to the topics they mention and the images they evoke. Instead of using a linguistic model of semantic fields, we opted to build on work in psychol-ogy and use the Regressive Imagery Dictionary (RID) (Martindale, 1975; Martindale, 1990) to iden-tify predominant concepts (“imageries”) in a text. RID classifies words as belonging to the separate fields “conceptual thought” (abstract, logical, reality-oriented), “primordial thought” (associative, con-crete, fantasy), and “emotion”. For example, the imagery ‘Moral’ (conceptual) contains words such as “should”, “right”, and “virtue”. Whereas the imagery ‘sensation’ (primordial) contains “delicious”, “perceive”, and “glamour”. We chose this resource because, intuitively, it is not only importantwhatis said but alsohowit is said and the RID seemed to capture both aspects well. We computed the dominant imageries for each text and encoded this information in the feature vector.
ORIENTATION: This dimension models how the song narrative (entities, events) is oriented with respect to the world. We encode a temporal dimension, i.e., whether the song mainly recounts past experiences or present/future ones, by representing the fraction of past tense verb forms to all verb forms as a feature. We also model how “egocentric” a song is. We compute pronoun frequencies for 1st, 2nd, 3rd singular and plural person. As derived features, we also encode the proportion of self-referencing pronouns (first person singular/plural) to non-self-referencing ones and the ratio of first person singular pronouns to second person. The former feature measures the degree of talking about oneself as opposed to talking about other people, the latter measures whether the “I” or the “you” carries more weight in an interpersonal relationship.
SONGSTRUCTURE: Structural repetitions are characteristic of song texts. We search forrepetitive structures, i.e., identical or similar multi-line blocks that re-occur, typically but not always representing the chorus. We use heuristics to align such structures, allowing for fuzzy matches. An example of a song text17 with a repeated structure is provided in Figure 1, where lines 56-60 are aligned to lines 61-65. It can be seen that corresponding lines are not lexically identical but only structurally and lexically similar. To be able to recognise such cases, we compute the overall similarity between two lines as a weighted sum of their lexical and structural similarities which are modelled in terms of word and POS tag bigram overlaps, respectively. Using this information and a set of heuristics, it is then determined whether a song contains achorusand whether thetitleappears in the song text.
[56]’Cause now I see right through you [61]But I see right through you [57]Look into my eyes [62]I look into your eyes [58]Tell me what you see [63]Tell you what I see
[59]I see a man who thought you loved me [64]I see a girl who ran game on me [60]You played me like a fool [65]You thought you had me fooled
Figure 1: Alignment of two blocks in the same song text
genre best vs. worst approx. publication time training set 2,520 1,008 (Rap) 1,680 (Metal) 3,360 (Pop/Rock) 315 (Pop/Rock) test set 840 294 (Rap) 546 (Metal) 1,092 (Pop/Rock) 105 (Pop/Rock)
Table 2: Average data set sizes (number of songs) for each experiment
5 Experiments
We carried out three experiments: classifying songs by (i) their genre, (ii) their quality (best vs. worst), and (iii) their approximate publication time. There is empirical evidence that lyrics may indeed play a crucial role in all three classification tasks. Musical genre is often defined as a cultural category, rather than a purely musical one (Fabbri, 1981). What topics artists sing about and how they sing about them clearly belongs to this cultural dimension. Lyrics also contribute to whether a song is viewed as ‘good’ or ‘bad’. A study by Cunningham et al. (2005) also indicates that the lyrics are an important factor for
dislikinga song and Salley (2011) provides examples of how (text-)stylistic devices such as alliteration can make a song more engaging and therefore more successful. Finally, Hirjee and Brown (2010) show, for Rap, that the dominant style of song texts can change over time.
In all experiments, we compared our baseline feature set (topK) against the extended set (extended) and a combined set (combined). As the class distribution in our data is severely skewed, we performed random undersampling to create balanced sets for all experiments and thus avoid problems commonly associated with learning from imbalanced data (He and Garcia, 2009). The sampled data sets were split into 75% for training and 25% for testing. The exact numbers depend on the experiment (see Table 2). We repeated the sampling, training and testing procedure between 100 and 1000 times (depending on the experiment) and report the average. The Weka (Hall et al., 2009) implementation of SVMs with the default setting was used for classification.
5.1 Experiment 1: Genre Classification
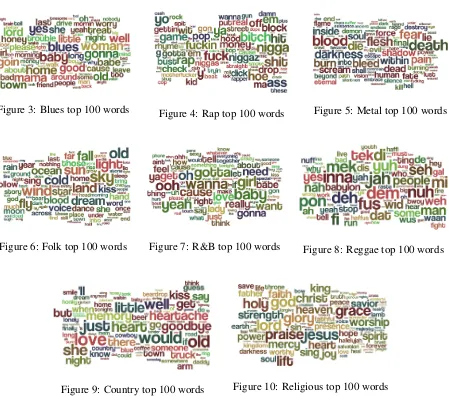
We focused on the following eight genres: Blues, Rap, Metal, Folk, R&B, Reggae, Country, and Reli-gious. Pop/Rock was excluded because it is the most heterogeneous genre and comprises many subgen-res. Table 3 shows the results per genre and averaged over all genres, as well as the standard deviations. The n-gram model (topK) outperforms theextended model on all genres except Country but a combi-nation of both models consistently yields even better results with an overall average F-Score of 52.5%. All F-Score differences between the three models are statistically significant atp <0.01.18 The fact that the combined model performs best indicates that the two basic models are at least partially complemen-tary. The n-gram model hones in on the topic of a text, while the extended model captures more abstract structural and stylistic properties. However, both perform similarly on individual genres, i.e., they both in themselves capture important aspects of ‘genre’. Looking at the individual genres, Rap seems to be most easily detectable on the basis of the lyrics alone (77.6% F-Score,combined). This is not surprising, since Rap lyrics have properties that are quite unique, such as complex rhyme structures, long lyrics and a fairly distinctive vocabulary. Folk seems to be the most difficult genre (29.6% F-Score,combined). A look at the confusion matrix revealed that Folk was frequently confused with Blues or Country. All share similar topics (e.g., love, traveling) and are also structurally and stylistically similar. They are mainly distinguished by musical properties (instrumentation, rhythm etc.). Lyrical similarities and differences are also revealed by looking at the top 100 unigrams for each genre (Figures 3 to 10). It can be seen that some genres stand out lexically, for example Rap (dominant slang use), Reggae (Jamaican slang, Rastafarian terms), Religious (religious terms) and Metal (death, violence). Some genres, however, are lexically quite similar such as Folk, Blues and Country.
Figure 2 shows the contributions of different feature groups to the overall performance of the combined model.19 It can be seen thatlengthcontributes most, followed byslang use,type-toke ratio,POS/Chunk 18We performed a non-exhaustive permutation test by sampling107permutations and computed the Wilson-Score Interval
for the estimated p-value with probability 99.9999%.
F-score [%] Blues Rap Metal Folk R&B Reggae Country Religious Average
topK 51.2 76.0 49.0 28.3 48.7 44.4 41.3 53.3 49.0 (±2.5)
extended 46.6 75.1 47.3 24.5 47.7 35.8 53.8 37.3 46.0 (±2.4)
combined 54.1 77.6 52.0 29.6 52.6 45.4 54.6 53.8 52.5(±2.7)
human optimistic 40.9 66.7 42.4 18.2 34.8 12.1 28.8 53.0 37.1 (±8.4)
[image:6.595.75.524.173.487.2]human pessimistic 37.6 53.8 38.3 18.6 29.4 15.3 27.7 47.8 33.6 (±7.5)
Table 3: F-Scores[%] for genre classification (1000 runs, averages)
Figure 2: Feature Contributions for Experiment 1 (combined model)
tagsand the more semantic featuresimageryandpronouns. Rap, which tends to have long lyrics with many slang words, is the genre that is identified most reliably by the classifiers and it is therefore not surprising that the two most contributing feature groups are particularly well suited for distinguishing Rap from the remaining genres.
While the performance of the combined model is promising,20there is still room for improvement. In order to determine whether this is a limitation inherent to the model or whether lyrics alone simply do not provide a strong enough signal for music genre classification, we performed a human annotation exper-iment. Participants (n= 11) had to classify randomly selected song texts into the 8 genres. They were allowed to assign up to two genres to each song. We report two performance measures (see Table 3):
human optimisticcounts an instance as correct if the correct genre was in the set of genres assigned,
human pessimisticonly counts unique genre assignments which correspond to the gold standard as cor-rect. It can be seen that the human performance is actually worse than the automatic classification.21
Uncertainty (SU) (Witten and Frank, 2005) for each feature and class label. By accumulating the SUs for all features in a feature group we estimate to which proportion on average a group of features helps in identifying the correct class.
20The random baseline for this experiment is 12.5% F-Score.
Apparently, humans had difficulty picking up on subtle stylistic properties, especially since they were not ‘trained’ in any way, i.e., they had to rely on their own conception of what is typical for a genre. Hence, they (self-reportedly) relied mostly on the topic of a text.22Comparing results on individual gen-res, however, humans behave similar to the automatic classifier: Folk is the most difficult genre, Rap the easiest. An exception is Reggae which was more difficult for our participants than for the models. We performed a more detailed (statistical) comparison of the confusion matrices for humans and classifiers, which indicated that genres are indeed similarly confused by both. This could suggest that some genres are inherently more difficult to detect than others (based on lyrics alone).
Figure 3: Blues top 100 words Figure 4: Rap top 100 words Figure 5: Metal top 100 words
[image:7.595.77.526.173.590.2]Figure 6: Folk top 100 words Figure 7: R&B top 100 words Figure 8: Reggae top 100 words
Figure 9: Country top 100 words Figure 10: Religious top 100 words
5.2 Experiment 2: Best vs. Worst Music
In our second experiment, we tested whether the ‘best’ songs can be distinguished from the ‘worst’ solely on the basis of their lyrics. Having obtained average artist ratings (see Section 3), we defined the best (worst) artists as top (bottom) percentiles of all ratings. We also made sure that the distance between best and worst ratings was at least 1 point to ensure there was still a large enough gap. We assume that the quality of a song is genre-dependent, i.e., properties that make a good rap song are not necessarily desirable for a good blues song. Hence, our classifiers were trained and tested within genres. Only three of the original genres had enough material to satisfy the constraints: Pop/Rock, Metal, and Rap. For Pop/Rock and Metal, where more material was available, the ‘best’ (‘worst’) was defined as the top (bottom) 5% of artists, while for Rap the top (bottom) 10% percentiles were considered.
Pop/Rock Metal Rap
Model Best Worst Average Best Worst Average Best Worst Average
[image:8.595.98.500.61.117.2]topK 69.4 72.0 70.8 (±2.2) 71.3 72.0 71.7 (±3.7) 85.9 85.1 85.6 (±4.1) extended 72.6 73.9 73.3 (±2.0) 76.5 76.2 76.4 (±4.0) 81.1 82.4 81.8 (±4.2) combined 74.7 76.2 75.5(±2.3) 76.7 76.2 76.5(±4.3) 86.4 86.3 86.4(±4.1)
Table 4: F-Score[%] for Best vs. Worst (100 runs, averages)
Table 4 shows the results, which are encouragingly high, ranging from 75.5% to 86.4% F-Score (com-pared to a random baseline of 50% F-Score). It seems that the quality of a song does indeed at least partially depend on the quality of its lyrics and that the latter can to some extend be determined au-tomatically. As in the previous experiment the combined model outperforms the other two models. However, unlike in the previous experiment, theextendedmodel now outperforms thetopKon two gen-res (Pop/Rock and Metal). This suggests that, at least for these two gengen-res, the simple word n-grams are not sufficient to distinguish good and not so good songs; other features, contribute as well. Rap is the odd-one-out here: For this genre, the quality of a song seems to lie largely in the words and phrases used. All differences in F-Scores between the three models are significant withp <0.01, except for the differenceextendedvs.combinedfor Metal, which is not significant (p >0.3).
[image:8.595.75.523.416.674.2]Figure 11 shows the feature contributions in the combined model. It can be seen that Rap behaves differently than the other two genres. For Rap the featureslengthandslangcontribute most, followed by type-token ratio, POS/Chunk tags, pronouns and rhyme features. The latter are noticeably more important for Rap than for the other two genres. For Pop/Rock and Metal,type-token ratiois by far the most important, closely followed bylength. Orientation features (pronouns,past tense), song structure (repetitive structures,chorus) andPOS/Chunk tagsalso contribute quite a lot. Generally, it seems to hold for all three genres that the best songs are characterised by a higher type-token ratio, fewer interjections and nonsense words (“lalala”), and lower ratio of first person pronouns.
Figure 11: Feature Contributions for Experiment 2 (combined model)
Figure 12: Best Rap top 100 words Figure 13: Worst Rap top 100 words
5.3 Experiment 3: Approximate Publication Time
In the final experiment, we investigate whether one can automatically predict the approximate publication time of a song given its lyrics. We controlled both for genre and musical quality and trained classifiers to separate the song texts according to their age. We chose Pop/Rock since we have the most material for this genre and defined three time groups in such a way that we have sufficient data for each of them:New
contains songs published since 2008,mid-agesongs published between 1998 and 2001, and oldsongs published before 1988. We intentionally left gaps between the three classes since the boundaries are somewhat arbitrary and we assume that a song published in, say, 2008 will notper sediffer substantially from one published in 2007.
Table 5 shows the results. Regarding the performance of the different models, we see a similar trend as in the previous experiments: the combined model performs best, the n-gram model performs slightly better than the extended model but there is not much between them. The differences in F-Scores between the models are statistically significant withp <0.01. Overall, while all models beat the random baseline (33% F-Score), the results are still relatively low. By inspecting the confusion tables, we discovered that
oldandneware separated well from each other, withnewbeing classified asoldin only 23% of the cases and the opposite happening in 17% of the cases. On the other hand,mid-ageshows the lowest F-Score and is misclassified in an almost symmetrical way (new: 27%,mid-age: 41%,old: 32%). It seems that, while the publication date of a song can at least partially be determined on the basis of the lyrics, only songs which are published 20 years and more apart can be distinguished relatively well. In a way this is not so surprising; we would expect the musical style to change over shorter times spans reflecting for example changes in taste regarding instrumentation and recording technology (live drums vs. drum computers, use of auto-tune effects etc.), properties of the lyrics, however, tend to change over much longer time periods.
Model New Mid-Age Old Avg.
topK 47.2 39.2 48.7 45.0 (±4.4)
[image:9.595.195.404.577.623.2]extended 44.1 39.1 43.2 42.2 (±4.9) combined 48.9 41 .0 50.5 46.8 (±5.4)
Table 5: F-Scores [%] for Old vs. Mid-Age vs. New Pop/Rock (100 runs, averages)
Figure 14: Feature Contributions for Experiment 3
Figure 15: Pop/Rockold, top 100 words
Figure 16: Pop/Rock mid-age, top 100 words
Figure 17: Pop/Rocknew, top 100 words
6 Conclusion
References
David Bainbridge, Sally Jo Cunningham, and J. Stephen Downie. 2003. How people describe their music infor-mation needs: A grounded theory analysis of music queries. InProc. of the International Symposium on Music Information Retrieval (ISMIR 2003), pages 221–222.
Marco Baroni and Silvia Bernardini. 2006. A new approach to the study of translationese: Machine-learning the difference between original and translated text. Literary and Linguistic Computing, 21(3):259–274.
Stephan Baumann and Andreas Kl¨uter. 2002. Super-convenience for non-musicians: Querying mp3 and the semantic web. InProc. of the 3rd International Conference on Music Information Retrieval (ISMIR 2002).
Stephan Baumann, Tim Pohle, and Vembu Shankar. 2004. Towards a socio-cultural compatibility of MIR systems. InIn Proc. of the 5th International Conference on Music Information Retrieval (ISMIR ’04), pages 460–465.
Thierry Bertin-Mahieux, Daniel P.W. Ellis, Brian Whitman, and Paul Lamere. 2011. The million song dataset. In
Proceedings of the 12th International Conference on Music Information Retrieval (ISMIR 2011).
M. Besson, F. Fata, I. Peretz, A.-M. Bonnel, and J. Requin. 1998. Singing in the brain: Independence of lyrics and tunes. Psychological Science, 9(6):494–498.
Sally Jo Cunningham, J. Stephen Downie, and David Bainbridge. 2005. ”The pain, the pain”: Modelling music information behavior and the songs we hate. InProc. of the International Conference on Music Information Retrieval (ISMIR ’05), pages 474–477.
Franco Fabbri. 1981. A theory of musical genres: Two applications. In D. Horn and P. Tagg, editors, Popu-lar Music Perspectives, pages 52–81. International Association for the Study of Popular Music, G¨oteborg and Exeter.
Michael Fell. 2014. Lyrics classification. Master’s thesis, Saarland University.
Simon Frith. 1988.Music for Pleasure: Essays in the Sociology of Pop. Routledge, New York.
Mark Hall, Eibe Frank, Geoffrey Holmes, Bernhard Pfahringer, Peter Reutemann, and Ian H. Witten. 2009. The WEKA data mining software: an update. SIGKDD Explor. Newsl., 11(1):10–18, November.
Haibo He and Edwardo A. Garcia. 2009. Learning from imbalanced data. IEEE Transactions on Knowledge and Data Engineering, 21(9):1263–1284.
Hussein Hirjee and Daniel G. Brown. 2010. Using automated rhyme detection to characterize rhyming style in Rap music. Empirical Musicology Review, 5(4):121–145.
David I. Holmes. 1994. Authorship attribution.Computers and the Humanities, 28(2):pp. 87–106.
Sangkyum Kim, Hyungsul Kim, Tim Weninger, and Jiawei Han. 2010. Authorship classification: A syntactic tree mining approach. InProceedings of the ACM SIGKDD Workshop on Useful Patterns, pages 65–73.
Peter Knees, Markus Schedl, and Gerhard Widmer. 2005. Multiple lyrics alignment: Automatic retrieval of song lyrics. InProc. of the 6th International Conference on Music Information Retrieval (ISMIR’05), pages 564–569. Tao Li and Mitsunori Ogihara. 2004. Music artist style identification by semi-supervised learning from both lyrics
and content. InProc. of the 12th Annual ACM International Conference on Multimedia, pages 364–367. Beth Logan, Andrew Kositsky, and Pedro Moreno. 2004. Semantic analysis of song lyrics. In Proc. IEEE
International Conference on Multimedia and Expo (ICME ’04), pages 827–830.
Mitja Lustrek. 2007. Overview of automatic genre identification. Technical Report IJS-DP-9735, Jozef Stefan Institute, Department of Intelligent Systems, Jamova 39, 1000 Ljubljana, Slovenia, January.
Jose P. G. Mahedero, ´Alvaro Mart´ınez, Pedro Cano, Markus Koppenberger, and Fabien Gouyon. 2005. Natural language processing of lyrics. InProceedings of the 13th Annual ACM International Conference on Multimedia, pages 475–478.
Rudolf Mayer and Andreas Rauber. 2011. Music genre classification by ensembles of audio and lyrics features. In
Proceedings of the 12th International Society for Music Information Retrieval Conference (ISMIR 2011), pages 675–680.
Rudolf Mayer, Robert Neumayer, and Andreas Rauber. 2008a. Combination of audio and lyrics features for genre classification in digital audio collections. InProceedings of the 16th ACM international conference on Multimedia, MM ’08, pages 159–168.
Rudolf Mayer, Robert Neumayer, and Andreas Rauber. 2008b. Rhyme and style features for musical genre classification by song lyrics. In Proc. of the 9th International Conference on Music Information Retrieval (ISMIR08).
C. McKay, J. A. Burgoyne, J. Hockman, J. B. L. Smith, G. Vigliensoni, and I. Fujinaga. 2010. Evaluating the genre classification performance of lyrical features relative to audio, symbolic and cultural features. InProceedings of the International Society for Music Information Retrieval Conference, pages 213–8.
Robert Neumayer and Andreas Rauber. 2007. Integration of text and audio features for genre classification in music information retrieval. InProc. of the 29th European Conference on Information Retrieval (ECIR07), pages 724–727.
Eric Nichols, Dan Morris, Sumit Basu, and Christopher Raphael. 2009. Relationships between lyrics and melody in popular music. InProc. of the International Symposium on Music Information Retrieval (ISMIR 2009). Keith Salley. 2011. On the interaction of alliteration with rhythm and metre in popular music. Popular Music,
30:409–432.
Sam Scott and Stan Matwin. 1998. Text classification using WordNet hypernyms. InProc. the Coling-ACL Workshop on Usage of WordNet in Natural Language Processing Systems, pages 45–51.
Nakatani Shuyo. 2010. Language detection library for Java.
Dean Keith Simonton. 1990. Lexical choices and aesthetic success: A computer content analysis of 154 Shake-speare sonnets. Computers and the Humanities, 24(4):pp. 251–264.
Efstathios Stamatatos. 2009. A survey of modern authorship attribution methods. Journal of the American Society for Information Science and Technology, 60(3):538–556.

![Table 3: F-Scores[%] for genre classification (1000 runs, averages)](https://thumb-us.123doks.com/thumbv2/123dok_us/772340.1089954/6.595.75.524.173.487/table-f-scores-genre-classication-runs-averages.webp)

![Table 5: F-Scores [%] for Old vs. Mid-Age vs. New Pop/Rock (100 runs, averages)](https://thumb-us.123doks.com/thumbv2/123dok_us/772340.1089954/9.595.195.404.577.623/table-scores-old-mid-age-new-rock-averages.webp)

