Investigations of Pyrrole
-
Imidazole Polyamide
Effects on DNA Replication
Thesis by
Thomas Farid Martínez
In Partial Fulfillment of the Requirements
for the degree of
Doctor of Philosophy
CALIFORNIA INSTITUTE OF TECHNOLOGY
Pasadena, California
2016
© 2016
Acknowledgments
The program that defines the parameters of our physical nature, our biology, is acquired from reproduction; our humanity, however, is born from the information we extract from our world. Based on the information we are given from the experience of countless lives before us and from sensory observations, and what we choose to believe, we learn how best to operate in our world. This information propagates and evolves through our interactions, both direct and indirect, with others. Thus, in expressing our unique humanity we are all models, whether we intend to be or not. Given the critical role of information in shaping our humanity, it is apparent that teaching and mentorship, which provide curated information, are extremely powerful means for shaping our world. Some individuals teach purposefully, and amongst those who have this intention some are better than others.
expectations on me. I could feel this. I could sense their recognition of an opportunity in me, though I often had no idea what the opportunity was. I think that they believed at some level that training me would allow them to shape the world in ways they could not with their own hands. The interesting thing, though, is that it was not the guidance or training that usually impacted me the most, but the belief in myself born from their faith in me. This, too, is the power of teaching.
Not all of my mentors have resonated with me so strongly, though. Some mentors created such a strong dissonance with my own values that I found it impossible to ignore. I am grateful to them as well—just as grateful as I am to the mentors whom I understood immediately. Both positive and negative experiences contribute to self-discovery and development of one’s value system. Therefore, the mentors whom I could not understand or agree with still played significant roles in my journey to become a person that I could respect. It is also true that some of the mentors whose teachings felt so alien to me I eventually learned to understand long after I had left their tutelage. These experiences have often stayed with me the most.
If I have had any success up to this point in my life, it is because of my mentors and the people I choose to keep close to my heart. My humanity is a reflection of their humanity, and theirs of mine.
Abstract
Table of Contents
Page
Acknowledgments . . . iv
Abstract . . . vi
Table of Contents . . . vii
List of Figures and Tables . . . x
Chapter 1: Introduction 1.1 Deoxyribonucleic acid . . . 2
1.2 Molecular recognition of DNA in nature . . . 4
1.3 Pyrrole-imidazole polyamides . . . 7
1.4 Biological activity of pyrrole-imidazole polyamides . . . 11
1.5 Small molecule inhibitors of DNA replication . . . 14
1.6 Scope of this work . . . 16
1.7 References . . . 18
Chapter 2: Replication Stress by Py–Im Polyamides Induces a Non-canonical ATR- dependent Checkpoint Response Abstract . . . 25
2.1 Introduction . . . 26
2.2. Results . . . 28
2.3 Discussion . . . 47
2.4 Materials and Methods . . . 53
2.5 Acknowledgments . . . 65
Chapter 3: Py-Im Polyamides Inhibit DNA Replication in Cell-Free Extracts from X. laevis Oocytes
Abstract . . . 73
3.1 Introduction . . . 74
3.2 Results . . . 76
3.3 Discussion . . . 85
3.4 Materials and Methods . . . 88
3.5 Acknowledgments . . . 90
3.6 References . . . 91
Chapter 4: DNA-binding Py-Im Polyamides Targeted to the AR-ERG Signaling Axis in VCaP Prostate Cancer Cells Abstract . . . 94
4.1 Introduction . . . 95
4.2 Results . . . 97
4.3 Discussion . . . 108
4.4 Materials and Methods . . . 113
4.5 Acknowledgments . . . 120
4.6 References . . . 121
Appendix A: Investigations of anti-BrdU Antibody Staining of Py-Im Polyamide Treated Cells A.1 Background . . . 126
A.3 Conclusions . . . 143
A.4 Acknowledgments . . . 144
List of Figures and Tables
Page Chapter 1
Figure 1.1 Structure of DNA and hydrogen bonding patterns of Watson-Crick
base pairs . . . 2
Figure 1.2 Structures of transcription factor:DNA complexes . . . 4
Figure 1.3 Chemical structures of DNA-binding small molecule natural products . . . 5
Figure 1.4 Structures of distamycin A bound to DNA . . . 7
Figure 1.5 Molecular recognition of DNA by Py-Im polyamides . . . 9
Figure 1.6 Py-Im polyamide binding alters the structure of DNA . . . 10
Figure 1.7 Examples of polyamide biological activities in tissue culture and animal studies . . . 12
Table 1.1 Structures and putative mechanisms of a library of small molecule DNA replication inhibitors . . . 16
Chapter 2 Figure 2.1 Polyamides cause accumulation of S-phase cells and PCNA foci . . . . 29
Table 2.1 Summary of cytotoxicity IC50 values of polyamides 1 and 2 prostate cancer cell lines . . . 30
Figure 2.2 Polyamides induce apoptosis in DU145 cells . . . 31
Figure 2.4 Effects of small molecule PI3-kinase inhibitors on polyamide-induced S-phase accumulation . . . 35
Figure 2.5 High concentration polyamide treatment does not does not inhibit
aphidicolin-induced Chk1 phosphorylation . . . 37
Figure 2.6 Polyamides do not induce phosphorylation of Chk1, RPA2, or Chk2 or observable DNA breaks . . . 38
Figure 2.7 Polyamides induce phosphorylation of MCM2 and FANCD2
monoubiquitination . . . 40
Figure 2.8 Effects of ATM- and ATR-specific small molecule inhibtors on polyamide-induced MCM2 S108 phosphorylation and
FANCD2 monoubiquitination . . . 42
Figure 2.9 FANCD2 increases cell survival after exposure to polyamide 1 . . . 43
Figure 2.10 Knockdown of FANCD2 by siRNA does not prevent the accumulation of DU145 cells in S-phase in response to polyamide treatment . . . 44
Figure 2.11 Py-Im Polyamides stabilize duplex DNA regardless of match site
position in the duplex . . . 45
Figure 2.12 Polyamide 1 inhibits T7 gp4A helicase activity . . . 46
Figure 2.13 Polyamide 1 inhibits helicase activity of S. cerevisiae Dna2 nuclease dead but helicase active mutant (yDna2-K677R) . . . 48
Figure 2.14 Putative model of Py-Im polyamide-induced replication stress and subsequent ATR-dependent checkpoint response . . . 50
Chapter 3
Figure 3.1 Polyamide 1 inhibits DNA replication in Xenopus oocyte extracts . . . . 77
Figure 3.2 Py-Im Polyamides targeted to different DNA sequences equally
inhibit DNA replication in Xenopus oocyte extracts . . . 79
Figure 3.3 Polyamide 1 does not inhibit loading of pre-RC factors or activate ATR checkpoint signaling . . . 80
Figure 3.4 Polyamide 1 inhibits decondensation of sperm chromatin . . . 82
Figure 3.5 Polyamide 1 inhibits DNA replication when dosed after
DNA decondensation step . . . 84
Figure 3.6 Methods of synchronizing mammalian cells at different stages
of the cell cycle . . . 88
Chapter 4
Figure 4.1 Diagrams of targeting AR- and ERG-DNA interfaces
by Py-Im polyamides . . . 96
Table 4.1 Analysis of DNA thermal stabilization by binding
of Py-Im polyamides . . . 97
Figure 4.2 Representative expression data for VCaP cells treated with
AR1 and AR2 followed by DHT-induction . . . 98
Table 4.2 Gene expression data for VCaP cells treated with AR1 and AR2
followed by induction with DHT . . . 99
Figure 4.3 Representative expression data for VCaP cells treated with ETS1-3 . 100
Table 4.3 Gene expression data for VCaP cells treated with ETS-targeting
Figure 4.4 AR1 and AR2 are cytotoxic in VCaP cells . . . 102
Figure 4.5 Nuclear uptake of FITC-analog polyamides in VCaP cells
after 24 h . . . 103
Figure 4.6 Nuclear uptake of FITC-analog polyamides in VCaP cells
after 48 h . . . 104
Figure 4.7 Analysis of DNA damage by neutral comet assay . . . 105
Figure 4.8 Py-Im polyamides mediate ERG-driven expression in PC3-ERG
cells and reduce extant DNA damage . . . 106
Figure 4.9 Gene expression data for PC3-ERG cells treated with ETS-targeting and AR-targeting polyamides . . . 107
Figure 4.10 AR2 inhibits HUVEC tube formation in vitro . . . 108 Figure 4.11 AR1 but not ETS3 reduces the growth of VCaP tumors
in SCID mice . . . 109
Figure 4.12 Chemical structures of Py-Im polyamides studied . . . 114
Figure 4.13 Primer sequences for qPCR analysis . . . 117
Appendix A
Figure A.1 Ball-and-stick representations of Py-Im polyamides used
in this study . . . 127
Figure A.2 MoBU-1 immunocytochemistry shows punctate staining in DU145 cells treated with BrdU followed by polyamide 1 . . . 128
Figure A.3 MoBU-1 stains polyamide 1 treated DU145 cells in the absence
of BrdU . . . 130
MeOH:AcOH or 2% formaldehyde . . . 132
Figure A.5 MoBU-1 staining in response to a small library of polyamides . . . 134
Figure A.6 Z-stack of MoBU-1 stained DU145 cells treated with
polyamide 1 or 5 . . . 135
Figure A.7 Staining of polyamide treated cells is dependent upon MoBU-1 . . . . 136
Figure A.8 MoBU-1 staining in DU145 cells treated with Py-Im polyamides after fixation with formaldehyde . . . 138
Figure A.9 Anti-BrdU antibody ZBU30 but not ICR1 stains polyamide-
treated DU145 cells . . . 139
Figure A.10 Electrophoretic mobility shift assay (EMSA) of MoBU-1
Chapter 1
1.1 Deoxyribonucleic acid
In 1944, Oswald Avery, Colin MacLeod, and Maclyn McCarty discovered that deoxyribunocleic acid (DNA) is the chemical that makes up genes, the molecular unit of heredity (1). Then in 1953, the structure of DNA was solved, revealing it to be a double-stranded, anti-parallel, right-handed, double-helical polymer (Figure 1.1A) (2,3). Each DNA strand is composed of four monomers called nucleotides: deoxyadenosine (A), deoxythymidine (T), deoxycytidine (C), and deoxyguanosine (G), which are connected to one another by phosphodiester bonds with the deoxyribose sugar (Figure 1.1B). The two
M
Figure 1.1 Structure of DNA and hydrogen bonding patterns of Watson-Crick base pairs. (A) Structure of B-form DNA (PDB 1BNA) (4). (B) Chemical structures duplex DNA showing all four bases. Adenine (A) is bonded to thymine (T) and cytosine (C) is bonded to guanine (G). Dashed lines indicate hydrogen bonds. (C) Major and minor groove hydrogen bonding patterns of the four Watson-Crick base pairs. Circles with dots represent lone pairs (hydrogen bond acceptor), and circles with an H represent hydrogen atoms from an exocyclic amine (hydrogen bond donor).
strands are held together by hydrogen bonds formed between the nitrogenous bases, which lie perpendicular to the helical axis. The structure of DNA also demonstrated the pairing rules between the bases of the two strands, namely A pairs with T and C pairs with G. These rules result in four possible base pairs, called Watson-Crick base pairs. Two hydrogen bonds can be formed between A and T, while three can form between C and G. The structure of DNA shown in Figure 1.1A is of B-form DNA which is believed to be the predominant form in cells. In this form of DNA, the asymmetric spacing of the strands caused by the nitrogenous bases creates major and minor grooves. The pattern of hydrogen bond donors and acceptors on the exocyclic portions of the bases allows for molecular recognition of all four base pairs in the two different grooves (Figure 1.1C), which is critical for all DNA functions.
which are believed to have regulatory functions (7). In addition, short peptides called short open reading frame encoded polypeptides (SEPs) are being discovered in higher order eukaryotes that are expressed from RNA transcripts previously thought to be non-coding (8). Clearly, after more than 70 years we still have much to learn about DNA. Continuing to learn about DNA’s chemical properties and biological functions has been critical to understanding life and the origin of disease, as many diseases can be traced to aberrations in the genome. With enough knowledge, one may be able to develop chemical tools to combat a variety of diseases through targeting of the DNA.
1.2 Molecular recognition of DNA in nature
Transcription of DNA into RNA is one of the most critical processes in the cell. Transcription factors (TFs) are proteins that reversibly bind to DNA and regulate transcription by participating in the recruitment or blocking of RNA polymerase. TFs bind to specific sequences of DNA non-covalently through interactions with the nitrogenous bases in the minor groove, the major groove, or a combination of both.
Myc/Max
Lef-1 TBP
Figure 1.2 Structures of transcription factor:DNA complexes. Lef-1 (PDB 2LEF) (12),TBP (PDB 1TGH) (13), Myc/Max (PDB 1NKP) (14).
Through interactions with DNA as well as interactions with other proteins either directly or allosterically through DNA, TFs are able to achieve high binding affinities to DNA (9-11). TFs have a variety DNA-binding domain motifs, representing different strategies nature has evolved for molecular recognition of DNA. Such examples include the minor groove-binding high mobility group domain found in Lef-1, the minor groove-binding TATA binding protein, and the major groove-binding basic helix-loop-helix leucine zipper domain found in the Myc/MAX heterodimer (Figure 1.2) (12-14). In addition to their critical role in transcription, TFs offer insight into how sequence-selective recognition of DNA can be achieved by artificially engineered factors or synthetic molecules.
Another class of biomolecules that can reversibly bind to specific sequences of DNA is small molecule natural products. Like TFs, these small molecules are also able to
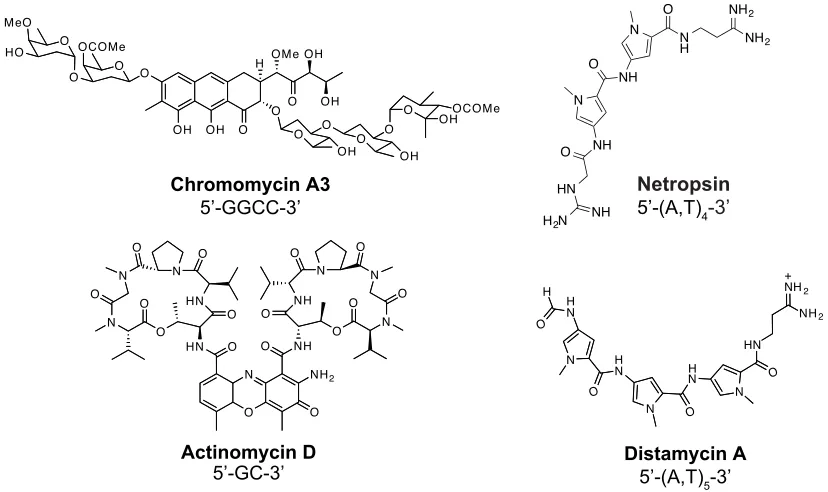
Chromomycin A3
Figure 1.3 Chemical structures of DNA-binding small molecule natural products.
bind to DNA by various modes including intercalation, minor groove binding, major groove binding, and combinations thereof (15). Examples of DNA-binding natural products include the intercalator actinomycin D, and the minor groove binders chromomycin A3, netropsin, and distamycin A (Figure 1.3). Actinomycin D is selects for 5’-GC-3’ sequences, while chromomycin selects for 5’-GGCC-3’. Both netropsin and distamycin bind specifically to A/T tracts.
DNA-binding natural products are often antibiotics synthesized by microorganisms in order to kill or inhibit the growth of competing organisms of a different species, and some have also been effective as anticancer agents (15,16). These DNA-binding molecules often inhibit critical DNA-dependent processes such as transcription and DNA replication. For example, actinomycin has been shown to inhibit both transcription and replication (17,18). Distamycin A has been shown to disrupt a variety of DNA-dependent processes as well through inhibition of RNA polymerase, DNA polymerase, topoisomerases I and II, and helicases (19-21).
N-methylimidazole would allow for recognition of G•C base pairs in the floor of the minor groove (25). Drawing inspiration from nature to synthesize small molecules capable of sequence-specific recognition of DNA could provide an effective means of combating disease states through the modulation of transcription.
1.3 Pyrrole-Imidazole polyamides
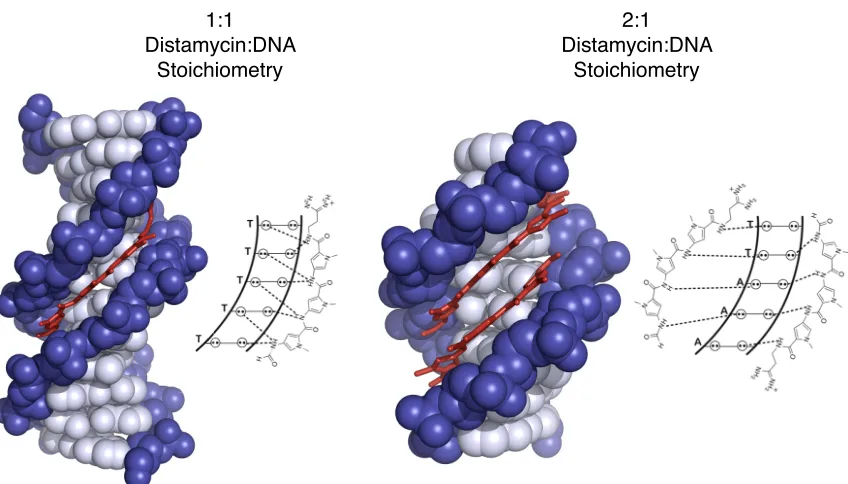
The initial observation of the 2:1 distamycin binding configuration to DNA led to the development of a new class of synthetic small molecules called pyrrole-imidazole (Py-Im) polyaimdes that are capable of recognizing all four Watson-Crick base pairs and bind to DNA with affinities comparable to DNA-binding proteins (26,27). Recognition of all four base pairs was achieved by modifying distamycin to incorporate
N-1:1 Distamycin:DNA
Stoichiometry
2:1 Distamycin:DNA
Stoichiometry
Figure 1.4 Structures of distamycin A bound to DNA. (A) Structure of 1:1 complex of distamycin with DNA (PDB 2DND) and a schematic of distamycin binding to the minor groove in the 1:1 mode. (B) 2:1 antiparallel complex of distamycin with DNA (PDB 378D) and a schematic of distamycin binding to the minor groove in the 2:1 mode.
methylimidazole and 3-hydroxy-1-methylpyrrole (Hp) heterocycles. The side-by-side pairing of these monomers in the minor groove governs which base is preferentially recognized (Figure 1.5). An Im/Py pair preferentially recognizes a G•C base pair over C•G, A•T, and T•A, while Py/Im recognizes C•G. This preference exists due to the relief of the steric hindrance between the hydrogen at the C3 position of pyrrole and the guanine exocyclic amine provided by the substitution of imidazole. Hp/Py preferentially recognizes a T•A base pair over A•T, C•G, and G•C, while Py/Hp recognizes A•T. Specificity for T•A over A•T is likely due to steric accommodation of the exocyclic hydroxyl group on Hp. Another heterocycle that has been used to distinguish T•A over A•T is 3-chlorothiophene when paired across a Py (28). As with the 2:1 distamycin configuration, Py/Py pairs recognize A•T and T•A base pairs over G•C and C•G.
which also show improvements to affinity (30,31). Another feature of current generation Py-Im polyamides is the conjugation of isophthalic acid to the C-terminus linked by 3,3’-diamino-N-methyldipropylamine. This C-terminus tail aids in the uptake of polyamides into live cells (32). Uptake into the nucleus of live cells was demonstrated by conjugating fluorescein to the terminus linker (33). The 3,3’-diamino-N-methyldipropylamine C-terminus linker also shows preferential binding for A•T and T•A base pairs. Therefore, currently used eight-ring hairpin Py-Im polyamides are capable of recognizing a specific six base pair sequence.
Figure 1.5 Molecular recognition of DNA by Py-Im polyamides. (A) Schematic of Py-Im polyamide targeted to 5’-WGWWCW-3’ binding to the minor groove. (B) Chemical structures of monomers found in polyamides and their ball-and-stick representations. Abbreviation for each monomer is also listed. (C) Ball-and-stick representation of the Py-Im polyamide in (A) bound to its cognate DNA sequence.
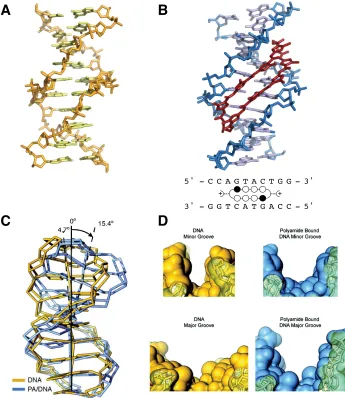
Features of the current generation Py-Im polyamide and its effects on DNA can be observed in the crystal structure of a macrocyclic eight-ring Py-Im polyamide bound to DNA (Figure 1.6) (34). Polyamide binding induces widening of the minor groove and narrowing of the major groove, as observed in the distamycin 2:1 structure (Figure 1.4),
+
5' - C C A G T A C T G G - 3'
3' - G G T C A T G A C C - 5'
A
B
C
D
+
Figure 1.6 Py-Im polyamide binding alters the structure of DNA. (A) Native DNA crystal structure at 0.98 Å resolution (PDB 1D8G) (B) DNA/polyamide co-crystal structure at 0.95 Å resolution (PDB 3OMJ), ball-and-stick model of polyamide bound to DNA (C) Significant DNA bending is observed for polyamide-bound DNA (blue) versus unbound DNA (yellow). (D) Top: comparison of the minor-groove width for DNA in the absence of polyamide (yellow) and in the presence of bound polyamide (blue). Bottom: Comparison of the major-groove widths.
as well as bending of the helix. This structure demonstrates how polyamides can act allosterically to inhibit binding of transcription factors and other DNA-binding proteins (34). Structural studies have also shown that polyamides can bind to DNA in a reconstituted nucleosomal core particle (35), suggesting that they are capable of binding to chromatin. The unique properties of these cell-permeable, sequence-specific, high affinity DNA-binding small molecules make them an attractive candidate for modulation of dysregualted gene expression in disease states.
1.4 Biological activity of pyrrole-imidazole polyamides
treatment was shown to downregulate 182 transcripts out of 650 induced transcipts, and in total the expression of ~1200 transcripts were affected.
Evidence that Py-Im polyamides are biologically active and potent in cell culture led to the investigations of polyamide effects in human tumor xenografts grown in mice. The first milestone was the demonstration that polyamides are able to circulate in a healthy mouse and have favorable pharmacokinetics (Figure 1.7C) (40-42). Py-Im polyamides were also shown to accumulate into tumors and modulate gene expression, as observed in cell culture (43-45). Interestingly, investigations of polyamide biodistribution
Figure 1.7 Examples of polyamide biological activities in tissue culture and animal studies. (A) A Py-Im polyamide targeted to the HIF response element (HRE) was able to downregulate vegf expression and reduce occupancy of HIf-1 at the vegf promoter (36). (B) A Py-Im polyamide targeted to the androgen response element (ARE) was able to downregulate klk3 expression and reduce occupancy of AR at the klk3 promoter and enhancer (38). (C) Py-Im polyamides injected into C57BL/6 mice were able to circulate for hours in the blood. Polyamide plasma levels varied with the architecture of the molecules (40).
in healthy mice showed showed measurable polyamide levels in all tissues except brain (46). Importantly, ARE-targeted polyamides were able to reduce the growth of human prostate cancer xenografts with favorable animal toxicity profiles (47,48).
Another potential mechanism investigated to explain the non-specific effects of polyamides was inhibition of topoisomerases (52). Topoisomerases are enzymes that bind to DNA and introduce single- or double-strand breaks in DNA to relieve helical torsion that occurs during DNA replication and transcription (53). Many natural products exert their toxic effects through inhibition of topoisomerases (15). In vitro experiments showed that ARE-targeted polyamides inhibit Top2α-catalyzed relaxation of a super-coiled plasmid in vitro, and that the likely mechanism is through inhibition of Top2α binding to DNA. Knockdown of Top2α in hormone-insensitive prostate cancer cells also conferred resistance to polyamide treatment. Inhibition of RNA Pol II elongation and inhibition of topoisomerase DNA binding are two potential mechanisms of non-specific polyamide effects and cytotoxicity, but there are other critical DNA-dependent processes to explore as well.
1.5 Small Molecule Inhibitors of DNA replication
primase, and single-stranded binding protein. Inhibition of any of these factors will disrupt DNA replication. Even prior to replication initiation, inhibition of the any of the factors that are needed to begin DNA replication will prevent the process from moving forward. Damage to the DNA template itself by DNA base adducts can also prevent translocation of the replisome.
1.6 Scope of this work
The work presented in this thesis is primarily focused on elucidating the effects of Py-Im polyamides on DNA replication, and explores how mammalian cells respond to the unique stress exerted by these molecules. In Chapter 2, we present data demonstrating that androgen response element (ARE)-targeted polyamides inhibit DNA replication in
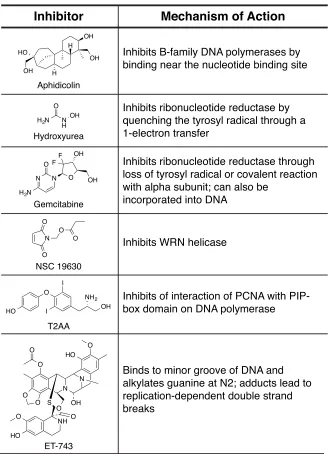
HO quenching the tyrosyl radical through a 1-electron transfer
Inhibits ribonucleotide reductase through loss of tyrosyl radical or covalent reaction with alpha subunit; can also be
incorporated into DNA
Inhibits WRN helicase
Inhibits of interaction of PCNA with PIP- box domain on DNA polymerase
Binds to minor groove of DNA and alkylates guanine at N2; adducts lead to replication-dependent double strand
Table 1.1 Structures and putative mechanisms of a library of small molecule DNA replication inhibitors (55-61).
1.7 References
1. Avery, O.T., Macleod, C.M. and McCarty, M. (1944) Studies on the Chemical Nature of the Substance Inducing Transformation of Pneumococcal Types : Induction of Transformation by a Desoxyribonucleic Acid Fraction Isolated from Pneumococcus Type Iii. J Exp Med, 79, 137-158.
2. Watson, J.D. and Crick, F.H. (1953) Genetical implications of the structure of deoxyribonucleic acid. Nature, 171, 964-967.
3. Watson, J.D. and Crick, F.H. (1953) Molecular structure of nucleic acids; a structure for deoxyribose nucleic acid. Nature, 171, 737-738.
4. Drew, H.R., Wing, R.M., Takano, T., Broka, C., Tanaka, S., Itakura, K. and Dickerson, R.E. (1981) Structure of a B-DNA dodecamer: conformation and dynamics. Proc Natl Acad Sci U S A, 78, 2179-2183.
5. Lander, E.S., Linton, L.M., Birren, B., Nusbaum, C., Zody, M.C., Baldwin, J., Devon, K., Dewar, K., Doyle, M., FitzHugh, W. et al. (2001) Initial sequencing and analysis of the human genome. Nature, 409, 860-921.
6. Ezkurdia, I., Juan, D., Rodriguez, J.M., Frankish, A., Diekhans, M., Harrow, J., Vazquez, J., Valencia, A. and Tress, M.L. (2014) Multiple evidence strands suggest that there may be as few as 19,000 human protein-coding genes. Hum Mol Genet, 23, 5866-5878.
7. Harrow, J., Frankish, A., Gonzalez, J.M., Tapanari, E., Diekhans, M., Kokocinski, F., Aken, B.L., Barrell, D., Zadissa, A., Searle, S. et al. (2012) GENCODE: the reference human genome annotation for The ENCODE Project. Genome Res, 22, 1760-1774.
8. Chu, Q., Ma, J. and Saghatelian, A. (2015) Identification and characterization of sORF-encoded polypeptides. Crit Rev Biochem Mol Biol, 50, 134-141.
9. Nalefski, E.A., Nebelitsky, E., Lloyd, J.A. and Gullans, S.R. (2006) Single-molecule detection of transcription factor binding to DNA in real time: specificity, equilibrium, and kinetic parameters. Biochemistry, 45, 13794-13806. 10. Panne, D., Maniatis, T. and Harrison, S.C. (2007) An atomic model of the
interferon-beta enhanceosome. Cell, 129, 1111-1123.
11. Naar, A.M., Lemon, B.D. and Tjian, R. (2001) Transcriptional coactivator complexes. Annu Rev Biochem, 70, 475-501.
13. Juo, Z.S., Chiu, T.K., Leiberman, P.M., Baikalov, I., Berk, A.J. and Dickerson, R.E. (1996) How proteins recognize the TATA box. J Mol Biol, 261, 239-254. 14. Nair, S.K. and Burley, S.K. (2003) X-ray structures of Myc-Max and Mad-Max
recognizing DNA. Molecular bases of regulation by proto-oncogenic transcription factors. Cell, 112, 193-205.
15. Tse, W.C. and Boger, D.L. (2004) Sequence-selective DNA recognition: natural products and nature's lessons. Chem Biol, 11, 1607-1617.
16. Gurova, K. (2009) New hopes from old drugs: revisiting DNA-binding small molecules as anticancer agents. Future Oncol, 5, 1685-1704.
17. Bensaude, O. (2011) Inhibiting eukaryotic transcription: Which compound to choose? How to evaluate its activity? Transcription, 2, 103-108.
18. Horikawa, S., Sakata, K., Uchiumi, F., Hatanaka, M. and Tsukada, K. (1987) Effect of actinomycin D on DNA replication and c-myc expression during rat liver regeneration. Biochem Biophys Res Commun, 144, 1049-1054.
19. Zimmer, C., Puschendorf, B., Grunicke, H., Chandra, P. and Venner, H. (1971) Influence of netropsin and distamycin A on the secondary structure and template activity of DNA. Eur J Biochem, 21, 269-278.
20. Beerman, T.A., McHugh, M.M., Sigmund, R., Lown, J.W., Rao, K.E. and Bathini, Y. (1992) Effects of analogs of the DNA minor groove binder Hoechst 33258 on topoisomerase II and I mediated activities. Biochim Biophys Acta, 1131, 53-61.
21. Brosh, R.M., Jr., Karow, J.K., White, E.J., Shaw, N.D., Hickson, I.D. and Bohr, V.A. (2000) Potent inhibition of werner and bloom helicases by DNA minor groove binding drugs. Nucleic Acids Res, 28, 2420-2430.
22. Coll, M., Frederick, C.A., Wang, A.H. and Rich, A. (1987) A bifurcated hydrogen-bonded conformation in the d(A.T) base pairs of the DNA dodecamer d(CGCAAATTTGCG) and its complex with distamycin. Proc Natl Acad Sci U S A, 84, 8385-8389.
23. Mitra, S.N., Wahl, M.C. and Sundaralingam, M. (1999) Structure of the side-by-side binding of distamycin to d(GTATATAC)2. Acta Crystallogr D Biol Crystallogr, 55, 602-609.
25. Kopka, M.L., Yoon, C., Goodsell, D., Pjura, P. and Dickerson, R.E. (1985) The molecular origin of DNA-drug specificity in netropsin and distamycin. Proc Natl Acad Sci U S A, 82, 1376-1380.
26. White, S., Szewczyk, J.W., Turner, J.M., Baird, E.E. and Dervan, P.B. (1998) Recognition of the four Watson-Crick base pairs in the DNA minor groove by synthetic ligands. Nature, 391, 468-471.
27. Hsu, C.F., Phillips, J.W., Trauger, J.W., Farkas, M.E., Belitsky, J.M., Heckel, A., Olenyuk, B.Z., Puckett, J.W., Wang, C.C. and Dervan, P.B. (2007) Completion of a Programmable DNA-Binding Small Molecule Library. Tetrahedron, 63, 6146-6151.
28. Foister, S., Marques, M.A., Doss, R.M. and Dervan, P.B. (2003) Shape selective recognition of T.A base pairs by hairpin polyamides containing N-terminal 3-methoxy (and 3-chloro) thiophene residues. Bioorg Med Chem, 11, 4333-4340. 29. Herman, D.M., Turner, J.M., Baird, E.E. and Dervan, P.B. (1999) Cycle generation hairpin polyamides with (R)-3,4-diaminobutyric acid turn unit. J Am Chem Soc, 130, 6859-6866.
32. Nickols, N.G., Jacobs, C.S., Farkas, M.E. and Dervan, P.B. (2007) Improved nuclear localization of DNA-binding polyamides. Nucleic Acids Res, 35, 363-370. 33. Best, T.P., Edelson, B.S., Nickols, N.G. and Dervan, P.B. (2003) Nuclear localization of pyrrole-imidazole polyamide-fluorescein conjugates in cell culture. Proc Natl Acad Sci U S A, 100, 12063-12068.
37. Olenyuk, B.Z., Zhang, G.J., Klco, J.M., Nickols, N.G., Kaelin, W.G., Jr. and Dervan, P.B. (2004) Inhibition of vascular endothelial growth factor with a sequence-specific hypoxia response element antagonist. Proc Natl Acad Sci U S A, 101, 16768-16773.
38. Nickols, N.G. and Dervan, P.B. (2007) Suppression of androgen receptor-mediated gene expression by a sequence-specific DNA-binding polyamide. Proc Natl Acad Sci U S A, 104, 10418-10423.
39. Raskatov, J.A., Meier, J.L., Puckett, J.W., Yang, F., Ramakrishnan, P. and Dervan, P.B. (2012) Modulation of NF-kappaB-dependent gene transcription using programmable DNA minor groove binders. Proc Natl Acad Sci U S A, 109, 1023-1028.
40. Raskatov, J.A., Hargrove, A.E., So, A.Y. and Dervan, P.B. (2012) Pharmacokinetics of Py-Im polyamides depend on architecture: cyclic versus linear. J Am Chem Soc, 134, 7995-7999.
41. Harki, D.A., Satyamurthy, N., Stout, D.B., Phelps, M.E. and Dervan, P.B. (2008) In vivo imaging of pyrrole-imidazole polyamides with positron emission tomography. Proc Natl Acad Sci U S A, 105, 13039-13044.
42. Synold, T.W., Xi, B., Wu, J., Yen, Y., Li, B.C., Yang, F., Phillips, J.W., Nickols, N.G. and Dervan, P.B. (2012) Single-dose pharmacokinetic and toxicity analysis of pyrrole-imidazole polyamides in mice. Cancer Chemother Pharmacol, 70, 617-625.
43. Raskatov, J.A., Nickols, N.G., Hargrove, A.E., Marinov, G.K., Wold, B. and Dervan, P.B. (2012) Gene expression changes in a tumor xenograft by a pyrrole-imidazole polyamide. Proc Natl Acad Sci U S A, 109, 16041-16045.
44. Nickols, N.G., Szablowski, J.O., Hargrove, A.E., Li, B.C., Raskatov, J.A. and Dervan, P.B. (2013) Activity of a Py-Im polyamide targeted to the estrogen response element. Mol Cancer Ther, 12, 675-684.
45. Raskatov, J.A., Puckett, J.W. and Dervan, P.B. (2014) A C-14 labeled Py-Im polyamide localizes to a subcutaneous prostate cancer tumor. Bioorg Med Chem, 22, 4371-4375.
46. Raskatov, J.A., Szablowski, J.O. and Dervan, P.B. (2014) Tumor xenograft uptake of a pyrrole-imidazole (Py-Im) polyamide varies as a function of cell line grafted. J Med Chem, 57, 8471-8476.
48. Yang, F., Nickols, N.G., Li, B.C., Szablowski, J.O., Hamilton, S.R., Meier, J.L., Wang, C.M. and Dervan, P.B. (2013) Animal toxicity of hairpin pyrrole-imidazole polyamides varies with the turn unit. J Med Chem, 56, 7449-7457. 49. Muzikar, K.A., Nickols, N.G. and Dervan, P.B. (2009) Repression of
DNA-binding dependent glucocorticoid receptor-mediated gene expression. Proc Natl Acad Sci U S A, 106, 16598-16603.
50. Mote, J., Ghanouni, P. and Reines, D. (1994) A DNA Minor Groove-Binding Ligand Both Potentiates and Arrests Transcription by Rna-Polymerase-Ii - Elongation-Factor Sii Enables Readthrough at Arrest Sites. Journal of Molecular Biology, 236, 725-737.
51. Sobell, H.M. (1985) Actinomycin and DNA-Transcription. P Natl Acad Sci USA, 82, 5328-5331.
52. Phillips, J.W. (2011). PhD Thesis, California Institute of Technology.
53. Durand-Dubief, M., Svensson, J.P., Persson, J. and Ekwall, K. (2011) Topoisomerases, chromatin and transcription termination. Transcription, 2, 66-70. 54. Masai, H., Matsumoto, S., You, Z.Y., Yoshizawa-Sugata, N. and Oda, M. (2010) Eukaryotic Chromosome DNA Replication: Where, When and How? Annual Review of Biochemistry, Vol 79, 79, 89-130.
55. Baranovskiy, A.G., Babayeva, N.D., Suwa, Y., Gu, J., Pavlov, Y.I. and Tahirov, T.H. (2014) Structural basis for inhibition of DNA replication by aphidicolin. Nucleic Acids Res, 42, 14013-14021.
56. Lassmann, G., Thelander, L. and Graslund, A. (1992) EPR stopped-flow studies of the reaction of the tyrosyl radical of protein R2 from ribonucleotide reductase with hydroxyurea. Biochem Biophys Res Commun, 188, 879-887.
57. Artin, E., Wang, J., Lohman, G.J.S., Yokoyama, K., Yu, G.X., Griffin, R.G., Bar, G. and Stubbe, J. (2009) Insight into the Mechanism of Inactivation of Ribonucleotide Reductase by Gemcitabine 5 '-Diphosphate in the Presence or Absence of Reductant. Biochemistry, 48, 11622-11629.
58. Gowda, A.S.P., Polizzi, J.M., Eckert, K.A. and Spratt, T.E. (2010) Incorporation of Gemcitabine and Cytarabine into DNA by DNA Polymerase beta and Ligase III/XRCC1. Biochemistry, 49, 4833-4840.
60. Punchihewa, C., Inoue, A., Hishiki, A., Fujikawa, Y., Connelly, M., Evison, B., Shao, Y.M., Heath, R., Kuraoka, I., Rodrigues, P. et al. (2012) Identification of Small Molecule Proliferating Cell Nuclear Antigen (PCNA) Inhibitor That Disrupts Interactions with PIP-box Proteins and Inhibits DNA Replication. Journal of Biological Chemistry, 287, 14289-14300.
Chapter 2
Replication Stress by Py–Im Polyamides
Induces a Non-canonical ATR-dependent Checkpoint Response
The text of this chapter was taken in part from a manuscript co-authored with John W. Phillips, Kenneth K. Karanja, Piotr Polazcek, Chieh-Mei Wang, Benjamin C. Li, Judith L. Campbell, and Peter B. Dervan (California Institute of Technology)
Abstract
2.1 Introduction
Py-Im polyamides are programmable small molecules that bind in the minor groove of double-stranded DNA with affinities and specificities comparable to DNA-binding proteins (7,8). Binding of the polyamides alters the local helical structure of DNA (9). Eight-ring hairpin polyamides are cell-permeable and localize to the nucleus in live cells (10). Py-Im Polyamides are derived from the natural products distamycin A and netropsin (11). Distamycin A is cytotoxic at relatively high concentrations (12), and inhibits the activity of RNA polymerase, DNA polymerase, topoisomerases I and II, and helicases (13-15). Previously, we showed that hairpin Py-Im polyamides designed to bind the androgen response element (ARE) decrease the expression of prostate cancer related genes, inhibit RNA polymerase activity, upregulate p53, and induce apoptosis (16,17). Curiously, no evidence of DNA breaks, which usually occurs upon treatment with DNA damaging agents such as doxorubicin, was observed. However, effects on replication remain to be investigated.
DNA-binding. These results demonstrate that polyamides are capable of imposing replication stress and can activate both a non-canonical Chk1-independent ATR-checkpoint response and the FA/BRCA pathway, resulting in S-phase delay.
2.2 Results
Py-Im polyamides cause accumulation of S-phase cells and PCNA foci.
Hairpin Py-Im Polyamides 1 and 2 were designed to target the ARE (5’-GGTACANNNTGTTCT-3’ (18)) and antagonize gene expression changes driven by the androgen receptor (AR) in the prostate cancer cell line, LNCaP (Figure 1A and B) (16,19). In LNCaP cells, AR signaling plays a critical role in cell proliferation (20), and therefore disruption of AR-dependent signaling may contribute to cell death. However, disruption of other DNA-dependent processes such as RNA pol II transcription elongation may also cause cell death. To investigate the effects of polyamides outside of AR-dependent transcription, we first compared the cytotoxicity of polyamides 1 and 2 in three different prostate cancer cell lines, LNCaP, LNAR, and DU145, which express high, normal, and low levels of AR, respectively. Polyamides 1 and 2 displayed dose-dependent cytotoxicity at 72 and 96 h as measured by sulfarhodamine B staining (Table 2.1). Polyamide 2 had approximately ten-fold higher potency than polyamide 1, which is consistent with its greater potency against AR-driven gene expression (19). Importantly, the IC50 values were similar in all cell lines regardless of AR status, suggesting that the
minimally expressed (21). Therefore, DU145 cells provide an environment to investigate the effects of polyamides 1 and 2 independent of AR-signaling.
Next, we examined the effects of polyamides 1 and 2 on the cell cycle in DU145 cells. We pulse-labeled exponentially growing and asynchronous DU145 cells with ethynyldeoxyuridine (EdU) after 24 h of polyamide treatment. Both polyamides produced a dose-dependent increase in the percentage of cells in S-phase, with a corresponding drop in the percentage of G0/G1 cells (Figure 1C). Although more cells were in S-phase, the average intensity of EdU staining decreased, suggesting that the treated cells were replicating their DNA more slowly and thus cells spent longer in S-phase (Figure 1D). Similar results were also obtained using traditional one-color flow cytometry to determine the cell cycle distribution after 48 h of polyamide treatment (Figure 1E).
We then determined whether replication/repair foci accumulated in the treated cells using PCNA immunofluorescence (22,23). We chose treatment conditions to allow for maximal effect on the cells before any significant decrease in viability or activation of
apoptosis, as measured by mitochondrial reduction activity and caspase 3/7 activation (Figure 2.2). Nearly all DMSO treated cells showed 0-2 foci per cell, while polyamide treatment resulted in a significant increase in cells with greater than 20 foci (Figure 1F and G). Interestingly, some of the polyamide-treated cells but none of the DMSO-treated cells showed more than 50 foci. Observation of cells with such high incidence of foci suggests that polyamides cause prolonged stalling of replication forks and the recruitment of repair machinery (22).
Py-Im Polyamide treatment induces ATR activation.
S-phase accumulation subsequent to treatment with a DNA-binding compound was suggestive of checkpoint activation in response to replication stress. We therefore
Figure 2.2 Polyamides induce apoptosis in DU145 cells. (A) Cell viability assay. Cells were treated in quadruplicate with polyamide 1 (top) or polyamide 2 (bottom) for range of concentrations (µM) for up to 96 h and then assayed for bioreductive capacity with WST-1 reagent. The data are normalized to the untreated condition. (B) Caspase 3/7 activity assay. Cells were treated in triplicate with polyamide 1 (top) or polyamide 2 (bottom) for the indicated time and then homogenized in guanidinium lysis buffer containing a pro-luminescent Caspase 3/7 substrate. The data are normalized to the untreated condition. (C) ELISA for cleaved PARP formation. Cells were treated with polyamides for 72 h. before assaying the lysates by sandwich ELISA using an HRP-conjugated secondary antibody and a chromogenic substrate. The data are presented as the background-corrected absorbance values at 450 nm. Error bars represent the mean ± S.D. of experiments conducted in triplicate or quadruplicate.
B C
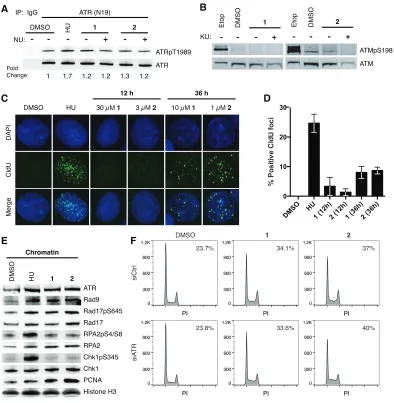
probed for activation of the master regulator kinases, ATR and ATM. We assayed ATR activation by immunoblotting for T1989 phosphorylation, an autophosphorylation site that has been implicated in ATR activation and a robust checkpoint response (24,25). Cells treated with polyamide 1 or 2 showed a slight increase in ATR T1989 phosphorylation relative to DMSO treated cells (Figure 2.3A). However, cells treated with hydroxyurea (HU), which causes nucleotide depletion, showed greater ATR T1989 phosphorylation compared to polyamide-treated cells suggesting a weaker activation of ATR by polyamides. NU6027, which inhibits cellular ATR but not ATM, did not abrogate T1989 phosphorylation under polyamide treatment (26). While polyamide treatment appeared to activate ATR, polyamides did not induce ATM S1981 phosphorylation, an autophosphorylation site that has been associated with ATM activation and stabilization at DSBs (Figure 2.3B) (27).
Figure 2.3 Polyamides induce ATR activation without extensive ssDNA formation. (A) Immunoblot of ATRpT1989 and ATR following IP of ATR in DU145 whole cell lysates treated with 4 mM hydroxyurea (HU) for 2 h, and DMSO, 10 µM polyamide 1, or 1 µM polyamide 2 in the presence or absence of 10 µM NU6027 (NU, ATR inhibitor) for 36 h. (B) Immunoblots of ATMpS1981 and ATM after treatment with 30 µM etoposide (Etop) for 30 min, and DMSO, 10 µM polyamide 1, or 1 µM polyamide 2 in the presence or absence of 10 µM KU55933 (KU, ATM inhibitor) for 36 h. (C) Representative images of ssDNA formation via CldU immunofluorescence under non-denaturing conditions are shown for cells after treatment with 4 mM HU for 2 h, DMSO, 30 µM polyamide 1, or 3 µM polyamide 2 for 12 h, and 10 µM polyamide 1 or 1 µM polyamide 2 for 36 h. (D) Bar graphs of the mean and standard deviation of percent CldU positive cells (>10 foci/cell). 150 cells over three replicates were counted for each condition. (E) Immunoblots of ATR and checkpoint related factors loaded onto chromatin upon treatment with 10 mM HU for 2 h, and DMSO, 10 µM polyamide 1, or 1 µM polyamide 2 for 36
DMSO HU1 (12h)2 (12h)1 (36h)2 (36h)
treatment the number of CldU foci was substantially lower than in HU treated cells. Thus, the degree of ssDNA formation in polyamide treated cells was also lower than in HU treated cells, consistent with the lower levels of T1989 phosphorylation observed.
To confirm ATR activation, we determined if ATR and mediators of the ATR response accumulate on chromatin after polyamide treatment. Polyamide treatment resulted in ATR loading onto chromatin (Figure 2.3E). Interestingly, although we had observed a lower level of ATR phosphorylation in polyamide treated cells than in HU treated cells (Figure 2.3A), similar amounts of ATR were loaded onto chromatin following each treatment. Polyamide treatment also induced loading of RPA, the Rad9-Rad1-Hus1 (9-1-1) complex, which is integral to ATR checkpoint signaling, and Rad17, which is part of the clamp loader that facilitates 9-1-1 loading, to similar levels as did HU. Rad17 S645, a target for ATR phosphorylation that is necessary for G2 checkpoint activation (28), was phosphorylated in the presence of polyamide, indicating that ATR was activated. Polyamide treatment also induced higher PCNA loading on chromatin, which is consistent with the high incidence of PCNA foci formation (Figure 2.1D). Despite the lack of extensive ssDNA formation, ATR as well as its mediators are recruited to chromatin and ATR is active after polyamide treatment.
Py-Im Polyamide-induced S-phase delay is not abrogated by ATR knockdown.
siRNA against ATR or negative control siRNA prior to treatment with polyamide 1 or 2
(Figure 2.3F). This suggests that ATR activity is not contributing to S-phase accumulation. Whencaffeine, a PI3 kinase inhibitor with preference for ATR over ATM, was added to cells in addition to polyamide 1 or 2, the S-phase population was reduced compared to cells treated only with polyamide; however, caffeine treatment also reduces the basal level of S-phase cells and may account for this decrease (Figure 2.4). Similarly, when the ATR inhibitor NU6027 was added to cells the S-phase population was reduced under both the basal and polyamide-treated conditions.
Although ATM S1981 was not phosphorylated in response to polyamide treatment, ATM autophosphorylation sites other than S1981 have been implicated in its activation and function in the cell cycle checkpoint (29). Therefore the effects of ATM inhibition were also monitored. KU55933, a selective inhibitor of ATM, did not diminish the polyamide induced S-phase accumulation (Figure 2.4) (30).
Figure 2.4 Effects of small molecule PI3-kinase inhibitors on polyamide-induced S-phase accumulation. Cell cycle distribution of DU145 cells after 36 h treatment with DMSO, 10 µM polyamide 1, or 1 µM polyamide 2 in the presence of 2 mM caffeine, 10 µM KU55933 (KU, ATM inhibitor), or 10 µM NU6027 (NU, ATR inhibitor) as measured by single-color flow cytometric evaluation of propidium iodide stained cells. When both KU and NU were added together with DMSO or polyamide, only 4 µM of each inhibitor was used to reduce toxicity.
Py-Im Polyamide treatment does not induce Chk1, RPA2, or Chk2 phosphorylation.
Figure 2.5 High concentration polyamide treatment does not does not inhibit aphidicolin-induced Chk1 phosphorylation. (A) Immunoblot of Chk1pS345 after the treatment with polyamides followed by aphidicolin. DU145 cells were treated with DMSO, 10 µM polyamide 1, or 1 µM polyamide 2 followed by the addition of 10 µg/mL aphidicolin (Aph) after 24 h. Cells were harvested after 36 h total incubation. (B) Immunoblot of Chk1pS345 after simultaneous treatment of DMSO or 3 µM polyamide 2 plus 10 µg/mL aph for 12 or 24 h. (C) Immunoblot of S-phase checkpoint and DNA damage response proteins, Chk1pS345, RPA2pS4/8, Chk2pT68, and γ -H2AX in DU145 cells after 18 h treatment with DMSO, 30 µM etoposide, polyamide 1, or polyamide 2 at the indicated concentrations.
concentration polyamide treatment for 18 h and similar results were observed (Figure 2.5C).
Py-Im polyamide treatment does not induce DNA breakage.
The absence of ATM, Chk2, and RPA2 phosphorylation suggested that polyamide-induced replication stress does not lead to gross breakage of DNA. To study DNA breakage directly, we treated cells with polyamides and then analyzed them by single cell alkaline gel electrophoresis (Figure 2.6B). Migration of the DNA from the centroid into the ‘comet tail’ is proportional to the amount of single- and double-strand breakage that has occurred. Cells treated with doxorubicin, a known DNA-damaging agent, were used as a positive control and showed a median value of 41% of total DNA in the tail. Polyamide-treated cells, however, were similar to the DMSO control with median %DNA in tail values of 8 and 10 for polyamides 1 and 2, respectively, compared to 6% for DMSO. The lack of extensive DNA breakage correlates with the absence of ATM-Chk2 activation.
Py-Im Polyamide treatment induces MCM2 phosphorylation and monoubiquitination of
FANCD2, a major gatekeeper of the FA/BRCA Repair Pathway.
polyamide 1 or 2 resulted in a time-dependent increase of MCM2 S108 phosphorylation (Figure 2.7A). The level of MCM2 phosphorylation observed after 36 h polyamide treatment was similar to that observed after 2 h HU treatment. Polyamide-induced
MCM2 S108 phosphorylation was also inhibited by co-treatment with caffeine (Figure 2.7B). To determine the contribution of ATR to MCM2 phosphorylation, ATR was knocked down using siRNA prior to polyamide treatment, and similar levels of inhibition were observed as under caffeine treatment (Figure 2.7C). We also investigated the contributions of ATR and ATM to MCM2 phosphorylation using the small molecule kinase inhibitors NU6027 and KU55933. Both inhibitors reduced MCM2 phosphorylation levels induced by HU or polyamide, with a stronger effect from NU6027 (Figure 2.8A). Together, these observations suggest that ATR is the predominant mediator of polyamide-induced MCM2 phosphorylation.
Figure 2.8 Effects of ATM- and ATR-specific small molecule inhibtors on polyamide-induced MCM2 S108 phosphorylation and FANCD2 monoubiquitination. (A) MCM2 S108 phosphorylation levels were measured in DU145 cells treated with 4 mM HU for 2 h, and DMSO, 10 µM polyamide 1 or 1 µM polyamide 2 for 36 h in addition to 10 µM KU55933 (KU, ATM inhibitor), 10 µM NU6027 (NU, ATR inhibitor), or both KU and NU. Only 4 µM KU and 4 µM NU were used when both inhibitors were added together to reduce toxicity. (B) FANCD2-Ub levels were measured in selective kinase inhibitor-containing lysates. Monoubiquitination was estimated by normalizing the band intensity of the large molecular weight monoubiquitinated FANCD2 band (FANCD2-L) to the low molecular weight non-ubiquitinated FANCD2 band (FANCD2-S).
fraction of FANCD2-Ub in response to polyamide treatment (Figure 2.8B). These results may be unique to DU145 cells, as ATR knockdown by siRNA has been shown to abrogate FANCD2 ubiquitination in the presence of high levels of replication fork damage caused by 12 h treatment of HU or mitomycin C (MMC) in U2OS cells (43). The ATM inhibitor KU55933 similarly increased FANCD2-Ub levels when co-treated with polyamides, though this result is consistent with previous studies (Figure 2.8B) (44).
Next, we confirmed the functional role of FANCD2 in resisting the toxic effects of polyamides in a model outside of prostate cancer. The FANCD2 deficient fibroblast cell line PD20 complemented with an empty vector exhibited greater sensitivity to
Figure 2.9 FANCD2 increases cell survival after exposure to polyamide 1. PD20 cells complemented with empty vector (PD20-EV) or FANCD2 (PD20-FANCD2) were treated with the indicated concentrations of polyamide 1 for 36h and assayed for survival after 14 days. Error bars indicate mean ± SEM for n=3 independent experiments. Unpaired T-tests were performed at *P<0.05.
polyamide treatment than PD20 cells complemented with a FANCD2-expressing vector (Figure 2.9). Together, these data support the conclusion that MCM2 and FANCD2 participate in the response to polyamide-induced replication stress in addition to ATR.
We also tested whether FANCD2 participated in the S-phase accumulation observed in response to polyamide treatment. Similar to Figure 2.3F, we tested whether knockdown of FANCD2 by siRNA prior to the addition of polyamides 1 or 2 would prevent cells from accumulating in S-phase (Figure 2.10). Knockdown of FANCD2 did not prevent cells from accumulating in S-phase, therefore suggesting that its role in the stress response is not necessarily to activate the intra-S-phase checkpoint to prevent cells from entering G2.
100
10
10 10 20 30
PD20-EV PD20-FANCD2
Percent Survival
1 (μM)
*
*
*
Figure 2.10 Knockdown of FANCD2 by siRNA does not prevent the accumulation of DU145 cells in S-phase in response to polyamide treatment. (A) Immunoblot depicting the knockdown of FANCD2 by treatment with 25 nM siRNA for 48 h. (B) DNA histograms of propidium iodide (PI) stained DU145 cells after treatment with negative control or ATR-targeting siRNA for 48 h followed by treatment with DMSO, 10 µM polyamide 1, or 1 µM polyamide 2 for 36 h. The percentage of cells in S-phase is included at the top right of each graph.
Polyamide 1 inhibits T7 gp4A helicase activities in vitro.
replicative helicase (45). We followed unwinding of a forked duplex DNA substrate containing either a single match site or no match sites for polyamide 1 by gel electrophoresis (45). Helicase inhibition was measured by the percent of unwound substrate relative to the mock treated sample. Incubating polyamide 1 with the substrate containing the match site resulted in effective inhibition of gp4A helicase activity (IC50 ~
5nM) (Figure 2.12A, top). The polyamide was still able to inhibit gp4A helicase activity on the mismatch substrate but required significantly higher concentrations of polyamide (IC50 ~ 335 nM), owing to the sequence specificity of polyamides (Figure 2.12A,
bottom). Similar results were also obtained when using a different class of helicase, S. cerevisiae Dna2 (Figure 2.13). These results suggest that the polyamide is not directly interacting with the helicases but acts through DNA binding.
The sequence specific non-covalent binding nature of polyamides led us to hypothesize that helicase inhibition would not only be stronger at a given concentration when comparing the match to the mismatch substrate but that the enzyme would also show slower unwinding kinetics given the polyamide’s longer dwell time at a match site.
Figure 2.11 Py-Im Polyamides stabilize duplex DNA regardless of match site position in the duplex. DMSO or 4 µM polyamide was incubated with 2 µM 14 bp duplex DNA containing only a single 5’-WGWWCW-3’ binding site positioned either 4 bps (A), 2 bps (B), or 1 bp (C) from the edge and a melting curve was measured using DNA hyperchromicity (46). The average melting temperature and standard deviation were calculated from four replicates.
Figure 2.12 Polyamide 1 inhibits T7 gp4A helicase activity. (A) Inhibition of T7 gp4A by polyamide 1 was tested using a forked DNA duplex containing a single match-binding site (top) or no match-binding site (bottom). 32P is represented in the cartoon by the red asterisk. Polyamide
1 was added in increasing concentrations (lanes 4-15): 100 pM, 300 pM, 1 nM, 3 nM, 10 nM, 30 nM, 100 nM, 300 nM, 1 µM, 3 µM, 10 µM. (B) Graphical representation of gp4A inhibition curves. (C) Inhibition of gp4A was then assessed in the time domain by incubating the helicase reactions for increasing amounts of time with either the (left) matched or (right) mismatched substrate.
When using the match substrate, gp4A was unable to unwind as much substrate in the presence of polyamide as the mock treated sample even when allowed to incubate for longer times (Figure 2.12C, left). However, gp4A was capable of unwinding the same amount of mismatch substrate in the presence of polyamide as the mock treated sample
A
C
Time (min)
Match Fork Mismatch Fork
B
1 [M] T7 gp4A Inhibition
when allowed to incubate longer (Figure 2.12C, right). These data support helicase inhibition as one explanation for how polyamides cause replication stress.
2.3 Discussion
Figure 2.13 Polyamide 1 inhibits helicase activity of S. cerevisiae Dna2 nuclease dead but helicase active mutant (yDna2-K677R). Inhibition of yDna2-K677R by polyamide 1 was tested using a forked DNA duplex containing either one match-binding site (A) or no match-binding site (B). 32P is represented in the cartoon of the substrate by the red asterisk. Polyamide 1 was added in increasing concentrations (lanes 4-14): 100 pM, 300 pM, 1 nM, 3 nM, 10 nM, 30 nM, 100 nM, 300 nM, 1 µM, 3 µM. (C) Graphical representation of yDna2-K677R inhibition curves. (D) 3 µM polyamide 1 was incubated with the single-stranded mismatch DNA oligomer and yDna2-K677R to assess whether polyamide 1 can inhibit yDna2-K677R ATPase activity.
When activated at a stalled replication fork, ATR is critical for protection of the forks from collapse. ATR also suppresses the firing of dormant origins globally, presumably to prevent further replication-associated damage (6). Recently, Koundrioukoff et al. (47) reported that ATR could be activated in discrete stages. Low concentration aphidicolin treatment, which resulted in moderately reduced fork speeds, led to recruitment of ATR and ATR activators to chromatin as well as delayed mitotic entry but did not result in ssDNA accumulation or Chk1 phosphorylation. In addition, low concentrations of aphidicolin did not induce ATM or H2AX phosphorylation. Based
B
C D
on the similarity in checkpoint response to polyamides, we propose that polyamides induce low level replication stress leading to ATR recruitment and cell cycle delay decoupled from Chk1 activity.
FANCI is an ATR substrate under more severe forms of replication stress. However the FA/BRCA pathway is activated, our results suggest that the FA/BRCA pathway acts in concert with ATR-MCM2 signaling to stabilize replication forks in response to polyamide treatment. The lack of ATR-dependence on polyamide-induced S-phase accumulation is also notable, but consistent with published studies in U2OS cells treated with HU (43). Investigating the effects of knockdown of FA family genes on ssDNA formation and cell cycle phase distribution in polyamide-treated cells would be of interest for future studies.
Figure 2.15 Dose-dependent increase in hydroxyurea (HU)-induced Chk1 S345 phosphorylation. Chk1 S345 phosphorylation was measured in DU145 cells treated with increasing doses of HU for 2 h. Chk1 S345 is maximally phosphorylated at 1 mM or higher HU.
phosphorylation than did HU treatment. This correlates as well with the lack of Chk1 phosphorylation, which requires robust ATR T1989 autophosphorylation (24,25), and is consistent with a model for quantitative regulation of ATR (25). ATR T1989 phosphorylation has actually been shown to be dispensable for ATR recruitment, Rad17 S645 phosphorylation, and recovery from transient replication stress (24,25). Based on these data, we conclude that ATR-MCM2 and FANCD2 signaling are sufficient to induce some fork protection. However, ATR-Chk1 cell cycle checkpoint activation requires ssDNA accumulation and extensive ATR T1989 phosphorylation, which is observed under higher replication stress (Figure 2.14B). While it is unclear what causes ssDNA accumulation and ATR-Chk1 activation, some possible causes are uncoupling of polymerase and helicase, accumulation of excess primers, or nascent DNA degradation.
A few studies have shown previously that the FA/BRCA pathway and the ATR-Chk1 pathway serve non-redundant functions and that their signaling mechanisms are separable. In human primary fibroblasts, Chk1 and FANCD2 both contribute to senescence induction but Chk1 is also responsible for persistent cell cycle arrest in response to psoralen treatment (51). Similarly, knockdown of FANCD2 but not Chk1 sensitizes HeLa cells to cisplatin treatment, despite activation of Chk1 (52). Supporting
Chk1pS345 Chk1
the evidence for their different functions, it has been shown that the canonical ATR activators, Rad17 and TopBP1, are necessary for Chk1 phosphorylation but dispensable for FANCD2 monoubiquitination and FANCI phosphorylation in DT40 cells treated with MMC (53). Conversely, the FA core complex is necessary for FANCD2 monoubiquitination but is dispensable for Chk1 phosphorylation (53). Also, the interaction of FANCD2 with the MCMs is not dependent on Chk1 activity (40). Thus, the activation of the FA/BRCA pathway but not Chk1 in response to polyamide treatment appears to reflect a level of stress that does not require intervention by Chk1.
Hairpin Py-Im polyamide-induced replication stress causes what appears to be an intermediate state of ATR-dependent checkpoint response. We suggest that this is due to transient inhibition of replisome progression caused by the polyamide’s unique high affinity non-covalent DNA-binding properties. This proposed mode of action distinguishes hairpin Py-Im polyamides from other replication inhibitors such as HU and aphidicolin, and will prove useful for further dissociating the S-phase, essential ATR functions from G2 checkpoint functions. Further delineation of the S-phase specific ATR mediators and effectors involved in protecting replication forks can be determined as distinct from or coordinated with those involved in cell cycle slowing.
2.4 Materials and Methods
Chemicals and reagents.
and doxorubicin were purchased from Sigma-Aldrich, as were all other reagents unless otherwise noted.
Antibodies purchased from Santa Cruz Biotech were mouse PCNA, anti-Chk1, anti-RPA2, anti-Rad17, anti-FANCD2, goat anti-ATR, and rat anti-BrdU (CldU cross-reactivity). Antibodies purchased from Bethyl were rabbit anti-H2AX, anti-MCM2, anti-MCM2pS108, and anti-RPA2pS4/S8. Antibodies purchased from Abcam were: rabbit FANCD2, MCM2pS108, Rad9, RPA2pS33, Chk2, H2AXpS139. Antibodies purchased from Cell Signaling Technologies were rabbit anti-ATMpS1981, anti-Rad17pS645, anti-Chk1pS345, anti-Chk1pS317, anti-Chk1pS296. Rabbit anti-Chk2pT68 was purchased from Millipore. Rabbit anti-ATM was purchased from Calbiochem. Rabbit anti-ATRpT1989 was a gift of Prof. Lee Zou.
Cell culture conditions.
LNCaP, LNAR, and DU145 cells were maintained in RPMI 1640 (Invitrogen) with 10% FBS (Irvine Scientific) at 37 °C under 5% CO2. LNCaP and DU145 cells were
purchased from ATCC (Manassas, VA). LNAR cells were a gift from C.L. Sawyers at Memorial Sloan-Kettering Cancer Center (NY, NY).
Cytotoxicity assay.
C50 values for cytotoxicity were determined using a sulfarhodamine-based
respectively. DU145 cells were plated at 2,000 or 2,500 cells per well. Polyamides were added in 100 µl RPMI 1640 supplemented with 10% FBS 24 h after plating. Quadruplicate wells were used for each concentration. Cells were fixed with 100 µl 10% trichloroacetic acid solution, washed, stained, and dried as described. After solubilization of the bound dye in 10 mM Tris (pH 8), the absorbance was measured at 490 nm on a Victor microplate reader (PerkinElmer).
The cytotoxicity data are charted as a percentage of untreated controls, corrected for background absorbance. IC50 is defined as the concentration that inhibits 50% of
control cell growth. These values were determined by non-linear least squares regression fit to Y= A + (B-A)/(1+10^((Log EC50-X)*H, where A=max, B=min, and H=Hill Slope. Three independent trials were averaged; stated IC50 values represent the mean and
standard deviation. These calculations were performed using Prism 4 (GraphPad) software.
Caspase 3/7 activation assay.
each treatment condition was monitored in a sister plate using a tetrazolium-based assay for mitochondrial bioreductive capacity (56). 10 µl WST-1 reagent (Roche) was added to each well and incubated at 37 °C for 30 min before measuring the absorbance at 450 nm. The WST-1 data are corrected for background absorbance and expressed as a percentage of untreated controls.
PARP cleavage assay.
400,000 DU145 cells were plated in 10 cm diameter dishes. Polyamides were added after 24 h and were allowed to incubate an additional 72 h. At harvest, cells were washed once with PBS then treated with 400 µl ice-cold lysis buffer (20 mM Tris-HCl pH 7.5, 150 mM NaCl, 1 mM Na2EDTA, 1 mM EGTA, 1% Triton, 2.5 mM sodium
pyrophosphate, 2 mM β-glycerophosphate, 1 mM Na3VO4, 1 µg/ml leupeptin, 1 mM
Cell cycle analysis.
800,000 DU145 cells were plated in 10 cm diameter dishes for 24 h before treatment with polyamides for an additional 24 h. Cells were pulsed with 10 µM EdU 30 min before harvest to estimate rate of DNA synthesis. Cells were trypsinized and pelleted at 300 x g with cell culture supernatant. Following overnight fixation in 70% ethanol, the cells were rehydrated in 1% BSA/PBS and processed with the Click-it EdU Alexa Fluor 488 Flow Cytometry assay kit (Invitrogen) using half the recommended A488 reagent. After overnight treatment with 0.2 mg/ml RNase A in 1% BSA/PBS, the cells were stained for DNA content with 7-aminoactinomycin D and analyzed on a FACSCalibur (Becton-Dickinson) instrument. The data were analyzed using FlowJo v9.5.3 (TreeStar) and are representative of two trials. Monoparametric, propidium iodide, flow cytometry was also used to evaluate the effect of polyamides 1 and 2 on cell cycle distribution. DU145 cells were treated with 1-100 µM of polyamide 1 or 0.1-10 µM of polyamide 2
for 48 h. The effect of PI3 kinases on cell cycle distribution was measured by treating DU145 cells with 10 µM polyamide 1 or 1 µM polyamide 2 as well as 2 mM caffeine, 4 or 10 µM NU6027 (Calbiochem) and 4 or 10 µM KU55933 (Calbiochem) for 36 h. Data were analyzed using FlowJo and fitted to the Watson (Pragmatic) model. The data are representative of two trials.
Knockdown of ATR and FANCD2 by siRNA.