Automatic Identification of Infrequent Word Senses
Diana McCarthy & Rob Koeling & Julie Weeds & John Carroll
Department of Informatics,
University of Sussex
Brighton BN1 9QH, UK
dianam,robk,juliewe,johnca
@sussex.ac.uk
Abstract
In this paper we show that an unsupervised method for ranking word senses automatically can be used to iden-tify infrequently occurring senses. We demonstrate this using a ranking of noun senses derived from the BNC
and evaluating on the sense-tagged text available in both SemCor and the SENSEVAL-2 English all-words task. We show that the method does well at identifying senses that do not occur in a corpus, and that those that are erro-neously filtered but do occur typically have a lower fre-quency than the other senses. This method should be useful for word sense disambiguation systems, allowing effort to be concentrated on more frequent senses; it may also be useful for other tasks such as lexical acquisition. Whilst the results on balanced corpora are promising, our chief motivation for the method is for application to do-main specific text. For text within a particular dodo-main many senses from a generic inventory will be rare, and possibly redundant. Since a large domain specific cor-pus of sense annotated data is not available, we evaluate our method on domain-specific corpora and demonstrate that sense types identified for removal are predominantly senses from outside the domain.
1
Introduction
Much about the behaviour of words is most appro-priately expressed in terms of word senses rather than word forms. However, an NLP application computing over word senses is faced with consid-erable extra ambiguity. There are systems which can perform word sense disambiguation (WSD) on the words in input text, however there is room for improvement since the best systems on the English SENSEVAL-2 all-words task obtained at most 69% for precision and recall. Whilst there are systems that obtain higher precision (Magnini et al., 2001), these typically suffer from a low recall. WSD per-formance is affected by the degree of polysemy, but even more so by the entropy of the frequency distri-butions of the words’ senses (Kilgarriff and Rosen-zweig, 2000) since the distribution for many words is highly skewed. Many of the senses in such an
inventory are rare and WSD and lexical acquisition systems do best when they take this into account.
There are many ways that the skewed distribution can be taken into account. One successful approach is to back-off to the first (predominant) sense (Wilks and Stevenson, 1998; Hoste et al., 2001). Another possibility would be concentrate the selection pro-cess to senses with higher frequency, and filter out rare senses. This is implicitly done by systems which rely on hand-tagged training corpora, since rare senses often do not occur in the available data. In this paper we use an unsupervised method to rank word senses from an inventory according to preva-lence (McCarthy et al., 2004a), and utilise the rank-ing scores to identify senses which are rare. We use WordNet for our inventory, since it is widely used and freely available, but our method could in prin-ciple be used with another MRD (we comment on this in the conclusions). We report work with nouns here, and leave evaluation on other PoS for the fu-ture.
Our approach exploits automatically acquired thesauruses which provide “nearest neighbours” for a given word entry. The neighbours are ordered in terms of the distributional similarity that they share with the target word. The neighbours relate to different senses of the target word, so for exam-ple the word competition in such a thesaurus pro-vided by Lin1 has neighbours tournament, event,
championship and then further down the ordered list
we see neighbours pertaining to a different sense
competitor,...market...price war. Pantel and Lin
(2002) demonstrate that it is possible to cluster the neighbours into senses and relate these to WordNet senses. In contrast, we use the distributional sim-ilarity scores of the neighbours to rank the various senses of the target word since we expect that the quantity and similarity of the neighbours pertain-ing to different senses will reflect the relative dom-inance of the senses. This is because there will
1Available from
be more data for the more prevalent senses com-pared to the less frequent senses. We use a measure of semantic similarity from the WordNet Similarity package to relate the senses of the target word to the neighbours in the thesaurus.
The paper is structured as follows. The ranking method is described elsewhere (McCarthy et al., 2004a), but we summarise in the following section and describe how ranking scores can be used for fil-tering word senses. Section 3 describes two exper-iments using the BNC for acquisition of the sense rankings with evaluation using the hand-tagged data in i) SemCor and ii) the English SENSEVAL-2 all-words task. We demonstrate that the majority of senses identified by the method do not occur in these gold-standards, and that for those that do, only a small percentage of the sense tokens would be re-moved in error by filtering these senses. In section 4 we use domain labels produced by (Magnini and Cavagli`a, 2000) to demonstrate differences in the senses filtered for a sample of words in two domain specific corpora. We describe some related work in section 5 and conclude in section 6.
2
Method
McCarthy et al. (2004a) describe a method to pro-duce a ranking over senses and find the predominant sense of a word just using raw text. We summarise the method below, and describe how we use it for identifying candidate senses for filtering.
2.1 Ranking the Senses
In order to rank the senses of a target word (e.g.
plant) we use a thesaurus acquired from
automati-cally parsed text (section 2.2 below). This provides the nearest neighbours to each target word (e.g.
factory, refinery, tree etc...) along with the
distribu-tional similarity score between the target word and its neighbour. We then use the WordNet similar-ity package (Patwardhan and Pedersen, 2003) (see section 2.3) to give us a semantic similarity mea-sure (hereafter referred to as the WordNet similarity measure) to weight the contribution that each neigh-bour (e.g. factory) makes to the various senses of the target word (e.g. flora, industrial, actor etc...). We take each sense of the target word ( ) in turn and obtain a score reflecting the prevalence which is
used for ranking. Let be the
or-dered set of the top scoring neighbours of from the thesaurus with associated distributional similar-ity scores !#"!$%&"!' !#"& . Let(($)" be the set of senses of . For each sense of (*,+.-/(($)") we obtain a rank-ing score by summrank-ing over the0 !21" of each
neighbour (213-4 ) multiplied by a weight. This weight is the WordNet similarity score (* ) be-tween the target sense (5#+) and the sense of 61 (#78-9(($61") that maximises this score, di-vided by the sum of all such WordNet similarity scores for(( )" and21 .
Thus we rank each sense * + -(( )" us-ing:
:);
6<=2>@?BA#CD( 5 +"E
F
2.2 Acquiring the Automatic Thesaurus There are many alternative distributional similarity measures proposed in the literature, for this work we used the measure and thesaurus construction method described by Lin (1998). For input we used grammatical relation data extracted using an automatic parser (Briscoe and Carroll, 2002). For each noun we considered the co-occurring verbs in the direct object and subject relation, the modifying nouns in noun-noun relations and the modifying ad-jectives in adjective-noun relations. We could easily extend the set of relations in the future. A noun, , is thus described by a set of co-occurrence triples
^
!D_a` and associated frequencies, where D is a grammatical relation and _ is a possible co-occurrence with in that relation. For every pair of nouns, we computed their distributional similar-ity. Ifb) c" is the set of co-occurrence types D!_d" such that ef %D!_d" is positive then the similarity between two nouns, and , can be computed as:
%g"L
A thesaurus entry of size for a target noun is then defined as the most similar nouns to .
2.3 The WordNet Similarity Package
We use the WordNet Similarity Package 0.05 and WordNet version 1.6. 2 The WordNet Similarity
2
package supports a range of WordNet similarity scores. We used the jcn measure to give results for the 5 function in equation 1 above, since this has given us good results for other experiments, and is efficient given the precompilation of required frequency files (information dat files). We discuss the merits of investigating other semantic similarity scores in section 6.
The jcn (Jiang and Conrath, 1997) measure provides a similarity score between two WordNet senses (u| and } ), these being synsets within WordNet. The measure uses corpus data to pop-ulate classes (synsets) in the WordNet hierarchy with frequency counts. Each synset, is incre-mented with the frequency counts from the cor-pus of all words belonging to that synset, directly or via the hyponymy relation. The frequency data is used to calculate the “information content” (IC) of a class e6~ " C,>d "W". Jiang and Con-rath specify a distance measure: 1]
G
u|{!}"8
e6~ {|"Boe6~$}"}M8e6~$", where the third class, is the most informative, or most specific superordinate synset of the two senses u| and } . This is transformed from a distance measure in the WN-Similarity package by taking the reciprocal:
A#g u|u}"p| 1]
G
$u|u}"
The jcn measure uses corpus data for the calcu-lation of IC. The experimental results reported here are obtained using IC counts from the BNC corpus with the resnik count option available in the Word-Net similarity package. We did not use the default IC counts provided with the package since these are derived from the hand-tagged data in SemCor. All the results shown here are those with the size of the-saurus entries ( ) set to 50.
3
2.4 Filtering
We use equation 1 above to produce ranking scores for the senses (( )" of a target word . We then use a thresholdb
which is a constant percent-age (bc ) of the ranking score of the first ranked sense. Any senses with scores lower than b are identified for filtering. This threshold will permit the filtering to be sensitive to the ranking scores of the word in question.
3
Experiments with a Thesaurus from a
Balanced Corpus
For the experiments described in this section we acquired the thesaurus from the grammatical rela-tions listed in 2.2 automatically extracted from the 90 million words of written English from the BNC.
3Previous ranking experiments using
], #= and! gave only minimal changes to the results.
We generated a thesaurus entry for all polysemous nouns which occurred in SemCor with a frequency
` 2, and in theBNCwith a frequency 10. We ex-periment withbc¡ |¢6}u¢6£u¢¤. For these exper-iments we evaluate using the gold-standard sense-tagged data available in i) SemCor and ii) the En-glish SENSEVAL-2 all-words task. For each value ofbc we compute the number of sense types fil-tered (¥5¦ §¨( ), and the percentage of these that are correctly filtered (¥5¦ §¨(© ) in that they do not oc-cur at all in our gold-standard. We also compute for those types that do occur¥5¦ CS h$h
P, the percent-age of sense tokens that would be filtered incorrectly from the gold-standard by their removal from Word-Net.¥5¦$CS h$h
P'P is the percentage of sense tokens that would be filtered incorrectly for the subset of words for which there are tokens filtered.
The results when using the ranking scores derived from the BNC thesaurus for filtering the senses in SemCor are shown in table 1 for different values of
b) . For polysemous nouns in SemCor, the percent-age of sense types that do not occur is 38%, so if we filtered randomly we could expect to get 38% ac-curacy. ¥5¦ §¨(©! is well above this baseline for all values ofb) . Whilst there are sense types in Sem-Cor that are filtered erroneously, these are senses which occur less frequently than the non-filtered types. Furthermore, they account for a relatively small percentage of tokens for the filtered words as shown by ¥5¦$CS h$h
P'P. Table 2 shows that
¥5¦$CS h$h
P
is lower than would be expected if the sense types which are filtered had average frequency. There are 10687 sense types for the polysemous nouns in SemCor, of which 6573 actually occur. The num-ber of sense types filtered in error for each value of bc is shown by ¥5¦ §¨(S h$h . The proportion of tokens expected for the given¥5¦ §¨(S h$h , if the filtered types were of average frequency, is given by ¦$CS 7ª «¬$®
SQO=¯ ° °
±!²&³$´ . For the highest value of
b)µ¶£{¢ , 3099 types are identified for filtering, this comprises 47% of the types occurring in Sem-Cor, however¥5¦$C S h$h
P shows that only 39% tokens are filtered. As the value ofbc decreases, we filter fewer sense types, less tokens in error and the ratio between¦$C0S\7 and ¥5¦$C0S\h h
P increases. The com-promise between the number of sense types filtered, and the removal of tokens in error will depend on the needs of the application, and can be altered with
b) .
b) ¥5¦ §¨( ¥5¦ §¨(© ¥5¦$CS h$h ¥5¦ CS h$h
90 5952 48 39 44
80 4560 50 25 32
70 3057 52 16 25
60 1724 52 8 19
50 672 54 3 13
40 146 54 0.5 9
30 28 57 0.04 5
20 - - -
-Table 1: Filtering results for SemCor
b) ¥5¦ §¨(S h$h ¦ CS 7 ¥5¦ CS h$h
P
¬m· ¯m[
«¬m· &¯ ° °
P
90 3099 47 39 1.2
80 2271 35 25 1.4
70 1472 22 16 1.4
60 821 12 8 1.5
50 308 5 3 1.7
40 67 1 0.5 2
30 12 0.2 0.04 5
Table 2: Erroneous tokens anticipated, and filtered from SemCor
nouns occurring in this corpus, there are 77% sense types which do not occur. The results in table 3 show much higher values for ¥5¦ §¨(©! because of this higher baseline (77%). The filtering results nev-ertheless show superior performance to this base-line at all levels of bc . This time there are no sense types filtered for b) ¸u¢ . The frequen-cies of the types filtered in error are close to the val-ues of¦$C S 7 , as shown in table 4. This is because the corpus is very small. Many types do not occur and many types have a low frequency, regardless of whether they are filtered or not.
In this section we demonstrated that the ranking scores can be used alongside a threshold to remove senses which are considered rare for the corpus data at hand, that the majority of sense types filtered in this way do not occur in our test data, and that those that do typically have a low or average frequency. There are of course differences between the BNC corpus that we used to create our sense ranking and the test corpora, however, since the BNC is a bal-anced corpus we feel that this is a feasible means of evaluation, and the results bear this out. A main advantage of our approach is to enable us to tailor a resource such as WordNet to domain specific text, and it is to this that we now turn.
b) ¥5¦$§¨( ¥5¦ §¨(© ¥5¦ CS h$h ¥5¦ CS h$h
90 1018 87 38 44
80 827 88 28 35
70 584 89 18 29
60 370 91 10 22
50 157 89 5 24
40 42 95 0.06 11
30 - - -
-Table 3: Filtering results on the SENSEVAL-2 En-glish all-words task
bc ¥5¦$§f(S\h$h ¦ CS 7 ¥5¦ CS h$h
P
¬· W¯m[
«¬· ¯ ° °
P
90 133 38 39 1
80 96 28 28 1
70 62 18 18 1
60 33 10 10 1
50 17 5 5 1
40 2 0.06 0.06 1
Table 4: Erroneous tokens anticipated, and filtered from SENSEVAL-2
4
Experiments Filtering Senses from
Domain Specific Texts
A major motivation for our work is to try to tailor a sense inventory to the text at hand. In this section we apply our filtering method to two domain specific corpora. We demonstrate that the senses filtered us-ing our method on these corpora are determined by the domain. The Reuters corpus (Rose et al., 2002) is a collection of about 810,000 Reuters, English Language News stories (covering the period August 1996 to August 1997). Many of the news stories are economy related, but several other topics are in-cluded too. We have selected documents from the SPORTS domain (topic code: GSPO) and a limited number of documents from the FINANCE domain (topic codes: ECAT (ECONOMICS) and MCAT (MARKETS)). We chose the domains of SPORTS and FINANCE since there is sufficient material for these domains in this publically available corpus.
TheSPORTcorpus consists of 35317 documents (about 9.1 million words). The FINANCE corpus consists of 117734 documents (about 32.5 million words). We acquired thesauruses for these corpora using the procedure described in section 2.2.
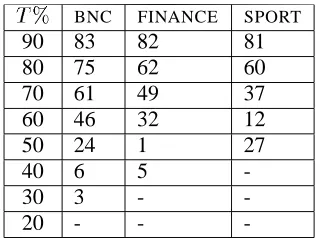
bc BNC FINANCE SPORT
90 83 82 81
80 75 62 60
70 61 49 37
60 46 32 12
50 24 1 27
40 6 5
-30 3 -
-20 - -
-Table 5: Percentage of sense types filtered
which annotates WordNet synsets with domain la-bels. The SFC contains an economy label and a
sportslabel. For this domain label experiment we selected all the words in WordNet that have at least one synset labelledeconomyand at least one synset labelled sports. The resulting set consisted of 38 words. The relative frequency of the domain labels for all the sense types of the 38 words is show in figure 1. The three main domain labels for these 38 words are of coursesports,economyand fac-totum (domain independent). In figure 2 we con-trast the relative frequency distribution of domain labels for filtered senses (usingb)¹»ºu¢ ) of these 38 words in i) theBNC ii) theFINANCE corpus and iii) theSPORTcorpus.
From this figure one can see that there are more
economyandcommercesenses removed from the SPORT corpus, with no filtered sport labels. The FINANCE and BNC corpora do have some filtered
economyandcommercelabels, but these are only a small percentage of the filtered senses, and for FI-NANCE there are less than for theBNC.
Table 5 shows the percentage of sense types fil-tered at different values of b) . There are a rela-tively larger number of sense types filtered in the BNC compared to theFINANCE corpus, and this in turn has a larger percentage than theSPORTcorpus. This is particularly noticeable at lower values ofb) and is because for these 38 words the ranking scores are less spread in theFINANCE, and SPORTcorpus, arising from the relative size of the corpora and the spread of the distributional similarity scores. We conclude from these experiments that the value of
b) should be selected dependent on the corpus as well as the requirements of the application. There is also scope for investigating other distributional sim-ilarity scores and other filtering thresholds, for ex-ample, taking into account the variance of the rank-ing scores in the corpus.
5
Related Work
WordNet is an extensive resource, as new versions are created new senses get included, however, for backwards compatibility previous senses are not deleted. For many NLP applications the problems of word sense ambiguity are significant. One way to cope with the larger numbers of senses for a word is by working at a coarser granularity, so that re-lated senses are grouped together. There is useful work being done to cluster WordNet senses auto-matically (Agirre and Lopez de Lacalle, 2003). Pan-tel and Lin (2002) are working with automatically constructed thesauruses and identifying senses di-rectly from the nearest neighbours, where the gran-ularity depends on the parameters of the clustering process. In contrast we are using the nearest neigh-bours to indicate the frequency of the senses of the target word, using semantic similarity between the neighbours and the word senses listed in WordNet. We do so here in order to identify the senses of the word which are rare in corpus data.
Lapata and Brew (2004) have recently used syn-tactic evidence to produce a prior distribution for verb senses and incorporate this in a WSD system. The work presented here focusses on using a preva-lence ranking for word senses to identify and re-move rare senses from a generic resource such as WordNet. We believe that this method will be use-ful for systems using such a resource, which can incorporate prior distributions over word senses or wish to identify and remove rare word senses. Sys-tems requiring sense frequency distributions cur-rently rely on available hand-tagged training data, and for WordNet the most extensive resource for all-words is SemCor. Whilst SemCor is extremely use-ful, it comprises only 250,000 words taken from a subset of the Brown corpus and a novel. Because of its size, and the zipfian distribution of words, there are many words which do not occur in this resource, for example embryo, fridge, pancake, wheelbarrow and many words which occur only once or twice. Our method using raw text permits us to obtain a sense ranking for any word from our corpus, subject to the constraint that we have enough occurrences in the corpus. Given the increasing amount of data on the web, this constraint is not likely to be problem-atic.
0
Relative Frequency Sense Types
¼
Figure 1: Distribution of domain labels of all senses for 38 polysemous words
0
Relative Frequency Filtered Sense Types
È
Figure 2: Distribution of domain labels of filtered senses for 38 polysemous words
WordNet to be tailored to the domain. Buitelaar and Sacaleanu (2001) have previously explored rank-ing and selection of synsets in GermaNet for spe-cific domains using the words in a given synset, and those related by hyponymy, and a term relevance measure taken from information retrieval. Buite-laar and Sacaleanu have evaluated their method on identifying domain specific concepts using human judgements on 100 items.
Magnini and Cavagli`a (2000) have identified WordNet word senses with particular domains, and this has proven useful for high precision WSD (Magnini et al., 2001); indeed in section 4 we used these domain labels for evaluation of our automatic filtering senses from domain specific corpora. Iden-tification of these domain labels for word senses was
semi-automatic and required a considerable amount of hand-labelling. Our approach is complementary to this. It provides a ranking of the senses of a word for a given domain so that manual work is not neces-sary, because of this it can easily be applied to a new domain, or sense inventory, given sufficient text.
6
Conclusions
BNC, we have demonstrated that this technique pro-duces promising results in removing unused senses from both SemCor and the SENSEVAL-2 English all-words task corpus. Moreover, the senses re-moved erroneously from SemCor were less frequent than average.
A major benefit of this method is to tailor a generic resource such as WordNet to domain-specific text, and we have demonstrated this us-ing two domain specific corpora and and an eval-uation using semi-automatically created domain la-bels (Magnini and Cavagli`a, 2000).
There is scope for experimentation with other WordNet similarity scores. From earlier experi-ments we noted that the lesk measure produced quite good results, although it is considerably less efficient than jcn as it compares sense definitions at run time. One major advantage that lesk has, is its applicability to other PoS. The lesk measure can be used when ranking adjectives, and adverbs as well as nouns and verbs (which can also be ranked us-ing jcn). Another advantage of the lesk measure is that it is applicable to lexical resources which do not have the hierarchical structure that WordNet does, but do have definitions associated with word senses. This paper only deals with nouns, however we have recently investigated the ranking method for an unsupervised predominant sense heuristic forWSD for other PoS (McCarthy et al., 2004b). We plan to use the ranking method for identifying prevalent and infrequent senses from domain specific text and using this as a resource forWSD and lexical acqui-sition.
Acknowledgements
We would like to thank Siddharth Patwardhan and Ted Pedersen for making the WN Similarity pack-age publically available. This work was funded by EU-2001-34460 project MEANING: Develop-ing MultilDevelop-ingual Web-scale Language Technolo-gies, UK EPSRC project Robust Accurate Statisti-cal Parsing (RASP) and a UK EPSRC studentship.
References
Eneko Agirre and Oier Lopez de Lacalle. 2003. Clus-tering wordnet word senses. In Recent Advances in
Natural Language Processing, Borovets, Bulgaria.
Edward Briscoe and John Carroll. 2002. Robust ac-curate statistical annotation of general text. In
Pro-ceedings of the Third International Conference on Language Resources and Evaluation (LREC), pages
1499–1504, Las Palmas, Canary Islands, Spain. Paul Buitelaar and Bogdan Sacaleanu. 2001. Ranking
and selecting synsets by domain relevance. In
Pro-ceedings of WordNet and Other Lexical Resources:
Applications, Extensions and Customizations, NAACL 2001 Workshop, Pittsburgh, PA.
V´eronique Hoste, Anne Kool, and Walter Daelemans. 2001. Classifier optimization and combination in the English all words task. In Proceedings of the
SENSEVAL-2 workshop, pages 84–86.
Jay Jiang and David Conrath. 1997. Semantic similarity based on corpus statistics and lexical taxonomy. In
In-ternational Conference on Research in Computational Linguistics, Taiwan.
Adam Kilgarriff and Joseph Rosenzweig. 2000. English SENSEVAL: Report and results. In Proceedings of
LREC-2000, Athens, Greece.
Mirella Lapata and Chris Brew. 2004. Verb class dis-ambiguation using informative priors. Computational
Linguistics, 30(1):45–75.
Dekang Lin. 1998. Automatic retrieval and clustering of similar words. In Proceedings of COLING-ACL 98, Montreal, Canada.
Bernardo Magnini and Gabriela Cavagli`a. 2000. Inte-grating subject field codes into WordNet. In
Proceed-ings of LREC-2000, Athens, Greece.
Bernardo Magnini, Carlo Strapparava, Giovanni Pezzuli, and Alfio Gliozzo. 2001. Using domain information for word sense disambiguation. In Proceedings of the
SENSEVAL-2 workshop, pages 111–114.
Diana McCarthy, Rob Koeling, Julie Weeds, and John Carroll. 2004a. Finding predominant senses in un-tagged text. In Proceedings of the 42nd Annual
Meet-ing of the Association for Computational LMeet-inguistics,
Barcelona, Spain.
Diana McCarthy, Rob Koeling, Julie Weeds, and John Carrolł. 2004b. Using automatically acquired pre-dominant senses for word sense disambiguation. In
Proceedings of the ACLSENSEVAL-3 workshop. Martha Palmer, Christiane Fellbaum, Scott Cotton,
Lau-ren Delfs, and Hoa Trang Dang. 2001. English tasks: All-words and verb lexical sample. In Proceedings of
theSENSEVAL-2 workshop, pages 21–24.
Patrick Pantel and Dekang Lin. 2002. Discovering word senses from text. In Proceedings of ACM SIGKDD
Conference on Knowledge Discovery and Data Min-ing, pages 613–619, Edmonton, Canada.
Siddharth Patwardhan and Ted Pedersen. 2003. The cpan wordnet::similarity pack-age. http://search.cpan.org/author/SID/WordNet-Similarity-0.03/.
Tony G. Rose, Mary Stevenson, and Miles Whitehead. 2002. The Reuters Corpus volume 1 - from yes-terday’s news to tomorrow’s language resources. In
Proc. of Third International Conference on Language Resources and Evaluation, Las Palmas de Gran
Ca-naria.
Yorick Wilks and Mark Stevenson. 1998. The grammar of sense: using part-of speech tags as a first step in se-mantic disambiguation. Natural Language