296
Sugarcane Disease Detection Using Data Mining
Techniques
S Sathiamoorthy, R Ponnusamy, M Natarajan
#1,2
Department of computer and Information Science, Annamalai University
Abstract— Leaf diseases may lead to severe loss in agricultural yields. To improve agricultural yields the
identification and classification of leaf disease is essential. The Sugarcane leaf diseases can be manually identified by the disease syndrome based on the experience. In this process, mostly a misguidance of plant leaf disease symptoms may be identified. Hence, in this paper we propose an accurate and automated process of leaf disease identification. The R Datasets are used to perform experimental study. Techniques like Multilayer perceptron (MLP), J48 pruned trees and clustering algorithm like k-means are used for predicting sugarcane leaf diseases by using Weka tool and shown its potential results.
Keywords— Machine Learning, Multilayer perceptron, J48 pruned trees, K-means, Weka tool
INTRODUCTION
Today, Data mining is growing rapidly in all domains namely Healthcare, Market Analysis, Financial Banking, Research Analysis and Agriculture, which represents knowledge implicitly stored in large data sets. current technologies provide us lot of information on agriculture related activities and also used to retrieve useful hidden information from them. Generally various classification and clustering algorithms have been proposed in the past for analyzing the leaf diseases of various plants. Clustering is a process of grouping the data based on the characteristics of data. In common clustering techniques falls into unsupervised category for statistical data analysis used in many fields including machine learning, data mining, pattern recognition, image analysis and bioinformatics. [1] reports that there is no best clustering technique because the success is fully depends on the type of data. Classification techniques falls into supervised category for predicting the target class for each case in the data.
REVIEW OF LITERATURE
First arrival of crop disease can observed at very first stage from its leaf pattern. The infected plant shows some colored spots on leaf generated due to different types of infection [3]. Manual detection of the plant leaf disease of a crop is a difficult one, also it may lead to wrong conclusion with wrong preventive action.
In image processing there are wide application with more relevant and correct output for achieving this early crop disease detection. The leaf image can be analyzed in different extent to observe the various spots and comparing it with the stored data sets to provide the exact disease occurred on crop [4]. There are three major spot disease types, namely rust spot, yellow spot, and ring spot, which infect the tropical yield. The symptom of these fungi-caused diseases appears on a leaf as unique spots. These spots can be manually recognized based on the spot characteristics. However, this manual recognition has its limitation that may harm the efforts in many cases. Manual detection and estimation by the naked eye observations are subjective and is not possible to identify the disease accurately [5].
297 vision is a potential solution to reduce the risk of
human error on disease detection [6].
Shiv Ram Dubey et al, [7] presents an adaptive scheme for diagnosis of fruit diseases, in which Image processing techniques were used to diagnosis the disease and K-means clustering technique is employed for segmentation. The extracted features from the region of interest is used to classify the diseased images with help of support vector machine. The accuracy obtained here was approximately 93%. Yinmao Song et al [8] performed plant leaf disease classification using texture features. later, various researchers have made number of efforts to extract efficient features based on statistical methods. Abdullah et al. [9] presents a classification of rubber tree leaf diseases based on RGB color model. In which, ANN based Classification between three leaf diseases of rubber was carried out and the PCA technique is used for reducing input dimension. The classification of three diseases of paddy found in Sri Lanka was carried out by Anthonys et. al. [10] using Colour and texture analysis, and the format of membership function was used for classification. In the study of Camargo et. al. [11], a machine learning system for the identification of the visual symptoms of cotton plant diseases, from coloured images was proposed.
The classification of palm leaf diseases was done by Hairuddin et al. [13] using Fuzzy logic method. Kurniawati et al. [14] suggested texture analysis for diagnosing paddy diseases. Pujari et al. [15] described Artificial Neural Network (ANN) and Support Vector Machine (SVM) based recognition of visual symptoms on cereals like wheat, maize and jowar affected by fungal disease.
Sanjay and Bodhe et al. [16] discussed the detection and estimation of the disease spot severity, which is needed to determine the quality of certain variety in plant breeding and make appropriate decision in disease management.
Fungi-caused diseases symptom in sugarcane are appear on leaf as spots. This symptom can be recognized visually and the disease severity can be estimated by calculating the quotient of infected area
and leaf area . Chaudhari, et al. [17] presented a simple triangle thresholding method is used to segment the infected area and leaf area respectively in HSI color space, and reported that disease spot are different in color but not in intensity.
PROPOSED WORK
In this work, the R-Dataset is used as a benchmark database to perform experimental study to find out the diseases which affects the sugarcane leaf. We have analyzed the classification algorithms like J48 pruned tree and Multilayer perceptron and which is compared with K-means clustering algorithm. These algorithms were implemented in WEKA tool for classification and clustering.
J48 pruned trees
This algorithm generates the rules for the prediction of the target variable. With the help of tree classification algorithm the critical distribution of the data is easily understandable. The WEKA tool provides a number of options associated with tree pruning. In case of potential over fitting pruning can be used as a tool for précising. In other algorithms the classification is performed recursively till every single leaf is pure, that is the classification of the data should be as perfect as possible. This algorithm it generates the rules from which particular identity of that data is generated. The objective is progressively generalization of a decision tree until it gains equilibrium of flexibility and accuracy.
Basic Steps in the Algorithm:
i. In case the instances belong to the same class the tree represents a leaf so the leaf is returned by labeling with the same class. ii. The potential information is calculated for
every attribute, given by a test on the attribute. Then the gain in information is calculated that would result from a test on the attribute.
298 Multilayer Perceptron
The Multilayer Perceptron (MLP) which is also called as Feed Forward Artificial Neural Network. To training a network which uses the back propagation algorithms also it is not linearly separable. It is referred to as ―vanilla ―neural networks, hence it has a single hidden layer. In all the neurons a multilayer Perceptron has a linear activation function. A weighted inputs will maps the each neurons output. A nonlinear activation function is develop the frequency of potential actions of biological neurons in the brain will make a multilayer Perceptron in different manner [18].
K-means
A k-nearest neighbor has loose relationship in popular machine learning techniques for classification which is totally confused with k-means because of the k in the name. The nearest neighbor classifier for a cluster center may be the person can be applying in existing clusters for a new data [19]. Basic steps in K-means :
i. Choose randomly K input vectors (data points) to initialize the clusters.
ii. For each input vector, find the cluster center that is closest, and assign that input vector to the corresponding cluster.
iii. Update the cluster centers in each cluster using the mean (centroid) of the input vectors assigned to that cluster.
iv. Repeat steps 2 and 3 until no more change in the value of the means.
Results and Discussion
In this paper, in the domain of sugarcane we adopt J48 pruned tree for classification process. The R-Dataset is used as a benchmark database to perform experimental study. The experimental results confirmed that the proposed approach for
classification is significantly higher than the existing approach.
Description of Datasets
Datasets are collected from R Datasets. The sugarcane data frame has 180 rows and 6 columns as shown in Table 1. It represents a randomized block design with 45 varieties of sugar-cane and 4 blocks as shown in Table 3.
Datasets Number of attributes Number of
Instances
Sugarcane
[image:3.612.319.549.257.306.2]Datasets 6 180
TABLE 1: SUGARCANE DATASETS
S.No Attributes ID
1 S S0
2 N S1
3 R S2
4 X S3
5 Var S4
[image:3.612.309.554.492.689.2]6 Block S5
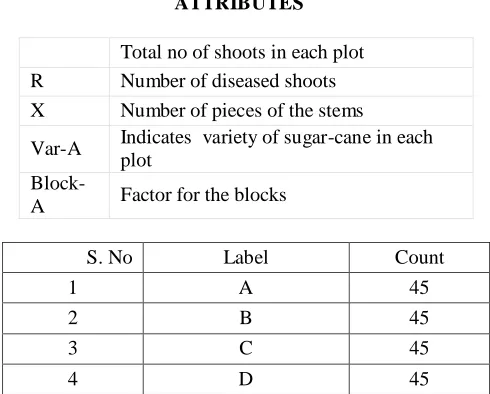
TABLE 2: SUGARCANE DATASETS
ATTRIBUTES
Total no of shoots in each plot R Number of diseased shoots X Number of pieces of the stems
Var-A Indicates variety of sugar-cane in each plot
Block-A Factor for the blocks
S. No Label Count
1 A 45
2 B 45
3 C 45
299
TABLE 3: REPRESENTATION OF ATTRIBUTES FOR INSTANCES
For evaluating a training data, 0.03 seconds of time taken to test the model as shown in Table 4. Table 4 shows the summary of results for J48 pruned trees. From this results, % error and classification is calculated.
J48 pruned trees
clas sifie d insta nces (Cor rect) Clas sifie d Insta nces (inco rrect ) Ka ppa stat isti c Me an abs olut e erro r Ro ot me an squ are d err or Rel ativ e abs olut e erro r Ro ot rela tive squ are d err or Tota l Nu mbe r of Inst ance s
[image:4.612.325.540.236.399.2]180 0 1 0 0 0% 0% 180
TABLE 4:J48 PRUNED TREES- SUMMARY OF RESULTS
By using a WEKA tool here in this proposed work a summary of the resultant data’s are shown. For evaluating a training data, 0.39 seconds time taken to test the model. Table 7 shows the summary of results for Multilayer perceptron. From this results, % error and classification is calculated.
Multilayer perceptron clas sifie d inst ance s (cor rect) class ified insta nces (inco rrect ) Ka ppa stat isti c Me an abs olut e erro r Ro ot me an squ are d err or Rel ativ e abs olut e erro r Roo t rela tive squ ared erro r Tota l Nu mbe r of Inst ance s
180 0 1 0.0
[image:4.612.67.295.251.383.2]093 0.0 125 2.48 41 % 2.88 41 % 180
TABLE 7: MULTILAYER PERSEPTRON-SUMMARY OF RESULTS
By using a weka tool here in this proposed work a summary of the resultant datas are shown below Table 8. It takes number of iterations as 6. squared errors are calculated within the cluster as 122.51367447845827. Missing values are globally replaced with mean/mode.
Final cluster
centroids: Clusters #
Attribut e Full Data (180.0) 0 (89.0) 1 (91.0) N 118.14 120.69 115.66 R 20.2556 17.25 22.86 X 11.9389 12.30 11.58
Var 23 28.12 17.99
block A D A
[image:4.612.338.535.441.602.2]TABLE 8: SUMMARY OF RESULTS
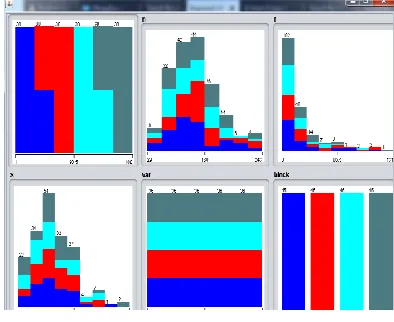
Fig.1 HISTOGRAM EVALUATION FOR EACH OF THE ATTRIBUTES
[image:4.612.67.295.507.660.2]300 diseases. For each of the classification and clustering
techniques the time taken to build and evaluate the model is measured and it is shown below in Table 9.
Machine learning techniques
J48 Multilayer
perceptron
K-means
Time taken (in
[image:5.612.67.294.188.269.2]sec) 0.03 0.39 0.01
TABLE 9: TIME TAKEN BY EACH ALGORITHM
We note that using K-means algorithm takes the smallest time as shown in table 11 when comparing with J48 and Multilayer perceptron algorithm. The time taken for building the model is 0.01 sec, 0.03 sec, and 0.39sec, for K-means clustering algorithm, J48 algorithm, and multilayer perceptron algorithm respectively.
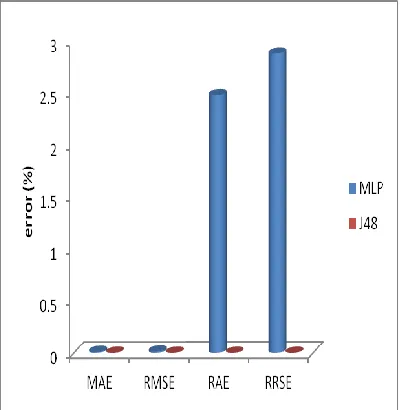
Fig 2, shows the performance of sugarcane diseases classification for J48 and MLP method. The error is measured with the Root Mean Square Error (RMSE), Mean Absolute Error (MAE), Relative Absolute Error (RAE), Root Relative Squared Error (RRSE). J48 algorithm shows lower error (0%) when compared to multilayer perceptron with various performance measures.
Fig 2: PERFORMANCE OF SUGARCANE DISEASES CLASSIFICATION FOR MLP AND
J48
CONCLUSION
In this work, automatic detection of sugarcane leaf diseases is analyzed. We analyzed, the performance of machine learning techniques based on time measure and its sugarcane diseases prediction. Machine learning techniques like Multilayer perceptron ,J48 pruned trees and clustering algorithm like k-means are used for predicting sugarcane leaf diseases by using Weka tool and shows its potential results. As a future implementation the performance of various machine learning techniques may be analyzed to prediction of various crop diseases.
References
[1] Jiang,M.F., Tseng,S.S., 2001 Two-phase clustering process for outliers detection, Pattern Recognition Letters 22, pp.691-700. [2] Dheeb Al Bashish, Malik Braik, A
framework for Detection and Classification of Plant Leaf and Stem Diseases, 2010 IEEE International Conferences on Signal and Image Processing.
[3] Shen Weizheng, Wu Yachun, Chen zhanliang,WeiHongda. Grading Method of Leaf Spot Disease Based on Image Processing. In the proceedings of CSSE 2008.
[4] Vibhute, Anup, and S. K. Bodhe, ―Applications of Image Processing in Agriculture: A Survey,‖International Journal of Computer Applications, vol. 52, no. 2 pp. 0975-8887, August 2012.
[5] Arti N. Rathod, et al, ―Image Processing Techniques for Detection of Leaf Disease‖, International Journal of Advanced Research in Computer Science and Software Engineering, vol. 3, no.11, November 2013. [6] Priyanka Sharma, ―Comparative Analysis of
[image:5.612.86.287.491.696.2]301 and Communication(IJRITCC), ISSN:
2321-8169, PP: 684 - 690, DOI: 10.17762/ijritcc2321-8169.150254 Plant Pathology, Web Page Wikipedia.
[7] Shiv Ram Dubey, Anand Singh Jalal (2012) ―Adapted Approach for Fruit disease Identification using Images‖, in International Journal of computer vision and image processing (IJCVIP) Vol. 2, no. 3:44-58.
[8] Yinmao Song, ZhihuaDiao, Yunpeng Wang, Huan Wang, ―Image Feature Extraction of Crop Disease‖ in IEEE Symposium on Electrical & Electronics Engineering (EEESYM), 2012.
[9] Noor Ezan Abdullah, Athirah A. Rahim, Hadzli Hashim and Mahanijah Md Kamal, ―Classification of Rubber Tree Leaf Diseases Using Multilayer Perceptron Neural Network,‖ The 5th Student Conference on Research and Development -SCOReD 2007 11-12 December 2007, Malaysia.
[10]G. Anthonys, N. Wickramarachchi, ―An Image Recognition System for Crop Disease Identification of Paddy fields in Sri Lanka,‖ Fourth International Conference on Industrial and Information Systems, ICIIS 2009, 28 -31December,2009, Sri Lanka. [11]A. Camargo, J.S. Smith, ―Image pattern
classification for the identification of disease causing agents in plants,‖ Computers and Electronics in Agriculture 66 (2009) 121– 125
[12]K. Jagan Mohan, Recognition of Paddy Plant Diseases Based on Histogram Oriented Gradient Features International Journal of Advanced Research in Computer and Communication Engineering -2016.
[13]Muhammad Asraf Hairuddin, Nooritawati Md Tahir, Shah Rizam Shah Baki, ―Overview of Image Processing Approach for Nutrient deficiencies detection in Elaeis Guineensis,‖ 2011 IEEE International Conference on System Engineering and Technology (ICSET), 978-14577-1255-5/11. [14]Nunik Noviana Kurniawati, Siti Norul Huda Sheikh Abdullah, Salwani Abdullah, Saad
Abdullah, ―Texture Analysis for Diagnosing Paddy Disease,‖ 2009 International Conference on Electrical Engineering and Informatics,5-7 August 2009, Selangor, Malaysia.
[15]Jagadeesh D. Pujari, Rajesh Yakkundimath, Abdulmunaf S. Byadgi, ―Classification of Fungal Disease Symptoms affected on cereals using Colour texture features,‖ International Journal of Signal Processing, Image Processing and Pattern Recognition, Vol. 6, No. 6 (2013), pp. 321-330.
[16]Patil, Sanjay B., and Shrikant K. Bodhe. ―leaf disease severity measurement using image processing.‖International Journal of Engineering & Technology, vol. 3, no. 5, pp.0975-4024, OktoberNovember 2011. [17]Chaudhari, P., et al. "Color Transform
Based Approach for Disease Spot Detection on Plant Leaf‖, " International Journal of Computer Science and Telecommunications, vol. 3, no.6, June 2012.
[18]https://en.wikipedia.org/wiki/Multilayer_per ceptron.
[19]Rajashree Dash, Debahuti Mishra, Amiya Kumar Rath, Milu Acharya, 2010, ―A hybridized K-means clustering approach for high dimensional dataset‖, International Journal of Engineering, Science and Technology, Vol.2(2), pp. 59-66.
[20]R. Ravikumar, V. Arulmozhi., Prediction of Leaf Diseases by using Machine Learning Techniques-A New Approach to Applied Informatics, International Journal on Recent and Innovation Trends in Computing and Communication, Volume: 5 Issue: 6, ISSN: 2321-8169, 1154-1158