M o d e p r e f e r e n c e in a s i m p l e d a t a - r e t r i e v a l t a s k
Alexander L Rudnicky
S c h o o l o f C o m p u t e r S c i e n c e , C a r n e g i e M e l l o n U n i v e r s i t y P i t t s b u r g h , P A 15213 U S A
A B S T R A C T
This paper describes some recent experiments that assess user behavior in a multi-modal environment in which actions can be performed with equivalent effect in speech, keyboard or scroller modes. Results indicate that users freely choose speech over other modalities, even when it is less efficient in objective terms, such as time-to-completion or input error.
I N T R O D U C T I O N
Multi-modal systems allow users to both tailor their input style to the task at hand and to use input strate- gies that combine several modes in a single trans- action. As yet no consistent body of knowledge is available for predicting user behavior in multi-modal environments or to guide the design of multi-modal systems. This is particularly true when interfaces in- corporate new technologies such as speech recogni- tion.
For activities in a workstation environment, formal comparisons of speech with other input modes have failed to demonstrate a clear advantage for speech on conventional aggregate measures of performance such as time-to-completion [1, 8, 4], despite a con- sistent advantage displayed by speech at the level of single input operations. T h e difference can actu- ally be attributed to the additional incurred costs of non-real-time recognition and error correction. While real-time performance can he achieved, it is unlikely that error-free recognition will be available in the near future. Given these shortcomings, we might ask if speech can provide advantages to the user along di- mensions other than task speed, for example by re- ducing the effort needed to generate an input.
There is reason to believe that users are quite good at estimating the response characteristics of an inter- face and can choose an input strategy that optimizes salient aspects of performance, for example decreas- ing time-to-completion or minimizing task error [5, 9].
By observing the behavior of users in a situation in which they can freely choose between different strate- gies, we can gain insight into the factors t h a t govern their preference for different input styles.
A simple data retrieval task was chosen for this study, as the task was one amenable to execution in each of the three modalities that were examined: speech, keyboard and scroller. T h e database contained in- formation about individuals, such as address, tele- phone, etc selected from a list of conference atten- dees. T h e task consisted of retrieving the record for an individual and recording the last group of digits in their work telephone number (typically of length four). T h e database contained 225 names for the first experiment and was expanded to 240 names for the second experiment.
S Y S T E M I M P L E M E N T A T I O N
T h e Personal Information Database (PID) compo- nent of the OM system [3, 7] served as the database system in this study. Given a search request specified in some combination of first name, last name and affil- iation, PID displays a window with the requested in- formation (in this study, the information consisted of name, affiliation and all known telephone numbers). If an unknown name was entered, an error panel came up. If a query was underspecified, a choice panel con- taining all entries satisfying the query was shown; for example asking for "Smith" produced a panel show- ing all Smiths in the database. T h e existing PID was altered to incorporate a scroll window in addition to the already available keyboard and speech interfaces. The remainder of this section provides detailed de- scriptions for each input mode.
S p e e c h
Input
The OM system uses a hidden Markov model (I-IMM) recognizer based on Sphinx [2] and is capable of speaker-independent continuous speech recognition. The subject interacted with the system through a
NeXT computer which provided attention manage- ment [3] as well as application-specific displays. To offload computation, the recognition engine ran on a separate NeXT computer and communicated through
an ethernet connection. For the 731-word vocab-
ulary and perplexity 33 g r a m m a r used in the first experiment, the system responded in 2.1 times real- time (xRT). Database retrieval was by a c o m m a n d
phrase such as SHOW ME ALEX RUDNICKY. While sub- jects were instructed to use this specific phrase, the system also understood several variants, such as SHON, GIVE (ME), LIST, etc. T h e input protocol was "Push and Hold", meaning that the user had to depress the mouse button before beginning to speak and release it after the utterance was complete. Subjects were in- structed to keep repeating a spoken c o m m a n d in case of recognition error, until it was processed correctly and the desired information appeared in the result window.
K e y b o a r d
Subjects were required to click a field in a window then type a n a m e into it, followed by a carriage return (which would drop them to the next field or would ini- tial the retrieval). Three fields were provided: First
name, Last Name and Organization. Subjects were provided with some shortcuts: last names were often unique and might be sufficient for a retrieval. They were also informed about the use of a wildcard char- acter which would allow then to minimize the num- ber of keystrokes need for a retrieval. Ambiguous search patterns produced a panel of choices; the sub- ject could click on the desired one.
S c r o l l e r
The scroller window displayed the names in the database sorted alphabetically by last name. Eleven names were visible in the window at any one time, providing approximately 4-5% exposure of the 225
name list. T h e NeXT scroller provides a handle
and two arrow buttons for navigation. Clicks on the scrollbar move the window to the corresponding po- sition in the text and the arrow buttons can be am- plified to j u m p by page when a control key is simul- taneously depressed. Each navigation technique was demonstrated to the subject.
S e s s i o n c o n t r o l l e r
T h e experiment was controlled by a separate process visible to the subject as a window displaying a name to look up, a field in which to enter the retrieved information and a field containing special instruc-
tions such as P l e a s e u s e KEYBOARD o n l y or Use
any mode. The subject progressed through the ex- periment by clicking a b u t t o n in this window labeled
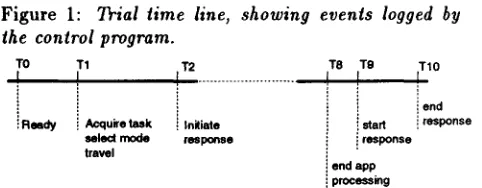
Figure 1:
the control program.
[image:2.612.322.563.52.146.2]TO T1 T2
...
! Reedy Acquke task i Initiate select mode response
travel
Trial time line, showing events logged by
T8 T9 iT10
I I
! i i end ! stad i response i i response
i end app
i processing
Next; this would display the next name to retrieve. Equidistant from the the Next b u t t o n were three win- dows corresponding to the three input modes used in the experiment: voice, k e y b o a r d and scroller. All modes required a mouse action to initiate input, ei- ther a click on the speech input button, a click on a text input field or b u t t o n in the keyboard window or the (direct) initiation of activity in the scroller.
I n s t r u m e n t a t i o n
All applications were instrumented to generate a stream of time-stamped events corresponding to user and system actions. Figure 1 shows the time line for a single trial. In addition to the overall time- line, each mode was also instrumented to generate logging events corresponding to significant internal events. All logged events were time-stamped using absolute system time, then merged in analysis to pro- duce a composite timeline corresponding to the entire experimental session.
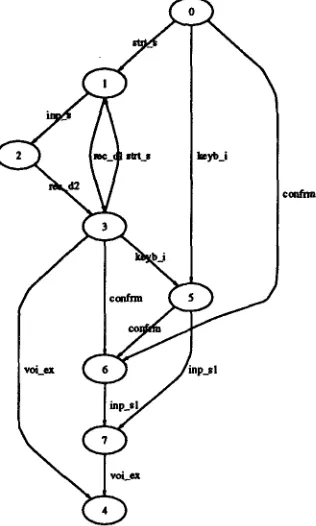
The merged event stream was processed using a hi- erarchical set of finite-state machines (FSMs). Fig- ure 2 shows the FSM for a single transaction with the database retrieval program. Figures 3 show the FSM for the voice mode. During the analysis pro- cess, the latter FSM (as well as FSMs for keyboard and scroller) would be invoked within state 1 of the transaction FSM (Figure 2). An intermediate level of analysis (corresponding to conditions) is also used to simplify analysis. Arcs in the FSMs correspond to observable events, either system outputs or user in- puts. T h e products of the analysis include transition frequencies for all arcs in an FSM as well as transi- tion times. T h e analysis can be treated in terms of Markov chains [6] to compactly describe recognition error, user-mode preferences and other system char- acteristics.
U S E R M O D E P R E F E R E N C E I N D A T A R E -
T R I E V A L
Figure 2: F S M f o r a single transaction. From the
initial state ( 0 ) the subject can click the Next button
to move to state 1 at which point the subject has a name to look up and can initiate a query. Queries are described by mode~specific F S M s which are invoked within this state. Figure 3 shows one such FSM. I f properly formed, a query will produce a database re- trieval and move the transaction to state 4. The sub- ject can opt to enter a response, moving the trans- action to state 2 or to repeat queries (by re-entering state 1). A t this point, the subject is ready to begin a new trial by transitioning to state O.
t_t
Figure 3: F S M used f o r the analysis of voice input.
¢0t~fllcn
were equally familiar with each of the input modes, the experiment was divided into two parts (although it was run as a single session, without breaks). In the first part, subjects were asked to perform 20 re- trievals using each mode. Initial testing determined that this was sufficient to acquaint the subjects with the operation of each mode. In the second part, they were instructed to use "any mode", with the expec- tation that they would choose on the basis of their assessment of the suitability of each mode. A total of 55 entries were presented in the second part.
The same sequence of 60 entries was used for the familiarization stage for all subjects. However, the order in which the subject was exposed to the differ- ent modes was counter-balanced according to a Latin square. Three different blocks of test items (each con- taining 55 entries) were used, for a total of nine dif- ferent combinations.
Details about the operation of the different modes as well as the experiment controller were explained to the subject during a practice session prior to the experiment proper (a total of four practice retrievals were performed by the subject in this phase).
S u b j e c t s
Nine subjects participated in this study, 7 male and 2 female. All had had some previous exposure to speech systems, primarily through their participation in on- going speech data collection efforts conducted by our research group. This prior exposure ensured that the subjects were familiar with the mechanics of using a microphone and of interacting with a computer by voice. No a t t e m p t was made to select on demographic characteristics or on computer skills. T h e group con- sisted primarily of students, none of whom however were members of our research group.
Results and Analysis
A finite state machine (FSM) description of user be- havior was used to analyze session data. Separate FSMs were defined for condition, transaction, se- quence and intra-modal levels and were used to tab- ulate metrics of interest.
[image:3.612.97.234.204.366.2] [image:3.612.84.242.406.669.2]Table 1: Times (in sec) for the familiarization blocks in the first experiment.
Mode
Scroller Keyboard Voice
I Utterance
Transaction Input duration
13.623 4.917 - -
14.526 5.371 - -
15.041 5.593 2.464
Table 2: User mode choices in the Free block (trials
8 1 - " 5 ) .
Transaction I First
Mode Choice (%) Choice (%)
Scroller Keyboard Voice mixed
14.3 21.8 48.3 15.5
14.7 22.4 62.8
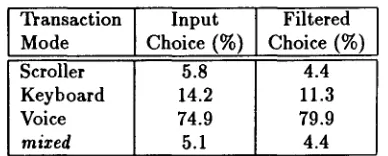
Table 3: User mode preference in the Free block of
the second experiment.
Transaction Input Filtered
Mode Choice (%) Choice (%)
Scroller 5.8 4.4
Keyboard 14.2 11.3
Voice 74.9 79.9
mixed 5.1 4.4
Table 4: Times (in see) for the second experiment
(using unfiltered data). The input time for voice is the utterance duration.
Mode I Transaction
Stroller 10.863
Keyboard 9.560
Voice 9.463
Input
4.394 3.035 2.078
i.e., having to repeat an input). Here speech is also at a disadvantage (though note that the duration of a single utterance is only 2.464 see). Transac- tion durations for modes are statistically different (F(2, 14) = 5.54, MS~rr = 0.836, p < 0.05), though in individual comparisons only voice and scroller dif- fer (p < 0.05, the Neuman-Keuls procedure was used for this and all subsequent comparisons). Order of presentation was a significant factor (F(2, 14) = 8.3, p < 0.01), with the first mode encountered requiring the greatest amount of time.
Table 2 shows choice of mode in the Free block. The mixed mode line refers to cases where subjects would first attempt a lookup in one mode then switch to an- other (for example because of misrecognition in the speech mode). The right-hand column in the table shows the first mode chosen in a mixed-mode transac- tion. In this case, voice is preferred 62.8% of the time as a first choice. The pattern of choices is statistically significant (F(2, 14) = 6.31,MSerr = 288,p < 0.01), with speech preferred significantly more than either keyboard or scroller(p < 0.05).
This experiment suggests that speech is the preferred mode of interaction for the task we examined. This is particularly notable since speech is the least efficient of the three modes offered to the user, as measured in traditional terms such as time-to-completion. Most previous investigations ( see, e.g. the review in [4]) have concentrated on this dimension, treating it as the single most important criterion for the suitabil-
ity of speech input. The present result suggests that other aspects of performance may be equally impor- tant to the user.
E X T E N D E D E X P E R I E N C E
One possible explanation of the above result is that it's due to a novelty effect. T h a t is, users displayed a preference for speech input in this task not because of any inherent preference or benefit but simply because it was something new and interesting. Over time we might expect the novelty to wear off and users to refo- cus their attention on system response characteristics and perhaps shift their preference.
To test this possibility, we performed a second exper- iment, scaling up the amount of time spent on a task by different amounts. Since it was not possible to
predict the length of a novelty effect a priori, three
separate experience levels were examined. A total of 9 subjects participated (4 male and 5 female): 3 did 720 trials, 3 did 1440 trials and 3 did 2160. This is in contrast to the 115 trials per subject in the first experiment.
M e t h o d
[image:4.612.343.537.76.154.2] [image:4.612.78.291.77.143.2] [image:4.612.84.282.192.271.2] [image:4.612.359.518.214.267.2]resulted in improved transaction times for these two modes relative to the scroller, which was unchanged except for a slight reduction in exposure (this due to an increase of the number of entries to 240, done to facilitate details of the design).
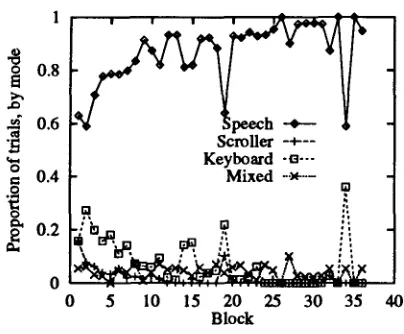
Figure 4: User preference over blocks (filtered data).
Note that the spikes at blocks 19 and 3~ are due to eqnipment failure.
O
O
1? 77
0.8
0.6
ScroUer -÷--
Keyboard -o---
o.5°"
°
'
o I
0 5 10 15 20 25 30 35
Block
40
R e s u l t s a n d A n a l y s i s
The mean preference for different modes in this ex- periment is shown in Table 3. Subjects display a strong bias in favor of voice input (74.9%). Prefer- ence for voice across individual subjects ranged from 28% to 91% with all but one subject ($3) showing preference levels above 70% (the median preference is 82.5%). Differences in mode preference are signifi- cant (F(2, 16) = 34.6, MSerr = 0.037,p < 0.01) and the preference is greater (p < 0.01) for voice than for either of the other input modes.
Since some of the names in the database were difficult to pronounce, we also tabulated choice data exclud- ing such names. Nineteen names (about 8% of the database) were excluded on the basis of ratings pro- vided by subjects. 1 The data thus filtered are shown in Table 3; in this case (for names that subjects were reasonably comfortable about pronouncing) prefer- ence for speech rises to 79.9% (median of 86.1%).
1 P a r t i c i p a n t s i n t h i s e x p e r i m e n t r a t e d e a c h n a m e i n t h e d a t a b a s e p r i o r t o t h e e x p e r i m e n t itself. A n a m e was p r e s e n t e d to t h e s u b j e c t , w h o w a s a s k e d t o r a t e o n a 4 - p o i n t scale t h e i r l a c k o f c o n f i d e n c e i n t h e i r a b i l i t y to p r o n o u n c e it. T h e y t h e n h e a r d a r e c o r d i n g o f t h e n a m e p r o n o u n c e d a s e x p e c t e d b y t h e
r e c o g n i z e r a n d finally r a t e d t h e d e g r e e to w h i c h t h e c a n o n i c a l p r o n u n c i a t i o n d i s a g r e e d w i t h t h e i r o w n e x p e c t a t i o n . A c o n s e r - v a t i v e c r i t e r i o n was u s e d to p l a c e n a m e s o n t h e e x c l u s i o n list:
a n y n a m e for w h i c h b o t h r a t i n g s a v e r a g e d over 1.0 ( o n a 0 - 3 scale) was e x c l u d e d .
Table 4 shows the mean transaction and input times for the second experiment, computed over subjects. Compared to the first experiment, these times are faster, probably reflecting the greater amount of ex- perience with the task for the second group of sub- jects. Transaction times are significantly different (F(2,16) = 16.8,MS~rr = 0.327,p < 0.01), with scroller times longer than keyboard or speech times (p < 0.01) which in turn are not different. If sub- jects were attending to the time necessary to carry out the task, keyboard and voice should have been chosen with about equal frequency. The subjects in this experiment nevertheless chose speech over key- board (and scroller) input.
Figure 4 shows preference for voice input over the course of the experiment. Preference for speech in- creases over time, and begins to asymptote at about 10-15 blocks (representing about 250 utterances). This phenomenon suggests that speech input, while highly appealing to the user requires a certain amount of confidence building, certainly a period of extended familiarization with what is after all a novel input mode. Additional investigation would be needed, however, to establish the accuracy of this observation. In any case, this last result underlines the importance of providing sufficient training.
As can be seen in Figure 4 that preference for speech shows no sign of decreasing over time for the duration examined in this experiment. Preference for voice input appears to be robust. The 36 block version of the experiment took on the average 8-9 hours to complete, with subjects working up to 2 hours per day.
A possible explanation for this finding may be that, rather than basing their choice on overall transaction time, users focus on simple input time (in both exper- iments voice input is the fastest). This would imply that users are willing to disregard the cost of recogni- tion error, at least for the error levels associated with the system under investigation. Data from followup experiments not reported here suggest that this may be the case: increasing the duration of the query ut- terance decreases the preference for speech.
C O N C L U S I O N
[image:5.612.98.300.173.340.2]ing a longer time on the task. This preference ap- pears to persist and even increase with continuing use, suggesting that preference for speech cannot be attributed to short-term novelty effects.
This paper also sketches an analysis technique based on F S M representations of human-computer interac- tion that permits rapid automatic processing of long event streams. The statistical properties of these event streams (as characterized by Markov chains) m a y provide insight into the types of information that users themselves compute in the course of developing satisfactory interaction strategies.
[9] TEAL, S. L., AND RUDNICKY, A. I. A perfor- mance model of system delay and user strategy selection. In
Proceedings of CHI
(Monterey, CA, M a y 1992), A C M , N e w York, 1992, pp. 295-206.R e f e r e n c e s
[I]
BIERMANN,
A. W., FINEMAN, L., AND HEI-DLAGE, J,
F. A voice- and touch-driven nat- ural language editor and its performance. In- ternational Journal of Man-Machine Studies 37(1992), 1-21.
[2] LEE, K.-F. Automatic Speech Recognition: The
Development of the SPHINX System. Kluwer
Academic Publishers, Boston, 1989.
[3] LUNATI, J.-M., AND RUDNICKY, A. I. The de- sign of a spoken language interface. In Proceedings of the Third Darpa Speech and Natural Language
Workshop (Hidden Valley, June 1990), Morgan
Kaufmann, San Mateo, CA, 1990, pp. 225-229.
[4] MARTIN, G. The utility of speech input in user- computer interfaces. International Journal of
Man-Machine Studies P9 (1989), 355-376.
[5] RUDNICKY, A. System response delay and user strategy selection in a spreadsheet task. CHI'90, invited poster, April 1990.
[6] RUDNICKY, A. I., AND HAUPTMANN, A. G. Models for evaluating interaction protocols in speech recognition. In Proceedings of CHI (New Orleans, Louisiana, April 1991), ACM, New York, 1991, pp. 285-291.
[7] RUDNICKY, A. I., LUNATI, J.-M., AND FRANZ, A . M . Spoken language recognition in an of- fice management domain. Proceedings of lCASSP
(May 1991), 829-832.
[8] RUDNICKY,
A. I.,SAKAMOTO,
M. H., AND PO- LIFRONI, J. H. Spoken language interaction ina spreadsheet task. In Human-Computer Inter-
action - INTERACT'90, D. Diaper et al., Eds.