R E S E A R C H
Open Access
Multispectral imaging using a stereo camera:
concept, design and assessment
Raju Shrestha
1*, Alamin Mansouri
2and Jon Yngve Hardeberg
1Abstract
This paper proposes a one-shot six-channel multispectral color image acquisition system using a stereo camera and a pair of optical filters. The two filters from the best pair, selected from among readily available filters such that they modify the sensitivities of the two cameras in such a way that they produce optimal estimation of spectral reflectance and/or color, are placed in front of the two lenses of the stereo camera. The two images acquired from the stereo camera are then registered for pixel-to-pixel correspondence. The spectral reflectance and/or color at each pixel on the scene are estimated from the corresponding camera outputs in the two images. Both simulations and experiments have shown that the proposed system performs well both spectrally and colorimetrically. Since it acquires the multispectral images in one shot, the proposed system can solve the limitations of slow and complex acquisition process, and costliness of the state of the art multispectral imaging systems, leading to its possible uses in widespread applications.
Introduction
With the development and advancement of digital cam-eras, acquisition and use of digital images have increased tremendously. Conventional image acquisition systems, which capture images into three color channels, usually red, green and blue, are by far the most commonly used imaging systems. However, these suffer from several limitations: these systems provide only color image, suf-fer from metamerism and are limited to visual range, and the captured images are environment dependent. Spectral imaging addresses these problems. Spectral imaging systems capture image data at specific wave-lengths across the electromagnetic spectrum. Based on the number of bands, spectral imaging systems can be divided into two major types: multispectral and hyper-spectral. There is no fine line separating the two; how-ever, spectral imaging systems with more than 10 bands are generally considered as hyperspectral, whereas with less than 10 are considered as multispectral. Hyperspec-tral imaging deals with imaging narrow specHyperspec-tral bands over a contiguous spectral range and produces the spec-tra of all pixels in the scene. Hyperspecspec-tral imaging sys-tems produce high measurement accuracy; however, the
acquisition time, complexity and cost of these systems are generally quite high compared to multispectral sys-tems. This paper is mainly focused on multispectral imaging. Multispectral imaging systems acquire images in relatively wider and limited spectral bands. They do not produce the spectrum of an object directly, and they rather use estimation algorithms to obtain spectral func-tions from the sensor responses. Multispectral imaging systems are still considerably less prone to metamerism [1] and have higher color accuracy, and unlike conven-tional digital cameras, they are not limited to the visual range, rather they can also be used in near infrared, infrared and ultraviolet spectrum as well [2-5] depend-ing on the sensor responsivity range. These systems can significantly improve the color accuracy [6-10] and make color reproduction under different illumination environments possible with reasonably good accuracy [11]. Multispectral imaging has wider application domains, such as remote sensing [12], astronomy [13], medical imaging [14], analysis of museological objects [15], cosmetics [16], medicine [17], high-accuracy color printing [18,19], computer graphics [20] and multimedia [21].
Despite all these benefits and applicability of multi-spectral imaging, its use is still not so wider. This is because of the limitations of the current state of the art multispectral imaging systems. There are different types * Correspondence: [email protected]
1
The Norwegian Color Research Laboratory, Gjøvik University College, Gjøvik, Norway
Full list of author information is available at the end of the article
of multispectral imaging systems, most of them are fil-ter-based which use additional filters to expand the number of color channels, and our interest in this paper is also in this type. In a typical filter-based imaging sys-tem, a set of either traditional optical filters in a filter wheel or a tunable filter [22-24] capable of many differ-ent configurations is employed. These multispectral ima-ging systems acquire images in multiple shots. A sensor used in a multispectral system may be a linear array as in CRISATEL [25] where the images are acquired by scanning line-by-line. With a matrix sensor (CCD or CMOS) like in a monochrome camera, a whole image scene can be captured at once without the need of scan-ning [23,26], but this still requires multiple shots, one channel at a time. A high quality trichromatic digital camera in conjunction with a set of appropriate optical filters makes it possible to acquire unique spectral infor-mation [4,27-32]. This method enables three channels of data to be captured per exposure as opposed to one. With a total ofncolored filters, there are 3n+ 3 camera responses for each pixel (including responses with no colored filters), correspondingly giving rise to a 3n + 3 channel multispectral images. This greatly increases the speed of capture and allows the use of technology that is readily and cheaply available. Such systems can be easily used even without much specialized knowledge. Nonetheless, multiple shots are still necessary to acquire a multispectral color image. Several systems have been proposed aiming to circumvent multi-shot requirements for a multispectral image acquisition.
Hashimoto [33] proposed a two-shot 6-band still image capturing system using a commercial digital cam-era and a custom color filter. The system captures a multispectral image in two shots, one with and one without the filter, thus resulting in a 6-channel output. The filter is custom designed in such a way that it cuts off the left side (short wavelength domain) of the peak of original spectral sensitivity of blue and red, and also cuts off the right side (long-wavelength domain) of the green. The proposed 6-channel system claimed to pro-duce high color accuracy and wider color range. The problem with this system is that it still needs two shots and is, therefore, incapable of capturing scenes in motion.
Ohsawa et al. [34] proposed a one-shot 6-band HDTV camera system. In their system, the light is divided into two optical paths by a half-mirror and is incident on two conventional CCD cameras after transmission through the specially designed interference filters inserted in each optical path. The two HDTV cameras capture three-band images in sync to compose each frame of the six band image. The total spectral sensitiv-ities of the six band camera are the combination of spectral characteristics of the optical components: the
objective lens, the half-mirror, the IR cutoff filter, the interference filters, the CCD sensors, etc. This system needs custom designed filters and complex optics mak-ing it still far from bemak-ing practical.
Even though our focus is mainly on filter-based sys-tems, some other non-filter-based systems proposed for faster multispectral acquisitions are worth mentioning here. Park et al. [35] proposed multispectral imaging using multiplexed LED illumination with computer-con-trolled switching, and they claimed to produce even multispectral videos of scenes at 30 fps. This is an alter-native strategy for multispectral capture more or less on the same level with using colored filters, although not useful for uncontrolled illumination environments. Three-CCD camera-based systems offering 5 or 7 chan-nels from FluxData Inc. [36] are available in the market. But, high price could be a concern for its common use. Langfelder et al. [37] proposed a filter-less and demo-saicking-less color sensitive device that use the trans-verse field detectors or tunable sensitivity sensors. However, this is still in the computational stage at the moment.
In this paper, we have proposed a fast and practical solution to multispectral imaging with the use of a digi-tal stereo camera or a pair of commercial digidigi-tal cam-eras joined in a stereoscopic configuration, and a pair of readily available optical filters. As the two cameras are in a stereoscopic configuration, the system allows us to capture 3D stereo images also. This makes the system capable of acquiring both the multispectral and 3D stereo data simultaneously.
The rest of the paper is organized as follows. We first present the proposed system along with its design, opti-mal filer selection, estimation methods and evaluation. The proposed system has been investigated through computational simulation, and an experimental study has been carried out by investigating the performance of the system constructed. The simulation and experimen-tal works and results are discussed next. Finally, we pre-sent the conclusion of the paper.
Proposed multispectral imaging with a stereo camera
Design and model
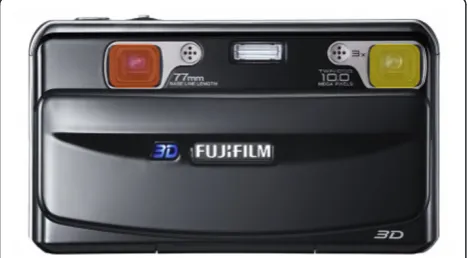
give optimal estimation of the scene spectral reflectance and/or the color. The two cameras need not be of same type, instead, any two cameras can be used in a stereo-scopic configuration, provided the two are operated in the same resolution. One-shot acquisition can be made possible by using two cameras with a sync controller available in the market. The proposed multispectral sys-tem is a faster, cheaper and practical solution, as it is the one-shot acquisition which can be constructed from even commercial digital cameras and readily available filters. Since the two cameras are in a stereoscopic con-figuration, the system is also capable of acquiring 3D image that provides added value to the system. 3D ima-ging in itself is an interesting area of study, and could be a large part of the study. This paper, therefore, focuses mainly on multispectral imaging, and 3D ima-ging has not been considered within its scope. Figure 1 illustrates a multispectral-stereo system constructed from a modern digital stereo camera - Fujifilm FinePix
REAL 3D W1 (Fujifilm 3D) and two optical filters in
front of the two lenses. We have used this system in our experimental study.
Selection of the filters can be done computationally using a filter selection method presented below in this section. The two images captured with the stereo cam-era are registered for the pixel-to-pixel correspondence through an image registration process. As an illustration, a simple registration method has been presented in this paper below. The subsequent combination of the images from the two cameras provides a six channel multispec-tral image of the acquired scene.
In order to model the proposed multispectral system, let sidenote the spectral sensitivity of theith channel,t
is the spectral transmittance of the selected filter, Lis the spectral power distribution of the light source, and Ris the spectral reflectance of the surface captured by the camera. As there is always acquisition noise intro-duced into the camera outputs, let n denotes the
acquisition noise. The camera response corresponding to the ith channelCi is then given by the multispectral
camera model as
Ci=STiDiag(L)R+ni; i= 1, 2,. . .,K, (1)
where Si = Diag(t)si, ni is the channel acquisition
noise, andKis the number of channels, which is 6 here in our system. For natural and man-made surfaces whose reflectance are more or less smooth, it is recom-mended to use as few channels as possible [38] and we study here with the proposed six channel system.
Optimal filters selection
Now, the next task at hand is on how to select an opti-mal filter pair for the construction of a proposed multi-spectral system. Several methods have been proposed for the selection of filters, particularly for multi-shot-based multispectral color imaging [26,39-41]. In our study, as we have to choose just two filters from a set of filters, the exhaustive search method is feasible and a logical choice because of its guaranteed optimal results. For selecting k(herek= 2) filters from the given set of n filters, the search requires P(n,k) = (n−n!k)! permuta-tions. When two same type of cameras (assuming the same spectral sensitivities) are used, the problem reduces to combinations instead of permutations, i.e.,
C(n,k) = k!(nn−!k)! combinations. The feasibility of the exhaustive search method thus depends on the number of sample filters. However, in order to extend the usabil-ity of this method for considerably large number of fil-ters, we introduce a secondary criterion which excludes all infeasible filter pairs from computations. This criter-ion states that the filter pairs that result in a maximum transmission factor of less than forty percent and less than ten percent of the maximum transmission factor in one or more channels are excluded.
For a given pair of camera, a pair of optimal filters is selected using this filter selection algorithm and the sec-ondary criterion through simulation, and the perfor-mance is then investigated experimentally.
Spectral reflectance estimation and evaluation
The estimated reflectance (R˜) is obtained for the corre-sponding original reflectance (R) from the camera responses for the training and test targets C(train)andC
respectively, using different estimation methods. Train-ing targets are the database of surface reflectance func-tions from which basis funcfunc-tions are generated and test targets are used to validate the performance of the device. There are many estimation algorithms proposed in the literature[28,30,42-46]. It is not our primary goal to make comparative study of different algorithms. However, we have tried to investigate the performance
Figure 1 Illustration of a multispectral-stereo system
of the proposed system with methods based on three major types of models: linear, polynomial and neural network. These models are described briefly below:
• Linear Model: A linear-model approach formu-lates the problem of the estimation of a spectral reflectance R˜ from the camera responsesC as find-ing a transformation matrix (or reconstruction matrix)Qthat reconstructs the spectrum from theK measurements as follows:
˜
R=QC. (2)
The matrixQthat minimizes a given distance metric
d(R,R˜)or that maximizes a given similarity metric
s(R,R˜)is determined.Linear regression(LR) method determines Q from the training data set using the pseudo-inverse:
Q=R(train)C+. (3)
The pseudo-inverse C+ may be difficult to compute and when the problem is ill-posed, it may not even give any inverse, so it may need to be regularized (see “Regularization”later).
There are several approaches proposed [28,42] which approximate R by linear combination of a small number of basis functions:
R≈Bw, (4)
where B is a matrix containing the basis functions obtained from the training data set, and w is a weight matrix. Different approaches have been pro-posed for computing w. We present and use the method proposed byImai and Berns (IB) [28] which was found to be relatively more robust to noise. This method assumes a linear relationship between camera responses and the weights that represent reflectance in a linear model:
w=MC, (5)
where M is the transformation matrix which can be determined empirically via a least-square fit as
M=wC+. (6)
wis computed from Equation 4 as
w=B−1R(train)=BTR(train). (7)
The reflectance of the test target is then estimated using
˜
R=Bw=BMC(test)=BwC+(train)C(test)=BBTR(train)C+(train)C(test). (8)
• Polynomial Model (PN): With this model, the reflectance R of the characterization data set is directly mapped from the camera responses C through a linear relationship with thendegree poly-nomials of the camera responses [45,47]:
R(λ1) =m11C1+m12C2+m13C3+m14C1C2+· · ·
R(λ2) =m21C1+m22C2+m23C3+m24C1C2+· · · ..
. ...
R(λN) =mN1C1+mN2C2+mN3C3+mN4C1C2+· · · (9)
It can be written in a matrix form as
R=MCp, (10)
whereMis the matrix formed from the coefficients, and Cp is the polynomial vector/matrix from n
degree polynomials of the camera responses as (C1,C2,C3,C21,C1C2,C1C3,C2C3,. . .)T. The polyno-mial degree nis determined through optimization such that the estimation error is minimized. Com-plete or selected polynomial terms (for example, polynomial without crossed terms) could be used depending on the application. Transformation matrix Mis determined from the training data set using
M=RC+p(train). (11)
Substituting the computed matrixMin Equation 10, the reflectance of the test target is estimated as
˜
R(test)=RC+p(train)Cp(test). (12)
Since non-linear method of mapping camera responses onto reflectance values may cause over-fit-ting the characterization surface, regularization can be done as described in the subsection below to solve this problem.
The neural network is trained with the training data set using Delta rule also known as Widrow-Hoff rule. The rule continuously modifies weights w to reduce the difference (the Delta) between the expected output value eand the actual outputoof a neuron. This rule changes the connection weights in the way that minimizes the mean squared error of the neuron between an observed response oand a desired theoretical one like:
wtij+1=wtij+η(ej−oj)xi=wtij+wij, (13)
where eis the expected response,tis the number of iteration, and h is a learning rate. The weights w thus computed is finally used to estimate the reflec-tance of the test target using
˜
R=wC(test). (14)
In addition to the methods described previously, we have also tested some other methods like Maloney and Wandell, and Least-Squares Wiener; however, they are not included as they are considerably less robust to noise.
The estimated reflectances are evaluated using spectral as well as colorimetric metrics. Two different metrics: GFC (Goodness of Fit Coefficient)[48] and RMS (Root Mean Square) error have been used as spectral metrics, andE∗ab(CIELAB Color Difference) as the colorimetric metric. These metrics are given by the equations:
GFC = n i=1
R(λi)R˜(λi)
n i=1
R(λi)2
n i=1 ˜
R(λi)2
(15)
RMS =
1
n n
i=1
R(λi)− ˜R(λi)
2
(16)
E∗ab=
(L∗)2+ (a∗)2+ (b∗)2 (17)
The GFC ranges from 0 to 1, with 1 corresponding to the perfect estimation. The RMS andE∗abare positive values from 0 and higher, with 0 corresponding to the perfect estimation.
Regularization
Regularization introduces additional information in an inverse problem in order to solve an ill-posed problem or to prevent over-fitting. Non-linear method of map-ping camera responses onto reflectance values is the potential for over-fitting the characterization surfaces.
Over-fitting is caused when the number of parameters in the model is greater than the number of dimensions of variation in the data. Among many regularization methods, Tikhonov regularization is the most commonly used method of regularization which tries to obtain reg-ularized solution to Ax=b by choosing xto fit data b in least-square sense, but penalize solutions of large norm [49,50]. The solution will then be the minimiza-tion problem:
xα= argmin||Ax−b||2+ α||x||2 (18)
= (ATA+αI)−1ATb (19)
where a > 0 is called the regularization parameter whose optimal values are determined through optimiza-tion for minimum estimaoptimiza-tion errors.
Registration
In order to have accurate estimation of spectral reflec-tance and/or color in each pixel of a scene, it is very important for the two images to have accurate pixel-to-pixel correspondence. In other words, the two images must be properly aligned. However, the stereo images captured from the stereo camera are not aligned. We, therefore, need to align the two images from the stereo pair, the process known as image registration. Different techniques could be used for the registration of the stereo images. One technique could be the use of a stereo-matching algorithm [51-54]. Here, we go for a simple manual approach [55]. In this method, we select some (at least 8) corresponding points in the two images as control points, considering the left image as the base/ reference image and the right image as the unregistered image. Based on the selected control points, an appro-priate transformation that properly aligns the unregis-tered image with the base image is determined. And then, the unregistered image is registered using this transformation. Irrespective of the registration method, the problem of occlusion might occur in the stereo images due to the geometrical separation of the two lenses of the stereo camera. As we use central portion of the large patches, this simple registration method works well for our purpose. However, we should note that the correct registration is very important for accu-rate reflectance estimation. If there is misregistration leading to the incorrect correspondence in the two images, this may lead to wide deviation in the reflec-tance estimation especially in and around the edges where the image difference could be significantly large.
Experiments
experimentally. This section presents the simulation and experimental setups and results obtained.
Simulation setup
Simulation has been carried out with different stereo camera pairs whose spectral sensitivities are known or measured. The simulation takes a pair of filters one at a time, computes the camera responses using Equation 1, obtains the estimated spectral reflectance using four dif-ferent spectral estimation methods and evaluates the estimation errors (spectral and colorimetric) as dis-cussed previously. Similarly, the spectral reflectances are also estimated with 3-channel systems, where one cam-era (left or right) from the stereo is used.
As there is always acquisition noise introduced into the camera outputs, in order to make the simulation more realistic, simulated random shot noise and quanti-zation noise are introduced. Recent measurements of noise levels in a trichromatic camera suggest that the realistic levels of shot noise are between 1 and 2% [56]. Therefore, 2% normally distributed Gaussian noise is introduced as a random shot noise in the simulation. And, 12-bit quantization noise is incorporated by directly quantizing the simulated responses after the application of the shot noise.
The simulation study has been conducted with a pair of Nikon D70 cameras, Nikon D70 and Canon 20D pair, and Fujifilm 3D stereo camera. Previously measured spectral sensitivities of the Nikon D70 and Canon 20D cameras are used, and those of the Fujifilm 3D camera are measured using Bentham TMc300 monochromator. Figure 2 shows these spectral sensitivities. Two hundred and sixty-five optical filters of three different types: exci-ter, dichroic, and emitter from Omega are used.
Transmittances of the filters available in the company web site [57] have been used in the simulation. Rather than mixing filters from different vendors, one vendor has been chosen as a one-point solution for the filters, and the Omega has been chosen as they have a large selection of filters, and data are available online. Sixty-three patches of the Gretag Macbeth Color Checker DC have been used as the training target; and one hundred and twenty-two patches remained after omitting the outer surrounding achromatic patches, multiple white patches at the center, and the glossy patches in the S-column of the DC chart have been used as the test tar-get. The training patches have been selected using linear distance minimization method (LDMM) proposed by Pellegri et al. [58]. A color whose associated system out-put vector has maximum norm among all the target col-ors is selected first. The method then chooses the colcol-ors of the training set iteratively based on their distances from those already chosen; the maximum absolute dif-ference is used as the distance metric.
The same spectral power distribution of the illuminant and the reflectances of the color checkers measured and used in the experiment later are used in the simulation. The spectral reflectances are estimated using the four estimation methods: LR, IB, PN and NN methods described previously. The type and the degree of poly-nomials in PN method are determined through optimi-zation for minimum estimation errors, and we found that the 2 degree polynomials without cross-terms pro-duce the best results. The estimated reflectances are evaluated using three evaluation metrics: GFC, RMS and E∗abdescribed previously. CIE 1964 10° color matching functions are used for color computation as it is the
400 450 500 550 600 650 700 0
0.1 0.2 0.3 0.4 0.5 0.6 0.7 0.8 0.9 1
Wavelength, λ, [nm]
Sensitivity
R G B R G B
400 450 500 550 600 650 700 0
0.1 0.2 0.3 0.4 0.5 0.6 0.7 0.8 0.9 1
Wavelength, λ, [nm]
Sensitivity
R G B R G B
(a) (b)
Figure 2Normalized spectral sensitivities of the cameras:aNikon D70 (solid) and Canon 20D (dotted).bFujifilm 3D (Left-solid,Right
logical choice for each color checker patches subtends more than 2° from the lens position. The best pair of fil-ters is exhaustively searched as discussed in theOptimal Filters Selectionsection, according to each of the evalua-tion metrics, from among all available filters with which the multispectral system can optimally estimate the reflectances of the 122 test target patches. The results corresponding to the minimum mean of the evaluation metrics are obtained. To speed up the process, the filter combinations not fulfilling the criterion described in the same section are skipped. The 265 filters lead to more than 70,000 possible permutations (for two different cameras). The criterion introduced reduces the proces-sing down to less than 20,000 permutations.
Simulation results
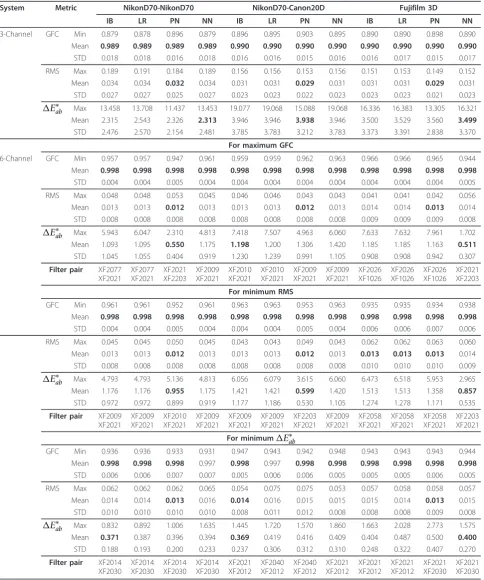
The simulation selects optimal pairs of filters from among the 265 filters for the three camera setups depending on the estimation methods and the evalua-tion metrics. Table 1 shows these selected filters along with the statistics (maximum/minimum, mean and stan-dard deviation) of estimation errors in all the cases for both the 6-channel and the 3-channel systems. These filters selected by the simulation are considered optimal and used as the basis of selection of filters to be used in the construction of the proposed multispectral system in the experiments. The NkonD70, Canon20D and Left camera of Fujifilm 3D are used for the simulation of the 3-channel systems.
In the simulation of the NikonD70-NikonD70 camera system, the IB and the LR methods selected the filter pair (XF2077-XF2021), the PN selected the filter pair (XF2021-XF2203), and the NN picked the filter pair (XF2009-XF2021) for the maximum GFC, with the aver-age mean value of 0.998. For the minimum RMS, the IB, the LR and the NN selected the filter pair (XF2009-XF2021), while the PN selected the filter pair (XF2010-XF2021) with the average mean value of 0.013. All four methods selected the filter pair (XF2014-XF2030) for the minimumE∗abwith the average mean error value of 0.387. The average mean values of GFC, RMS andE∗ab
from all four methods (IB,LR,PN and NN) for the 3-channel system (NikonD70) are 0.989, 0.033 and 2.374, respectively.
With the NikonD70-Canon20D camera system, the IB and the LR selected the filter pair (XF2010-XF2021), and the PN and the NN selected the filter pair (XF2009-XF2021) for the maximum GFC, with the average mean value of 0.998. For the minimum RMS, the IB, the LR and the NN picked the filter pair (XF2009-XF2021), while th PN selected the filter pair (XF2203-XF2021) with the average mean value of 0.013. Similarly, the IB and the NN selected the filter pair (XF2021-XF2012),
and the LR and the PN picked the filter pair (XF2040-XF2012) for the minimumE∗abwith the average value of 0.403. The average values of GFC, RMS andE∗ab
from all four methods for the 3-channel system (Canon20D) are 0.99, 0.031 and 3.944, respectively.
Similarly, with the Fujifilm 3D camera system, the IB, the LR and the PN selected the filter pair (XF2026-XF1026), and the NN selected the filter pair (XF2021-XF2203) for the maximum GFC, with the average mean value of 0.998. For the minimum RMS, the IB, the LR and the PN picked the filter pair (XF2058-XF2021), while the NN picked the filter pair (XF2203-XF2021) with the average mean value of 0.013. And, for the mini-mumE∗ab, the IB and the LR selected the filter pair (XF2021-XF2012), and the PN and the NN selected the filter pair (XF2021-XF2030) with the average mean value of 0.448. The average values of GFC, RMS and E∗abfrom all four methods for the 3-channel system (left camera) are 0.99, 0.031 and 3.522, respectively.
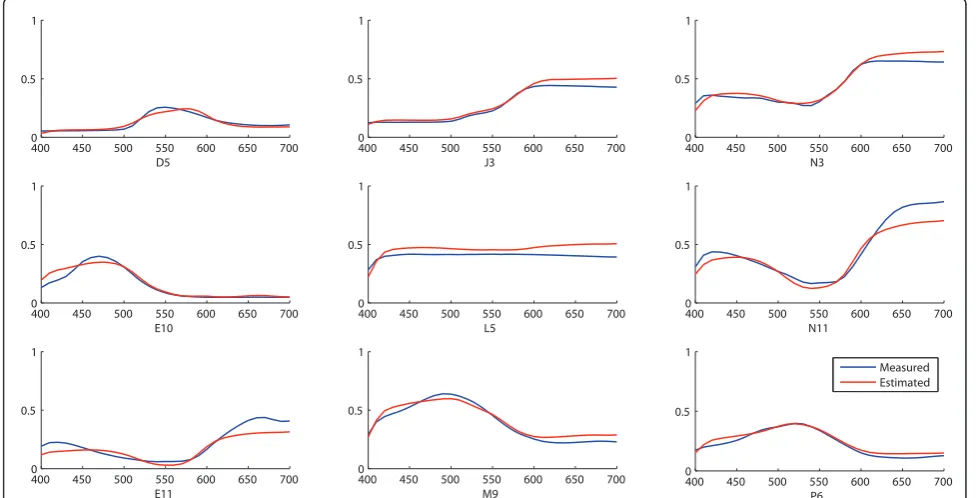
Now, we would like to illustrate the filters and the resulting 6-channel sensitivities of the simulated multi-spectral imaging systems. As we have seen, for a given camera system, different methods selected different filter pairs depending on the estimation method and the eva-luation metric. However, the shapes of the filter pairs and the resulting effective channel sensitivities are very much similar. Therefore, in order to avoid excessive number of figures, instead of showing figures for all cases, we are giving the figures for the Fujifilm 3D cam-era system as illustrations, as our experiments have been performed with this system along with the filter pair (XF2021-XF2030) selected by the neural network method for minimum color error. Figure 3a shows the transmittances of this filter pair, and Figure 3b shows the resulting 6-channel normalized effective spectral sensitivities of the multispectral system. Figure 4 shows the estimated spectral reflectances with this system along with the measured reflectances of randomly picked 9 patches from among the 122 test patches selected as described previously in theSimulation Setup section. The patch numbers are given below the graphs. Figure 5 shows the estimated spectral reflectances obtained with the 3-channel system for the same 9 test patches, also along with the measured reflectance.
Experimental setup
Table 1 Statistics of estimation errors produced by the simulated systems
System Metric NikonD70-NikonD70 NikonD70-Canon20D Fujifilm 3D
IB LR PN NN IB LR PN NN IB LR PN NN
3-Channel GFC Min 0.879 0.878 0.896 0.879 0.896 0.895 0.903 0.895 0.890 0.890 0.898 0.890
Mean 0.989 0.989 0.989 0.989 0.990 0.990 0.990 0.990 0.990 0.990 0.990 0.990
STD 0.018 0.018 0.016 0.018 0.016 0.016 0.015 0.016 0.016 0.017 0.015 0.017
RMS Max 0.189 0.191 0.184 0.189 0.156 0.156 0.153 0.156 0.151 0.153 0.149 0.152
Mean 0.034 0.034 0.032 0.034 0.031 0.031 0.029 0.031 0.031 0.031 0.029 0.031
STD 0.027 0.027 0.025 0.027 0.023 0.023 0.022 0.023 0.023 0.023 0.021 0.023
E∗ab Max 13.458 13.708 11.437 13.453 19.077 19.068 15.088 19.068 16.336 16.383 13.305 16.321
Mean 2.315 2.543 2.326 2.313 3.946 3.946 3.938 3.946 3.500 3.529 3.560 3.499
STD 2.476 2.570 2.154 2.481 3.785 3.783 3.212 3.783 3.373 3.391 2.838 3.370
For maximum GFC
6-Channel GFC Min 0.957 0.957 0.947 0.961 0.959 0.959 0.962 0.963 0.966 0.966 0.965 0.944
Mean 0.998 0.998 0.998 0.998 0.998 0.998 0.998 0.998 0.998 0.998 0.998 0.998
STD 0.004 0.004 0.005 0.004 0.004 0.004 0.004 0.004 0.004 0.004 0.004 0.005
RMS Max 0.048 0.048 0.053 0.045 0.046 0.046 0.043 0.043 0.041 0.041 0.042 0.056
Mean 0.013 0.013 0.012 0.013 0.013 0.013 0.012 0.013 0.014 0.014 0.013 0.014
STD 0.008 0.008 0.008 0.008 0.008 0.008 0.008 0.008 0.009 0.009 0.009 0.008
E∗ab Max 5.943 6.047 2.310 4.813 7.418 7.507 4.963 6.060 7.633 7.632 7.961 1.702
Mean 1.093 1.095 0.550 1.175 1.198 1.200 1.306 1.420 1.185 1.185 1.163 0.511
STD 1.045 1.055 0.404 0.919 1.230 1.239 0.991 1.105 0.908 0.908 0.942 0.307
Filter pair XF2077 XF2021
XF2077 XF2021
XF2021 XF2203
XF2009 XF2021
XF2010 XF2021
XF2010 XF2021
XF2009 XF2021
XF2009 XF2021
XF2026 XF1026
XF2026 XF1026
XF2026 XF1026
XF2021 XF2203
For minimum RMS
GFC Min 0.961 0.961 0.952 0.961 0.963 0.963 0.953 0.963 0.935 0.935 0.934 0.938
Mean 0.998 0.998 0.998 0.998 0.998 0.998 0.998 0.998 0.998 0.998 0.998 0.998
STD 0.004 0.004 0.005 0.004 0.004 0.004 0.005 0.004 0.006 0.006 0.007 0.006
RMS Max 0.045 0.045 0.050 0.045 0.043 0.043 0.049 0.043 0.062 0.062 0.063 0.060
Mean 0.013 0.013 0.012 0.013 0.013 0.013 0.012 0.013 0.013 0.013 0.013 0.014
STD 0.008 0.008 0.008 0.008 0.008 0.008 0.008 0.008 0.010 0.010 0.010 0.009
E∗ab Max 4.793 4.793 5.136 4.813 6.056 6.079 3.615 6.060 6.473 6.518 5.953 2.965
Mean 1.176 1.176 0.955 1.175 1.421 1.421 0.599 1.420 1.513 1.513 1.358 0.857
STD 0.972 0.972 0.899 0.919 1.177 1.186 0.530 1.105 1.274 1.278 1.171 0.535
Filter pair XF2009 XF2021
XF2009 XF2021
XF2010 XF2021
XF2009 XF2021
XF2009 XF2021
XF2009 XF2021
XF2203 XF2021
XF2009 XF2021
XF2058 XF2021
XF2058 XF2021
XF2058 XF2021
XF2203 XF2021
For minimumE∗ab
GFC Min 0.936 0.936 0.933 0.931 0.947 0.943 0.942 0.948 0.943 0.943 0.943 0.944
Mean 0.998 0.998 0.998 0.997 0.998 0.997 0.998 0.998 0.998 0.998 0.998 0.998
STD 0.006 0.006 0.007 0.007 0.005 0.006 0.006 0.005 0.005 0.005 0.006 0.005
RMS Max 0.062 0.062 0.062 0.065 0.054 0.075 0.075 0.053 0.057 0.058 0.058 0.057
Mean 0.014 0.014 0.013 0.016 0.014 0.016 0.015 0.015 0.015 0.014 0.013 0.015
STD 0.010 0.010 0.010 0.010 0.008 0.011 0.012 0.008 0.008 0.008 0.009 0.008
E∗ab Max 0.832 0.892 1.006 1.635 1.445 1.720 1.570 1.860 1.663 2.028 2.773 1.575
Mean 0.371 0.387 0.396 0.394 0.369 0.419 0.416 0.409 0.404 0.487 0.500 0.400
STD 0.188 0.193 0.200 0.233 0.237 0.306 0.312 0.310 0.248 0.322 0.407 0.270
Filter pair XF2014 XF2030
XF2014 XF2030
XF2014 XF2030
XF2014 XF2030
XF2021 XF2012
XF2040 XF2012
XF2040 XF2012
XF2021 XF2012
XF2021 XF2012
XF2021 XF2012
XF2021 XF2030
XF2021 XF2030
the filters for the experiment. As we have already seen, different estimation algorithms pick different filter pairs which also depend on the evaluation metrics. However, the shapes of the filter pairs selected and the resulting 6-channel sensitivities look very much similar. The results from the all four methods and the three metrics are also quite similar as can be seen in the Table 1. Results also show that minimizingE∗abalso produces more or less similar mean GFC and RMS values with all four methods for all three camera setups. We, therefore, decided to go for the filter pair (XF2021-XF2030) that produced the minimumE∗abby the neural network method. The multispectral camera system has been built by placing the XF2021 filter in front of the left lens and the XF2030 filter in front of the right lens of the cam-era. Throughout the whole experiment, the camera has been set to a fixed configuration (mode: manual, flash: off, ISO: 100, exposure time: 1/60s, aperture: F3.7, white balance: fine, 3D file format: MPO, image size: 3648 × 2736). The left camera has been used for the 3-channel system.
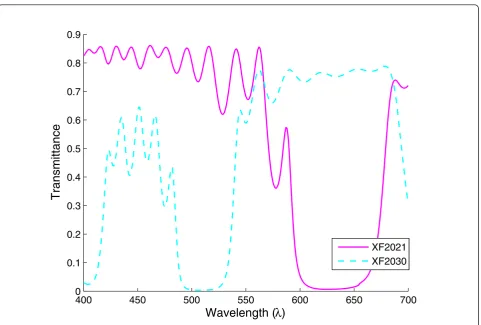
The spectral sensitivities of the Fujifilm 3D were mea-sured using the Bentham TMc300 monochromator, and the monochromatic lights have been measured with the calibrated photo diode provided with the monochroma-tor. The spectral power distribution of the light source (Daylight D50 simulator, Gretag Macbeth SpectraLight III) under which the experiments have been carried out has been measured with the Minolta CS-1000 spectrora-diometer. The transmittances of the filters have also been measured with the spectroradiometer. Figure 6 shows the measured transmittances of the filter pair (XF2021-XF2030). We can see some differences in the shapes of the filters from the one used in the simulation
with the transmittance data provided by the manufac-turer (see Figure 3a).
In order to investigate the performance of the system, as in the simulation, the same 63 patches of the Gretag Macbeth Color Checker DC has been used as the train-ing target and 122 patches have been used as the test target. Spectral reflectances of the color chart patches have been measured with the X-Rite Eye One Pro spec-trophotometer. Both the left and the right cameras have been corrected for linearity, DC noise and non-uniformity.
The system then acquired the images of the color chart. To minimize the statistical error, each acquisition has been made 10 times and the averages of these 10 acquisitions are used in the analysis. The images from the left and the right cameras are registered using the method discussed earlier, and the 3-channel and the 6-channel responses for each patch are obtained by chan-nel wise averaging of the central area of certain size from the patch. The camera responses thus obtained are then used for spectral estimations using the same four different estimation methods, and the spectral and the colorimetric estimation errors are evaluated similarly as in the simulation.
Experimental results
The statistics of estimation errors obtained from the experiment with both the 6-channel and the 3-channel systems for all the four estimation methods and the three evaluation metrics are given in Table 2. We can see that all the four methods produce almost the similar results. For instance, the NN method produces the mean GFC, RMS andE∗abvalues of 0.992,0.036 and 4.854, respec-tively, with the 6-channel system. The corresponding
400 450 500 550 600 650 700 0
0.1 0.2 0.3 0.4 0.5 0.6 0.7 0.8 0.9 1
Wavelength (λ)
Transmittance
XF2021 XF2030
400 450 500 550 600 650 700 0
0.1 0.2 0.3 0.4 0.5 0.6 0.7 0.8 0.9 1
Wavelength (λ)
Sensitivity R
G B R G B
(a) (b)
400 450 500 550 600 650 700 0
0.5 1
D5
400 450 500 550 600 650 700
0 0.5 1
J3
400 450 500 550 600 650 700
0 0.5 1
N3
400 450 500 550 600 650 700
0 0.5 1
E10
400 450 500 550 600 650 700
0 0.5 1
L5
400 450 500 550 600 650 700
0 0.5 1
N11
400 450 500 550 600 650 700
0 0.5 1
E11
400 450 500 550 600 650 700
0 0.5 1
M9
400 450 500 550 600 650 700
0 0.5 1
P6
Measured Estimated
Figure 4Estimated and measured spectral reflectances of 9 randomly picked test patches obtained with the simulated 6-channel multispectral system.
400 450 500 550 600 650 700
0 0.5 1
D5
400 450 500 550 600 650 700
0 0.5 1
J3
400 450 500 550 600 650 700
0 0.5 1
N3
400 450 500 550 600 650 700
0 0.5 1
E10
400 450 500 550 600 650 700
0 0.5 1
L5
400 450 500 550 600 650 700
0 0.5 1
N11
400 450 500 550 600 650 700
0 0.5 1
E11
400 450 500 550 600 650 700
0 0.5 1
M9
400 450 500 550 600 650 700
0 0.5 1
P6
Measured Estimated
mean metric values produced with the NN method for the 3-channel system are 0.988, 0.063 and 9.126, respectively.
To illustrate the results graphically, the estimated spectral reflectance of the same 9 test patches used in the simulation above along with the measured reflec-tance are shown in Figure 7. Similarly, Figure 8 shows the estimated and measured reflectances of the same patches obtained with the 3-channel system.
Discussion on the results
We have investigated the proposed multispectral system with both the simulation and the real experiments. The simulation determines the optimal pair of filters from among 265 filters for a given camera setup. The results show that the selected optimal filter pairs depend on the evaluation metric used (GFC, RMS andE∗ab). This is quite expected as colorimetric optimization not necessa-rily optimize spectrally and vice versa; since more than one spectrum can produce the same color, the phenom-enon known as metamerism. For a given camera setup and a selected metric, most of the estimation methods selected the same pair of filters. Even though some others selected the different pairs, we find that they are very similar in the type and the shape, and hence, all
four methods produce similar performances. The results also show similar performances from both the spectral metrics GFC, and RMS.
The simulation results show that the proposed 6-channel multispectral system outperforms classical 3-channel camera systems, both spectrally and colorime-trically. The improvements are significant, for instance, with the increase in the mean GFC from 0.99 to 0.998, decrease in the RMS error from 0.031 down to 0.014 and decrease in theE∗abfrom 3.499 down to 0.4 in the case of Fujifilm 3D with the neural network method. The results are similar with the other camera systems and the estimation methods. It is to be noted that the improvement strictly depends on the choice of the fil-ters; badly chosen filters may lead to the system which might fail to work better. The estimated spectral reflec-tances with the 6-channel system, as can be seen in the Figure 4, is significantly closer to the original ones com-pared to the estimation results in the case of 3-channel system shown in the Figure 5. The simulation results, thus, show promising results clearly indicating that the proposed system built with two RGB cameras or a stereo camera and a pair of appropriate filters can func-tion well as a multispectral system.
400 450 500 550 600 650 700
0 0.1 0.2 0.3 0.4 0.5 0.6 0.7 0.8 0.9
Wavelength (
λ
)
Transmittance
XF2021 XF2030
Encouraged by the promising results from the simula-tion, we performed real experiments for validation. As explained previously, the experiments have been carried out with the multispectral system built with the Fujifilm
3D camera and the optimal filter pair (XF2021-XF2030) selected by the simulation for minimumE∗abwith the neural network method. Experimental results also show that the proposed 6-channel multispectral system con-sistently performs better than the 3-channel system both spectrally and colorimetrically in terms of mean metric values. As in the simulation, all four estimation methods produced better results for all three metrics with the 6-channel multispectral system than with the 3-6-channel system. For instance, in case of Fujifilm 3D camera sys-tem, GFC is increased from 0.988 to 0.992, RMS is reduced from 0.063 down to 0.036, andE∗abis reduced from 9.126 down to 4.854 with the neural network method. All other estimation methods also produced similar results. The minimum value 4.733 of E∗ab
obtained with the PN method is still quite high and considerably higher than the simulation result. One rea-son could be the limited noise consideration in the simulation model, where we used the random shot noise and the quantization noise only, whereas in reality there could be many other noises that come into play in real cameras. We have investigated the influence of noise on the performance in the simulation with the Fujifilm 3D camera, and we found thatE∗abincreases almost line-arly with the increase in the percentage of shot noise from 0 to 20%. Also, we have already seen some differ-ences in the measured filter transmittances from the ones used in the simulation. In order to see the perfor-mance change, we have done simulation again this time Table 2 Statistics of estimation errors produced by the
experimental system
System Metric IB LR PN NN
3-Channel GFC Min 0.868 0.868 0.772 0.868 Mean 0.988 0.988 0.982 0.988
STD 0.018 0.018 0.037 0.018
RMS Max 0.171 0.171 0.161 0.171
Mean 0.063 0.063 0.051 0.063
STD 0.034 0.034 0.031 0.034
E∗ab Max 23.665 23.664 24.931 23.664
Mean 9.126 9.126 8.582 9.126
STD 4.520 4.520 4.741 4.520
6-Channel GFC Min 0.885 0.884 0.898 0.870
Mean 0.992 0.992 0.993 0.992
STD 0.013 0.013 0.012 0.014
RMS Max 0.160 0.161 0.154 0.165
Mean 0.036 0.036 0.036 0.036
STD 0.023 0.023 0.023 0.023
E∗ab Max 15.033 14.773 13.358 12.135
Mean 5.069 5.030 4.733 4.854
STD 2.680 2.655 2.527 2.595
The maximum mean GFC, and the minimum mean RMS andE∗abvalues from among the different estimation methods are shown in bold.
400 450 500 550 600 650 700
0 0.5 1
D5
400 450 500 550 600 650 700
0 0.5 1
J3
400 450 500 550 600 650 700
0 0.5 1
N3
400 450 500 550 600 650 700
0 0.5 1
E10
400 450 500 550 600 650 700
0 0.5 1
L5
400 450 500 550 600 650 700
0 0.5 1
N11
400 450 500 550 600 650 700
0 0.5 1
E11
400 450 500 550 600 650 700
0 0.5 1
M9
400 450 500 550 600 650 700
0 0.5 1
P6
Measured Estimated
with the measured transmittances of the filters and this produces theE∗abof 1.428 with the same neural net-work method that produced the minimum value of 0.4 in the previous simulation. This also explains some higher values in the experimental results. We should note here that the performance of the system highly depends on the filters and their correct transmittance values. Moreover, we have to note that the Fujifilm 3D camera we used has limited control; there is no manual focus and the camera does not support the raw data. It has its own white balancing and interpolation algo-rithms. Even though we have used the fixed setting of the camera during the whole experiment including the characterization and all image acquisitions, the acquired images are still subject to built-in preprocessing and optical changes. This might also have influenced the results leading to higher estimation errors. We believe that the performance can surely be improved with more controllable camera.
Conclusion
In this paper, we have proposed a one-shot multispec-tral imaging system built with a stereo camera. The pro-posed system is simple to construct from commercial off-the-shelf digital cameras, and a pair of filters selected from readily available filters in the market. The system, therefore, could be a fast, practical and cheaper solution to multispectral imaging, useful in a variety of applica-tions. Both the simulation and experimental results
show that the proposed 6-channel multispectral system performs significantly better than the traditional 3-chan-nel cameras both spectrally and colorimetrically. More-over, stereo configuration allows acquiring stereo 3D images simultaneously along with the multispectral image, and this could be an interesting further work.
Acknowledgements
The authors would like to thank Omega Optical, Inc. for providing the optical filters for this study.
Author details
1The Norwegian Color Research Laboratory, Gjøvik University College, Gjøvik,
Norway2Laboratory Le2i, UMR CNRS 5158, University of Burgundy, Dijon, France
Competing interests
The authors declare that they have no competing interests.
Received: 1 April 2011 Accepted: 12 September 2011 Published: 12 September 2011
References
1. M Yamaguchi, T Teraji, K Ohsawa, T Uchiyama, H Motomura, Y Murakami, N Ohyama, Color Imaging: Device-Independent Color, inColor Hardcopy, and Applications VII, Volume 4663 of SPIE Proceedings. Color Image Reproduction Based on the Multispectral and Multiprimary Imaging: Experimental Evaluation. 15–26 (2002)
2. MH Horman, Temperature analysis from multispectral infrared data. Appl Opt.15(9), 2099–2104 (1976). doi:10.1364/AO.15.002099
3. GP Ellrod, BH Connell, DW Hillger, Improved detection of airborne volcanic ash using multispectral infrared satellite data. J Geophys Res.108(D12), 4356–4369 (2003)
4. HH Huang, inAsian Association on Remote Sensing (ACRS), (Acquisition of Multispectral Images Using Digital Cameras, 2004)
400 450 500 550 600 650 700
0 0.5 1
D5
400 450 500 550 600 650 700
0 0.5 1
J3
400 450 500 550 600 650 700
0 0.5 1
N3
400 450 500 550 600 650 700
0 0.5 1
E10
400 450 500 550 600 650 700
0 0.5 1
L5
400 450 500 550 600 650 700
0 0.5 1
N11
400 450 500 550 600 650 700
0 0.5 1
E11
400 450 500 550 600 650 700
0 0.5 1
M9
400 450 500 550 600 650 700
0 0.5 1
P6
Measured Estimated
5. AE Ononye, A Vodacek, E Saber, Automated extraction of fire line parameters from multispectral infrared images. Remote Sens Environ. 108(2), 179–188 (2007). doi:10.1016/j.rse.2006.09.029
6. WK Pratt, CE Mancill, Spectral estimation techniques for the spectral calibration of a color image scanner. Appl Opt.15(1), 73–75 (1976). doi:10.1364/AO.15.000073
7. B Hill, FW Vorhagen,Multispectral Image Pick-Up System. US Patent 5,319,472 (1994)
8. S Tominaga, Multichannel vision system for estimating surface and illumination functions. J Opt Soc Am A.13(11), 2163–2173 (1996). doi:10.1364/JOSAA.13.002163
9. PD Burns, RS Berns, inProceedings of the IS&T/SID Fourth Color Imaging Conference: Color Science, Systems, and Applications, Color Imaging Conference.Analysis of Multispectral Image Capture (Scottsdale: IS&T/SID, 1996), pp. 19–22
10. M Yamaguchi, R Iwama, Y Ohya, T Obi, N Ohyama, Y Komiya, T Wada, Natural color reproduction in the television system for telemedicime. Med Imaging 1997 Image Disp.3031(1), 482–489 (1997)
11. N Tsumura, Appearance reproduction and multispectral imaging. Color Res Appl.31(4), 270–277 (2006). doi:10.1002/col.20225
12. PH Swain, SM Davis, Remote Sensing: The Quantitative Approach, (McGraw-Hill, New York, 1978)
13. AC Rosselet, W Graff, UP Wild, CU Keller, R Gschwind, inImaging Spectrometry, Volume 2480 of SPIE Proceedings.Persistent Spectral Hole Burning Used for Spectrally High-Resolved Imaging of the Sun. 205–212 (1995)
14. T Taxt, A Lundervold, Multispectral analysis of the brain using magnetic resonance imaging. Med Imaging IEEE Trans.13(3), 470–481 (1994). doi:10.1109/42.310878
15. H Maitre, F Schmitt, JP Crettez, Y Wu, JY Hardeberg, inIS&T and SID’s 4th Color Imaging Conference: Color Science, Systems and Applications. Spectrophotometric Image Analysis of Fine Art Paintings(1996) Scottsdale, Arizona, pp. 50–53
16. M Doi, R Ohtsuki, S Tominaga, inImage Analysis, Volume 3540 of Lecture Notes in Computer Science. Spectral Estimation of Skin Color with Foundation Makeup, (Springer, Berlin, 2005), pp. 95–104
17. DL Farkas, BT Ballou, GW Fisher, D Fishman, Y Garini, W Niu, Wachman, Optical Diagnostics of Living Cells and Biofluids, Volume 2678 of SPIE Proceedings, Microscopic and Mesoscopic Spectral Bio-Imaging 200–206 (1996)
18. RS Berns, inCIM’98: Colour Imaging in Multimedia. Challenges for Color Science in Multimedia Imaging. Derby, UK, pp. 123–133 (1998) 19. RS Berns, FH Imai, PD Burns, DY Tzeng, inElectronic Imaging: Processing,
Printing, and Publishing in Color, Volume 3409 of SPIE Proceedings. Multispectral-Based Color Reproduction Research at the Munsell Color Science Laboratory, pp. 14–25 (1998)
20. MS Peercy, inSIGGRAPH‘93: Proceedings of the 20th Annual Conference on Computer Graphics and Interactive Techniques, (Linear Color Representations for Full Speed Spectral Rendering (ACM, New York)), pp. 191–198 21. JY Hardeberg, F Schmitt, H Brettel, JP Crettez, H Matre, inProceedings,
CIM’98, Colour Imaging in Multimedia, (Multispectral Imaging in Multimedia, 1998), pp. 75–86
22. PJ Miller, CC Hoyt, inOptics in Agriculture, Forestry, and Biological Processing, Volume 2345 of SPIE Proceedings, (Multispectral Imaging with a Liquid Crystal Tunable Filter, 1995), pp. 354–365
23. JY Hardeberg, F Schmitt, H Brettel, Multispectral color image capture using a liquid crystal tunable filter. Opt Eng.41(10), 2532–2548 (2002). doi:10.1117/1.1503346
24. SMC Nascimento, FP Ferreira, DH Foster, Statistics of spatial cone-excitation ratios in natural scenes. J Opt Soc Am A.19(8), 1484–1490 (2002). doi:10.1364/JOSAA.19.001484
25. P Cotte, M Dupouy, inPICS, (CRISATEL High Resolution Multispectral System IS&T, 2003), pp. 161–165
26. JY Hardeberg, Acquisition and Reproduction of Colour Images: Colorimetric and Multispectral Approaches. Doctoral dissertation, École Nationale Supérieure des Télécommunications de Paris (1999)
27. FH Imai, Multi-Spectral Image Acquisition and Spectral Reconstruction Using a Trichromatic Digital Camera System Associated with Absorption Filters. Technical report, Munsell Color Science Laboratory Technical Report, Rochester (1998)
28. FH Imai, RS Berns, inInternational Symposium on Multispectral Imaging and Color Reproduction for Digital Archives, (Spectral Estimation Using Trichromatic Digital Cameras, 1999), pp. 42–49
29. S Tominaga, Spectral imaging by a multichannel camera. J Electron Imaging.8(4), 332–341 (1999). doi:10.1117/1.482702
30. FH Imai, A comparative analysis of spectral reflectance estimated in various spaces using a trichromatic camera system. J Imaging Sci Technol.44, 280–287 (2000)
31. EM Valero, JL Nieves, SMC Nascimento, K Amano, DH Foster, Recovering spectral data from natural scenes with an RGB digital camera. Color Res Appl.32, 352–360 (2007). doi:10.1002/col.20339
32. M Yamaguchi, H Haneishi, N Ohyama, Beyond red-green-blue (RGB): spectrum-based color imaging technology. J Imaging Sci Technol.52(1), 010201 (2008). doi:10.2352/J.ImagingSci.Technol.(2008)52:1(010201) 33. M Hashimoto, J Kishimoto, inIS&T Fourth European Conference on Colourin
Graphics, Two-Shot Type 6-Band Still Image Capturing System Using Commercial Digital Camera and Custom Color Filter (Terrassa, Spain, 2008), p. 538
34. K Ohsawa, T Ajito, Y Komiya, H Fukuda, H Hanelshi, M Yamaguchi, N Ohyama, Six band HDTV camera system for spectrum-based color reproduction. J Imaging Sci Technol.48(PART 2), 85–92 (2004) 35. J Park, M Lee, MD Grossberg, SK Nayar, inIEEE International Conference on
Computer Vision (ICCV). Multispectral Imaging Using Multiplexed Illumination, (2007)
36. Flux Inc, FluxData FD-1665 series of 3CCD cameras (2011). http://www. fluxdata.com/
37. G Langfelder, AF Longoni, F Zaraga, inDigital Photography VII, Volume 7876-7877 of Proceedings of SPIE/IS&T Electronic Imaging. Implementation of a Multispectral Color Imaging Device Without Color Filter Array (SPIE, San Francisco, 2011), p. 787609
38. D Connah, A Alsam, JY Hardeberg, Multispectral imaging: how many sensors do we need? J Imaging Sci Technol.50(1), 45–52 (2006). doi:10.2352/J.ImagingSci.Technol.(2006)50:1(45)
39. DC Day, inFilter Selection for Spectral Estimation Using a Trichromatic Camera, Master Thesis, Rochester Institute of Technology, Center for Imaging Science, Rochester, (2003)
40. JY Hardeberg, Filter selection for multispectral color image acquisition. J Imaging Sci Technol.48(2), 105–110 (2004)
41. G Novati, P Pellegri, R Schettini, inColor Imaging IX: Processing, Hardcopy, and Applications, Volume 5293 of SPIE Proceedings, Selection of Filters for Multispectral Acquisition Using the Filter Vectors Analysis Method, (2004), pp. 20–26
42. LT Maloney, Evaluation of Linear Models of Surface Spectral Reflectance with Small Numbers of Parameters, (Jones and Bartlett Publishers, Inc, USA, 1992)
43. FH Imai, LA Taplin, EA Day,Comparative Study of Spectral Reflectance Estimation Based on Broad-Band Imaging Systems. (Technical report, Rochester Institute of Technology, College of Science, Center for Imaging Science, Munsell Color Science Laboratory, Rochester. 2003)
44. D Connah, J Hardeberg, S Westland, inICIP‘04. 2004 International Conference on Image Processing, 2004, vol. 3. (Comparison of Linear Spectral Reconstruction Methods for Multispectral Imaging, 2004), pp. 1497–1500 45. DR Connah, JY Hardeberg, inColor Imaging X: Processing, Hardcopy, and
Applications, Volume 5667 of SPIE Proceedings, (Spectral Recovery Using Polynomial Models, 2005), pp. 65–75
46. A Mansouri, FS Marzani, P Gouton, inIEEE International Conference on Image Processing, (Neural Networks in Two Cascade Algorithms for Spectral Reflectance Reconstruction (IEEE, 2005), 2005), pp. 2053–2056 47. S Bianco, F Gasparini, R Schettini, L Vanneschi, Polynomial modeling and
optimization for colorimetric characterization of scanners. J Electron Imaging.17(04), 043002 (2008). doi:10.1117/1.2982004
48. J Romero, A García-Beltrán, J Hernández-Andrés, Linear bases for representation of natural and artificial illuminants. J Opt Soc Am A.14(5), 1007–1014 (1997). doi:10.1364/JOSAA.14.001007
49. B Dyas, inThe IS&T/SID Eighth Color Imaging Conference, (Robust Sensor Response Characterization, 2000), pp. 144–148
50. M Gulliksson, PA Wedin, The use and properties of tikhonov filter matrices. SIAM J Matrix Anal Appl.22(1), 276–281 (2000). doi:10.1137/
S0895479899355025
52. SB Marapane, MM Trivedi, Multi-Primitive Hierarchical (MPH) stereo analysis. IEEE Trans Pattern Anal Mach Intell.16(3), 227–240 (1994). doi:10.1109/ 34.276122
53. YP Hung, CS Chen, KC Hung, YS Chen, CS Fuh, Multipass hierarchical stereo matching for generation of digitalterrain models from aerial images. Mach Vis Appl.10(5-6), 280–291 (1998). doi:10.1007/s001380050079
54. C Zitnick, T Kanade,A Cooperative Algorithm for Stereo Matching and Occlusion Detection, (Technical report CMU-RI-TR-99-35, Robotics Institute, Pittsburgh, 1999)
55. A Goshtasby, Image registration by local approximation methods. Image Vis Comput.6, 255–261 (1988). doi:10.1016/0262-8856(88)90016-9
56. K Barnard, B Funt, Camera characterization for color research. Color Res Appl.27, 152–163 (2002). doi:10.1002/col.10050
57. Omega, Omega Filters. https://www.omegafilters.com/Products/Curvomatic (2011)
58. P Pellegri, G Novati, R Schettini, PICS., inSelection of Training Sets for the Characterisation of Multispectral Imaging Systems, pp. 461–466 (2003)
doi:10.1186/1687-6180-2011-57
Cite this article as:Shresthaet al.:Multispectral imaging using a stereo camera: concept, design and assessment.EURASIP Journal on Advances in Signal Processing20112011:57.
Submit your manuscript to a
journal and benefi t from:
7Convenient online submission
7Rigorous peer review
7Immediate publication on acceptance
7Open access: articles freely available online
7High visibility within the fi eld
7Retaining the copyright to your article