How to appropriately extrapolate costs and utilities in cost-effectiveness analysis
Abstract
Costs and utilities are key inputs into any cost-effectiveness analysis (CEA). Their estimates are typically
derived from individual patient level data collected as part of clinical studies whose follow up duration is often
too short to allow a robust quantification of the likely costs and benefits a technology will yield over the entire
patient's lifetime.
In the absence of long-term data, some form of temporal extrapolation - to project short-term evidence over a
longer time horizon - will be required. Temporal extrapolation inevitably involves assumptions regarding the
behaviour of the quantities of interest beyond the time horizon supported by the clinical evidence.
Unfortunately, the implications for decisions made on the basis of evidence derived following this practice and
the degree of uncertainty surrounding the validity of any assumptions made are often not fully appreciated.
The issue is compounded by the absence of methodological guidance concerning the extrapolation of non-time
to event outcomes such as costs and utilities.
This paper considers current approaches to predict long-term costs and utilities, highlights some of the
challenges with the existing methods, and provides recommendations for future applications. It finds that,
typically, economic evaluation models employ a simplistic approach to temporal extrapolation of costs and
utilities. For instance, their parameters (e.g. mean) are typically assumed to be homogeneous with respect to
both time and patients' characteristics. Furthermore, costs and utilities have often been modelled to follow the
dynamics of the associated time-to-event outcomes. However, cost and utility estimates may be more
nuanced, and it is important to ensure extrapolation is carried out appropriately for these parameters.
Key points
1. Need to consider how costs and utilities are extrapolated in a cost-effectiveness model 2. There is no guidance on methods for extrapolating costs and utilities
3. Existing applications use various approaches with little justification
Compliance with Ethical Standards
Sources of funding
Work contributing to this manuscript was conducted as part of a MRC grant “Methods of extrapolating RCT evidence for economic evaluation”” although this manuscript was not prepared during the time of this grant.
Humber (NIHR CLAHRC YH). www.clahrc-yh.nir.ac.uk. The views and opinions expressed are those of the authors, and not necessarily those of the NHS, the NIHR or the Department of Health.
Laura Bojke, Andrea Manca, Miqdad Asaria, Ronan Mahan, Stephen Palmer and Shijie Ren all have no conflicts of interest.
Acknowledgements
Introduction
In many countries decisions concerning the adoption of new health technologies (e.g. drugs, diagnostics) are
informed by evidence relating to the cost effectiveness of competing interventions [1]. The range of costs
considered in the assessment of cost-effectiveness will depend on the perspective of the analysis[2], with a
health service perspective implying a more narrow range of costs than a societal perspective. In terms of
relevant outcomes(health benefits), many national and regional decision makers require that outcomes reflect
both mortality and morbidity effects, with the latter typically measured using the EuroQol five dimension
(EQ-5D) instrument [3], a generic preference-based measure of health related quality of life (HRQoL or utility),
which can be used to generate quality adjusted life years (QALYs).
An appropriate time horizon to determine whether a health technology is cost-effective is the timeframe over
which costs and/or health outcomes may be expected to differ between interventions. In many
circumstances, this timeframe is the patient's lifetime, particularly where there are mortality effects. In
England and Wales, for instance, the National Institute for Health and Care Excellence (NICE), which issues
guidance on which treatments should be paid for by the NHS, stipulates that the time horizon of the
cost-effectiveness analysis (CEA) should be sufficient to reflect important cost and outcome differences between
the technologies being compared [4]. Similar guidance exists for other countries such as TLV in Sweden[5] and
IQWiG in Germany[6].
Unfortunately it is extremely unlikely that clinical evidence will exist for the full period over which differences
in costs and QALYs are expected to occur, and it is even less likely that to be the case for resource use, costs
and utilitiesa. Thus, in many circumstances, some form of modelling will be necessary to project short-term outcomes over the lifetime of the patients [7]. This practice requires appropriate methodology and a set of
assumptions, and it is important that the additional uncertainty in the results is fully recognised when such
analyses are used to inform reimbursement decisions.
There have been efforts to produce guidance on the appropriate methods to extrapolate effectiveness data,
particularly time to event data [8, 9], however, there is very little advice available concerning the extrapolation
of resource use, costs and utilities. In this paper we argue that it is not appropriate, and potentially
misleading, to assume that these quantities follow the same dynamics as the time-to-event parameters in the
model.
Given the lack of guidance on how to extrapolate resource use, costs and utilities, a priori we expect there to
be some variability in approaches used in the applied literature. Since the method chosen to extrapolate may
influence the cost effectiveness results, the estimates of decision uncertainty and ultimately adoption
aThis is because many clinical studies are – first and foremost - designed to satisfy the requirements of
decisions, there is potential cause for concern [10]. This paper considers how resource use, costs and utilities
have been extrapolated in cost-effectiveness modelling, using examples from the literature. Methods
employed are categorised and critiqued in terms of their strengths and weaknesses, discussing the implications
of any shortcomings. It is recognised that resource use and unit costs, combined to derive costs, may have
some differences. While estimates of resource use are typically obtained from experimental data, the unit
costs assigned to each item of resource use are usually derived from an external source such as hospital
records or national statistics [11]. In addition, the nature of long-term uncertainty over resource use and unit
costs may be quite different, as is how we estimate them over the short-term. For ease of explanation,
however, forthwith they are collectively referred to as costs, and any differences in methodologies are
discussed when apparent.
Assessing the methodologies used to extrapolate costs and utilities
In extrapolating over a longer time horizon, it is typical for cost-effectiveness models to utilise data sources
external to the effectiveness evidence, to provide inputs for costs and utilities. These external sources of
evidence include observational studies such as - for instance - that used in Garside et al[12], which describes a
quality of life study used to determine utilities for a Markov model specifying health states according to
disease severity. Many models utilise previously published estimates of costs and utilities reported in other
economic models. There are also examples of studies which have used expert opinion [13, 14] or analyst
assumptions[15, 16]. For many cost-effectiveness models there is insufficient information reported to reliably
gauge the methods used to extrapolate healthcare costs and utilities for health states and clinical events,
including – for example – Glazener et al[17], where it is not clear how costs observed at 2 years within the
PROSPECT study were extrapolated over the 5 and 10 year time horizons.. In such instances the focus seems to
be on describing extrapolation methods used for the effectiveness evidence while glossing over the
assumptions and methods used to extrapolate costs and utilities, let alone assessing the implications of these
assumptions in term of any decision uncertainty.
Data available to extrapolate costs and utilities
The extent to which the analyst will be able to quantify any time dependency in costs and utilities will depend
on the data available. Ideally, access to medium to long term individual patient level data can facilitate such
an investigation, therefore in understanding the methodologies that have been employed, distinctions can be
made where patient level data or aggregate (or summary study-level) data were used to populate a
cost-effectiveness model.
Cost effectiveness modelling employing aggregate data
The majority of cost-effectiveness models that make use of summary study-level or aggregate data estimates
to quantify costs and utilities, appear to make the assumption that these parameters are homogeneous (with
respect to time and patients characteristics), extrapolating their values using simple assumptions. These
evidence, which means that estimates of long-term costs and utilities are (implicitly) dictated by how patients’
transitions between health states and event rates are estimated and modelled, both, over the short-term
(observed period) and long-term (unobserved period)[18].
Such aggregate data is typically used within a state-transition model structure [19], although examples can be
found also within discrete event cost-effectiveness models [20]. The impetus for this approach is often dictated
by the fact that (a) costs and utilities are only available as a single summary study-level data point, or (b) even
when multiple study-level observations are available they cannot be adequately synthesised [21]. There are,
however some notable exceptions, which include recent work on the impact of osteoporosis fractures [22] and
chronic kidney disease [23]. In the absence of patient level data, time can still be used as a predictor of
outcomes (costs, utilities), for example using regression covariates for age or time-dependent
covariates[24-28], where these are available.
Where models chose to mimic the disease process by means of changes in clinical status, which is often
measured in terms of condition specific clinical (or patient reported) outcomes, the assumption behind this
practice is that these outcomes are more accurate in representing (and more sensitive to) changes in disease
status[18, 29]. In cases where costs and utilities are a function of the health states defined within the model, to
assess the appropriateness of the methods used to extrapolate these quantities one must understand how
appropriate these condition-specific outcomes are in the first instance. For example there has been much
discussion on the use of functional capability scores such as the Health Assessment Questionnaire (HAQ) and
its use in modelling the cost-effectiveness of inflammatory musculoskeletal conditions[18].
Cost effectiveness modelling employing individual patient data (IPD)
In theory, IPD datasets are useful inputs into cost-effectiveness models and provide more accurate data on
changes in cost and utilities over time. Hatswell, et al[30] showed that an analysis of patient level data is
essential prior to populating an economic model. In many oncology models, progression status is used to
define health states in the model and utilities/costs are assigned to these states. In the example of metastatic
melanoma, Hatswell, et al[30] determined utilities according to progression status and time to death and
showed that the use of time to death gave similar or better estimates of the original data when used to predict
patient utility in the IPD dataset.
Previous studies have shown that age is a predictor of increased mean costs[31, 32]. Analysis of individual
patient level data (IPD) has explored this relationship. An example is the Randomised Intervention Treatment
of unstable Angina (RITA-3) trial[ 27] , which compared an early interventional strategy (coronary
arteriography and myocardial revascularisation as clinically appropriate) or a conservative management
strategy in patients admitted with an episode of cardiac chest pain associated with documented evidence of
5 year follow up and multiple regression analysis of the 5 year follow up data from the RITA-3 trial[33] showed
that, on average, costs increased by £737, for every 10 years over age 60.
When using IPD on costs and utilities directly from a trial that has also provided effectiveness data to model
the disease prognosis, the distinction between those analyses that do not account for time (e.g. cross sectional
analyses at a fixed time point) and those analyses that explicitly model time, such as longitudinal and
time-to-event studies, is crucial. Many models use cross-sectional data to estimate the relationship between an
outcome (e.g. cost or utility) and its predictor (e.g. a clinical measure of disease severity). It could be argued
that if one is interested in analysing IPD to derive input parameters to model long term costs and utilities,
access to longitudinal outcome dataset is preferred, however in some instances longitudinal data does not
ensure that any differences over time are captured, depending on the length of follow up[34].
Cross-sectional data can provide information about differences in costs and utilities for patients as a function
of age as well as disease stage/health state, provided that the sample includes sufficient patients across the
range of ages and disease stages relevant to inform the economic model. In addition analysts should perform
analyses which account for trends over time and apply the data appropriately in the economic model. The
cross sectional data must also reflect a patient’s characteristics, where it is likely to influence costs and utilities,
for example health states defined using weight categories, where an individual’s previous weight is likely to
have an impact on their future risk of events, including diabetes.
Predominately, IPD has been utilised to extrapolate costs and utilities, where outcome data are available at
multiple follow up points, e.g. HAQ for rheumatoid arthritis and psoriatic arthritis [24-28, 35]. In these
examples condition specific outcomes are extrapolated using appropriate methodology and the resulting costs
and utilities derived using mapping algorithms. Regression models using data from a single randomised
controlled trialcollecting HAQ and/or Psoriasis Area Severity Index (PASI) and EQ-5D or costs (relating to HAQ
or PASI) have been used to represent the association between HAQ/HAQ+PASI score, for instance, and EQ-5D
or costs[24-28, 35]. Time dependency in the EQ-5D is then modelled indirectly as function of the change in
longitudinal outcomes over time. Unfortunately none of these models have also controlled for the covariate
age, which would have facilitated the incorporation of the population ageing process. It is possible that some
of this will be implicitly captured by the declining HAQ score over time for instance, i.e. those with worse HAQ
scores are likely to be older (however the relationship is unlikely to be exact). Similar approaches have been
used for other degenerative conditions, such as advanced macular degeneration (AMD)[36], where regression
analysis has been employed to relate responses to the Health Utilities Index (HUI)3 questionnaire for 209
individuals with AMD to both their visual acuity (VA) status and age. Results from this linear regression model
were then used in a cost-effectiveness model to predict utility values (accounting for sampling uncertainty in
the estimated parameters) for specific health states in the decision model. A separate scenario using another
Regardless of whether data is available from a cross sectional or longitudinal study, in situations where utilities
and costs come from patient level data outside the trial, it is imperative to explore whether (and, if possible
adjust for) any differences in patient characteristics between the external data set and trial population. Explicit
consideration of any differences is not typically undertaken, and more often than not simple sensitivity analysis
will instead be employed, for example increasing costs to a specified amount to reflect a more severe case mix
modelled in the analysis. For example in a recent model developed as part of a NICE appraisal for psoriatic
arthritis, health state costs for patients experiencing more extensive psoriasis were increased, under the
expectation that they would utilise more expensive treatments[37].
Categorisation of methods to extrapolate costs and utilities
In working towards an understanding of the approaches that have been used to extrapolate costs and utilities,
these can be categorised as two types. First, it is possible to extrapolate these outcomes directly from the trial,
without the need to use either a decision model or external data. The study published by the US National
Emphysema Treatment Trial Research Group[38] is one such example. To estimate long-term
cost-effectiveness, trend lines were fitted to monthly costs and Quality of Well-Being scores observed during the
third year of follow-up. These trends were then projected over the lifetime of the model[38].
This method is distinct from the use of IPD to populate a cost-effectiveness model, and this direct
extrapolation from a trial could employ the use of either aggregate or patient level data. This approach is more
commonly used for extrapolating costs, rather than utilities. This is often because there is no specific process
to drive long term costs that could be modelled and datasets used to determine clinical effectiveness typically
contain few repeated measurements over time for each patient (e.g. between two and five assessments),
which make it difficult to fit complex longitudinal event history models.
In the second type, models are used to estimate the events/processes which are then used to determine
costs/utilities, either because these data were not collected in the trial or because the analysts were seeking to
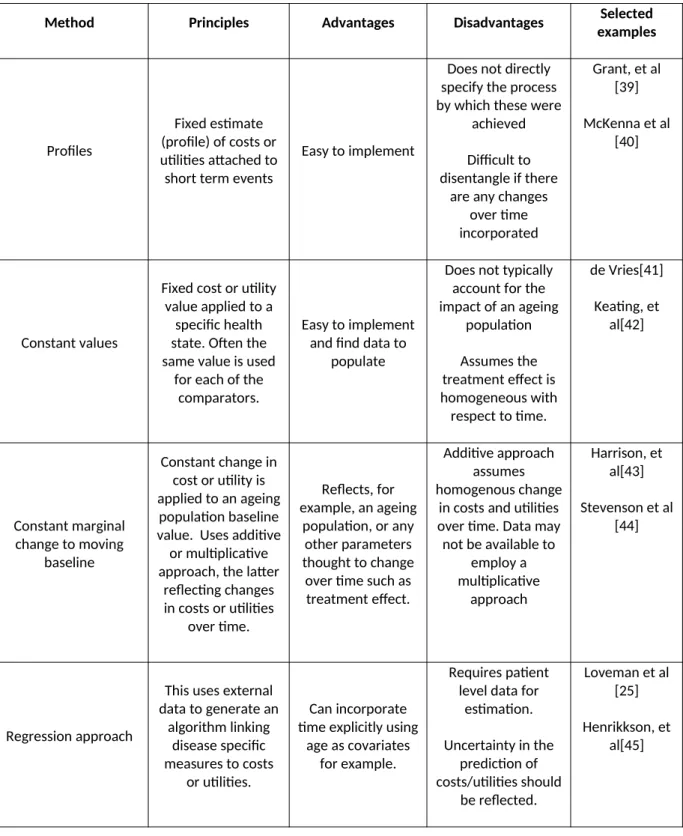
be more explicit about what drives these costs/utilities in the long term. The methods used in the modelling
approaches are categorised in Table 1 and summarised in the sections below along with selected examples for
Table 1: Methods used to extrapolate costs and utilities in cost-effectiveness models
Method Principles Advantages Disadvantages Selected
examples
Profiles
Fixed estimate (profile) of costs or utilities attached to short term events
Easy to implement
Does not directly specify the process by which these were
achieved
Difficult to disentangle if there
are any changes over time incorporated
Grant, et al [39]
McKenna et al [40]
Constant values
Fixed cost or utility value applied to a
specific health state. Often the same value is used
for each of the comparators.
Easy to implement and find data to
populate
Does not typically account for the impact of an ageing
population
Assumes the treatment effect is homogeneous with respect to time.
de Vries[41]
Keating, et al[42]
Constant marginal change to moving
baseline
Constant change in cost or utility is applied to an ageing
population baseline value. Uses additive or multiplicative approach, the latter
reflecting changes in costs or utilities
over time.
Reflects, for example, an ageing
population, or any other parameters thought to change over time such as treatment effect.
Additive approach assumes homogenous change
in costs and utilities over time. Data may not be available to
employ a multiplicative
approach
Harrison, et al[43]
Stevenson et al [44]
Regression approach
This uses external data to generate an
algorithm linking disease specific measures to costs
or utilities.
Can incorporate time explicitly using
age as covariates for example.
Requires patient level data for
estimation.
Uncertainty in the prediction of costs/utilities should
be reflected.
Loveman et al [25]
Profiles of costs or utilities
In some instances, rather than specifying a formal model with health states assigned costs and utility values,
authors have applied a fixed estimate (profile) to short term events without directly specifying the process by
which these were achieved. In the REFLUX model[39], initially a state based model was specified which
attached a utility score following (a) medical management, (b) successful laparoscopic surgery and (c)
unsuccessful laparoscopic surgery (on medication). This meant that the probabilities of being in these states
had to be specified. In a later version of the model this restriction changed so that the trends in costs and
utilities observed at the end of the REFLUX trial were simply extrapolated to longer time horizons, without the
need to attach these to specific health states[39]. Sensitivity analysis was conducted to explore alternative
assumptions regarding these profiles over the model time horizon.
McKenna et al [40] used alternative approaches to inform the duration of quality of life benefits over time in
the model, in the absence of suitable trial estimates for the duration of treatment benefits. Formal elicitation
techniques were used to determine the sustained duration of utility improvements seen after 1 year in the
EECP trial. Elicitation of clinical experts’ opinions was used to estimate the probability of patients experiencing
a sustained health benefit beyond the trial period. Therefore the utility difference isn't attributed to a set of
discrete events/states in the model and instead the direct utility differences are used within the extrapolation.
Constant costs or utilities applied to health states or events
For models that attach a cost and utility to a specific health state or event within a model, the majority do this
by applying a constant cost and utility. Often this is undertaken by implementing a Markov model and as such
the same approach was used for both baseline (i.e. control group) and treatment effect. Any treatment effect
is derived from the modelled differential event rates. Patients in a given health state (or experiencing an event)
require a fixed amount healthcare resources (to generate fixed costs) and experience a given utility value
(dis-utility in the case of a clinical event) for the entire cycle length. This method does not typically account for the
impact of an ageing population on the baseline cost and utility and assumes the treatment effect to be
homogeneous with respect to time; however it is important to consider if the cost or utility applied to a
particular health state is representative over the entire model. For example, several cancer studies estimate a
single utility value for progression, which estimated from patients at the point at which they progress or are
close to progressing [46]. However, this assumes that the utility is homogeneous with respect to timeand in
many cases, there may be a non-linear relationship between time post-progression or time from death and
utility [47].
In de Vries, 2016[41] a model was developed to assess the cost-effectiveness of delaying end stage renal
disease. To generate survival estimates, data from the Dutch Renal Registry was utilised to estimate the
age distribution and survival for renal replacement therapy (RRT)[41] and thus generate age-dependant
utilities were assumed constant post RRT. Similarly in Keating, et al[42], which assessed the
cost-effectiveness of surgically induced weight loss for management of type 2 diabetes, a constant
maintenance cost was applied for each year that the patients remained alive.
Constant increment/decrement applied to changing baseline cost or utility
In this approach a constant decrement or increment in cost or utility is applied to an ageing population
baseline value (an additive approach). The decline occurs because of increased co-morbidities affecting these
outcomes in later life. Failure to capture this decline/increase in costs or utilities may produce incorrect
estimates of cost and QALYs. For those interventions with a mortality effect, this will also bias the comparisons
between modelled strategies, as those patients surviving till later in the extrapolation period will be assigned a
higher utility then can be expected according to their age. In this instance treatments reducing mortality, for
example those reducing myocardial infarction related deaths, which are primarily in those 65+, are likely to
overestimate QALYs.
In the case of utility values, this is usually done using the UK population norms from the EQ-5D index values
[48]. As population mean utility values decline over time, the utility associated with the membership of a
particular health state will also decrease over time. Similarly for costs, a constant incremental cost for the
intervention (or control) may be applied to an increasing baseline cost, reflecting the fact that healthcare costs
can rise as the population ages. Many cost-effectiveness models employ this approach for utilities but few
utilise this methods for costs, instead assuming a constant cost over time.
Alternatively a multiplier can be applied differentially throughout the model in an attempt to reflect changes in
costs or utilities over time. Stevenson et al [44] apply a different multiplier within the first year and a separate
multiplier that applies for the remaining years of the simulation. A utility multiplier is combined multiplicatively
with the general population utility to provide an estimate of the utility for patients in that state, and results in
the absolute dis-utility becoming less as a person ages and their underlying utility lower.
In Harrison, et al[43] long term utilities were based on differences between the comparators observed at
6-months, however, rather than assuming that the differences were maintained over the lifetime, it was
assumed that these differences diminished over time, using linear interpolation.
Regression approach
A regression type approach can be adopted [25] to derive costs or utilities for health state estimates from
external data sources. In Loveman et al [25] a regression analysis was used to infer the reduction of utility over
time and to model utility beyond the last observation of the trial. Baseline utility was taken as the midpoint
between the two arms of the trials. To estimate the utility at a given number of days from baseline, a
baseline (the time element). It is not clear if any uncertainty in the estimated coefficients was incorporated
into the model or if other functional forms were tested.
Appropriateness of methods used to extrapolate cost and utilities
The more simplistic methods of assigning costs and utilities within a cost-effectiveness model, such as profiles
or constant values, appeal on the basis that they are simple to implement and do not rely heavily on data that
is often difficult to come by. They do however impose a number of limitations. Such methods often assume
that costs and utilities are homogeneous with respect to time, with time relating to an individual’s age within a
model but also the time horizon for effectiveness of any treatments. As discussed, there are reasons to believe
that costs and utilities may change as the population of the model ages and there is also reason to believe that
the effectiveness of any treatments may diminish over time, or in the very least we are less certain about
effectiveness over the longer term.
Whichever sources of data are available, and whichever method is used to extrapolate costs and utilities, it is
important to consider how accurate the estimates are likely to be and employ measures to test for validity and
characterise any uncertainty. Regression approaches can include an estimate of parameter uncertainty and
may also be used to explore different functional forms for the statistical model that links covariates to
outcomes. It is also advantageous to calibrate these regressions to external data to assess validity [49].
Supplementing an extrapolation with external evidence can improve the external validity of the predictions.
Where multiple scenarios are available for extrapolation it may be useful to explore combining alternative
scenarios, through Bayesian model averaging [50]. Of course, these scenarios only reflect uncertainty in the
short term (observed) data, rather than the extrapolated (unobserved) period but similar methods can be used
to average predictions under different extrapolation model assumptions and weight these using expert
judgements.
A recent report by the NICE decision support unit [51] considered the use of utilities in decision models and
although the issue of extrapolation was not its primary focus, the uncertainties arising when using lifetime
horizons to accrue QALYs was discussed. This report recommended that when extrapolating beyond an
observation period (in which utilities have been captured) efforts should be made to supplement the utilities
with external evidence to allow for changes over time in patients quality of life, such as ageing and increased
co-morbidities[52]. The document also indicates that it would be appropriate to supplement the evidence on
utilities with baseline data from the general public. This approach matches the approach described above,
which applies a constant utility decrement to a declining baseline utility score. In utilising external utility data,
a full description of the patient population and any assumptions made should be given. There is some
evidence to suggest that in certain circumstances the use of general population data as baseline utilities might
not be appropriate [51]. This is a particular issue for conditions with a high prevalence in the general
population. The baseline utilities (usually below 1) are therefore likely to already include the utility decrement
Discussion
Often a rather simplistic approach to extrapolation of costs and utilities is employed in the cost-effectiveness
literature, with many cost-effectiveness models assuming a constant utility/utility decrement over the
extrapolation period, although they may incorporate time variations for effectiveness parameters.
Long-term predictions of these outcomes are primarily driven by the methods used to extrapolate clinical
outcomes or health states with little consideration given to the appropriateness of assumptions for costs and
utilities. Yet there is evidence to suggest that any differences in costs and utilities are not constant over time.
Models assessing the cost effectiveness of competing alternatives fail to reflect this fact in choosing an
appropriate extrapolation technique. This is likely to be driven by a lack of literature on the extrapolation of
costs and utilities and a lack of knowledge of the appropriate methods to use.
From a practical point of view, the extent to which the analyst will be able to quantify any time (or covariate)
dependency in utilities and costs will primarily depend on the data available. Ideally, access to
medium-to-long term IPD can facilitate such an investigation, however good (repeated) cross sectional data sets can
suffice if these cover a significant population of patients and methods are employed to sample across relevant
characteristics.
When using IPD on costs and utilities derived directly from the trial that provided effectiveness data to model
the disease prognosis, it is important to distinguish between those analyses that do not account for time (e.g.
cross sectional analyses at a fixed time point) from those analyses that explicitly model time, such as
longitudinal and time-to-event studies (i.e. effect of health state and time). It could be argued that if one is
interested in analysing IPD to derive input parameters to model long term costs and utilities, access to
longitudinal outcome dataset is essential. Unfortunately costs and utilities are almost invariably collected at
fixed time points during the study follow up period. When modelling longitudinal cost/utility data it would be
desirable to analyse these alongside some time-to-event variable (e.g. occurrence of clinical events with
concurrent measure mean of cost/utility) to estimate the impact that these events have on costs and/or
utilities/HRQoL. One recent example by Briggs, et al, 2016[53] showed that there were large utility decrements
after clinical events in patients with secondary hyperparathyroidism. The absence of joint information makes
difficult to explicitly model specific event history processes that affect costs and HRQoL.
It should be noted that the collection of cost and utility data prospectively within studies is often difficult.
Unfortunately cost and utility data available from randomised trials and observational data, is often besieged
with missing data. Such data is unlikely to be missing completely at random and it is important to consider how
missing data may bias summary estimates of costs and utility from these studies. There are examples of
studies where the methods used to impute for missing data has had a large impact on the costs generated[54].
There are, however, implications for improving the collection of data to facilitate cost-effectiveness modelling
in studies. It is not clear how this should be done most efficiently and if the benefits out way the risks, such as
The challenge of capturing changes in costs over time also relates to the inclusion of future costs within
cost-effectiveness models. These are costs that may be related or unrelated to a specific condition. Under current
NICE guidance, all related costs should be included in the analysis using an appropriate time horizon (where
there a mortality effect this should be a lifetime). NICE guidance on technology appraisals[4] states that “costs
related to the condition of interest and incurred in additional years of life gained as a result of treatment
should be included in the reference-case analysis. Costs that are considered to be unrelated to the condition or
technology of interest should be excluded”. By extending the remit of costs to include unrelated costs, which
many authors have argued is appropriate to do [55-57], the practical challenge of appropriately estimating any
changes in costs over time is magnified, by the simple fact of having more relevant costs to include in the
calculation of total costs.
Key is the exploration of any uncertainty in extrapolating costs and utilities. Reflecting such uncertainties in any
assessment of cost-effectiveness is paramount to understanding the extent to which trends in costs and
utilities evolve drive adoption decisions. This helps to inform the extent to which efforts are made in improving
data collection for costs and utilities. However uncertainty regarding costs and utilities may, in some
circumstances, be distinct from other forms of uncertainty in a cost-effectiveness model. Uncertainty is
something that we would hope to resolve with further research, if it is plausible to conduct. For costs in
particular, however, there is a degree of uncertainty relating to prices that may not be resolved by further
events, for example drugs going off patent [58]. Over time, societal valuation of utilities may also change
and it is difficult to reflect these uncertainties using conventional methods such as probabilistic sensitivity
analysis[59]. Others have used scenarios to explore the extent to which possible changes in the evidence base
may influence adoption decision and the value of further research[58], although this still requires plausible
ranges for any future changes.
Limitations
This paper illustrates the heterogeneity in methodology used to extrapolate costs and utilities in
cost-effectiveness models and gives examples of the approaches used. It can be postulated that different
methodologies will generate different estimates of total costs and utilities for competing interventions, and
thus estimates of cost-effectiveness. Without empirical evidence to support this, however, it is difficult to
gauge the importance of the methods used to extrapolate costs and utilities in determining adoption decisions
and estimates of decision uncertainty. An area of further research is thus to provide applied examples of the
competing methodologies, where data, sources allow, and to explore the implications of different assumptions
explicitly.
Conclusions
Typically, economic evaluation models employ a simplistic approach to temporal extrapolation of costs and
both time and patients' characteristics. Furthermore, costs and utilities have often been modelled to follow the
dynamics of the associated time-to-event outcomes. Clinical events may affect costs and utilities, but there
are many other long term processes that are pertinent to the evolution of costs and utilities that are not linked
to clinical events. Examples include, relative changes in unit costs that may affect the resource use mix used to
treat a patient, individual’s age, prior clinical history, patient adaptation to particular health states and changes
in clinical practice over time affecting best current practice. The course of associated costs and utilities over
References
1. Stafinski T, et al., Health Technology Funding Decision-Making Processes Around the World. PharmacoEconomics, 2011. 29(6): p. 475-495.
2. Byford S and Raftery J, Economics notes. Perspectives in economic evaluation. British Medical Journal, 1998. 316(7143): p. 1529–1530.
3. Kind P, Hardman G, and M. S, UK Population norms for EQ-5D: Discussion paper 172. 1999, Centre for Health Economics, University of York.
4. National Institute for Health and Care Excellence, Guide to the methods of technology appraisal 2013. 2013, NICE: London.
5. Salas-Vegaa S, B.A., Mossialosa E, , A comparative study of drug listing recommendations and the decision-making process in Australia, the Netherlands, Sweden, and the UK. Health Policy, 2016. 120(10): p. 1104-1114.
6. International Society for Pharmacoeconomics and Outcomes Research (ISPOR), The German IQWiG -It's not NICE Benefit assessment in Germany-new sense or nuisance? ISPOR Connections, 2006. 12(5). 7. Sculpher, M.J., et al., Whither trial-based economic evaluation for health care decision making? Health
Economics, 2006. 15(7): p. 677-87.
8. Collett D, Modelling Survival Data in Medical Research, ed. C. Hall/CRC. Vol. 2nd ed. 2003, Boca Raton (FL).
9. Nicholas Latimer, NICE DSU technical support document 14: Survival analysis for economic evaluations alongside clinical trials - extrapolation with patient-level data
report by the decision support unit. June 2011(last updated March 2013).
10. Karl Claxton, The irrelevance of inference: a decision-making approach to the stochastic evaluation of health care technologies. Journal of Health Economics, 1999. 18(3): p. 341-364.
11. Drummond, M.F., et al., Methods for the Economic Evaluation of Health Care Programmes. 2005, Oxford University Press.
12. Ruth Garside, C.G., Martin Hoyle, et al,, The effectiveness and cost effectiveness of natalizumab for multiple sclerosis: an evidence review of the submission from Biogen. 2007.
13. Garside R, et al., Surveillance of Barrett's oesophagus: exploring the uncertainty through systematic review, expert workshop and economic modelling, H.T. Assessment, Editor. 2006.
14. J Wilson, M.C., F Song, G Yao, A Fry-Smith, J Raftery and D Peake, Imatinib for the treatment of patients with unresectable and/or metastatic gastrointestinal stromal tumours: systematic review and economic evaluation, H.T. Assessment, Editor. 2004.
15. Bond M, et al., The effectiveness and cost-effectiveness of cochlear implants for severe to profound deafness in children and adults: a systematic review and economic model, H.T. Assess, Editor. 2009. 16. E Gospodarevskaya, J.P., K Cooper, E Loveman, A Takeda,, Ustekinumab for the treatment of
moderate to
severe psoriasis, H.T. Assessment, Editor. 2009.
17. Glazener C, et al., Clinical effectiveness and cost-effectiveness of surgical options for the management of anterior and/or posterior vaginal wall prolapse: two randomised controlled trials within a comprehensive cohort study – results from the PROSPECT Study. 2016, Health Technology Assessment. 18. Madan, J., et al., Consensus decision models for biologics in rheumatoid and psoriatic arthritis: recommendations of a multidisciplinary working party. Rheumatology and Therapy, 2015. 2: p. 113-125.
19. Briggs A and Sculpher M, An introduction to Markov modelling for economic evaluation. Pharmacoeconomics, 1998. 13(4): p. 39-409.
20. Davis S, S.M., Tappenden P, Wailoo A,, NICE DSU Technical support document 15: Cost-effectiveness modelling using pateint-level simulated. Report by the Decision Support Unit. April 2014 School of Health and Related Research, University of Sheffield
21. Peasgood T and Brazier J, Is Meta-Analysis for Utility Values Appropriate Given the Potential Impact Different Elicitation Methods Have on Values? Pharmacoeconomics, 2015. 33(11): p. 1101-1105. 22. Peasgood T1, H.K., Kanis JA, Brazier JE,, An updated systematic review of Health State Utility Values for
osteoporosis related conditions. Osteoporos Int, 2009. 20(6): p. 853-68.
25. Loveman E, et al., The clinical effectiveness and cost-effectiveness of topotecan for small cell lung cancer: a systematic review and economic evaluation. Health Technology assessment; Vol 14: No 19. 2010.
26. Turner D, et al., Adalimumab for the treatment of psoriasis. Health Technol Assess 2009;13(Suppl. 2):49-54
2009.
27. Mike Paulden, et al., Alitretinoin for the treatment of severe chronic hand eczema. Health Technology assessment. 2009.
28. McKenna C, M.E., Sarowar M, Fox D, Stevenson M, Pepper C, Palmer S, Woolacott N, Dronedarone within its licensed indication for the treatment of atrial fibrillation and atrial flutter. Health technology assessment. 2010.
29. Rodgers M, E.D., Bojke L, Yang H, Craig D, Fonseca T, Myers L, Bruce I, Chalmers R, Bujkiewicz S, Lai M, Cooper N, Abrams K, Spiegelhalter D, Sutton A, Sculpher M, Woolacott N,, Etanercept, infliximab and adalimumab for the treatment of psoriatic arthritis: a systematic review and economic evaluation . Health Technology Assessment. 2011. p. 1-329.
30. Hatswell AJ, et al., Patient-reported utilities in advanced or metastatic melanoma, including analysis of utilities by time to death. Health and Quality of Life Outcomes, 2014. 12(140).
31. Kelly E, Stoye G, and Vera-Hernandez M, Public Hospital Spending in England: Evidence from National Health Service Administrative Records. Fiscal Studies, 2016. 37(3-4): p. 433-459.
32. Asaria M, Doran T, and Cookson R, The costs of inequality: whole-population modelling study of lifetime inpatient hospital costs in the English National Health Service by level of neighbourhood deprivation. Journal of Epidemiology and Community Health, 2016.
33. Epstein DM, et al., Costs of an early intervention versus a conservative strategy in acute coronary syndrome International Journal of Cardiology, 2008. Volume 127, Issue 2, 4 July , Pages 240-246. 34. Alva M, G.A., Mihaylova B, Clarke P,, The effect of diabetes complications on health-related quality of
life: the importance of longitudinal data to address patient heterogeneity. Health Econ, 2014. 23 (4): p. 487-500.
35. Woolacott, N., et al., Etanercept and infliximab for the treatment of psoriatic arthritis: a systematic review and economic evaluation. Health Technology Assessment, 2006. 10(31).
36. Karnon J, et al., Screening programme for early age-related macular degeneration 2008, Health Technolgy Assessment.
37. Corbett M, et al., Certolizumab pegol and secukinumab for treating active psoriatic arthritis following inadequate response to disease modifying anti-rheumatic drugs: a systematic review and economic evaluation, H.T. Assessment, Editor. 2017.
38. National Emphysema Treatment Trial Research Group, Cost Effectiveness of Lung-Volume–Reduction Surgery for Patients with Severe Emphysema. New England Journal of Medicine, 2003. 348: p. 2092-2102.
39. A Grant, et al., The effectiveness and cost-effectiveness of minimal access surgery amongst people with gastro-oesophageal reflux disease - a UK collaborative study. The REFLUX Trial. Health Technology Assessment; Vol 12: No 31. 2008.
40. McKenna, C., et al., Enhanced external counterpulsation (EECP) for the treatment of stable angina and heart failure: a systematic review and economic analysis. Health Technology Assessment, 2009. 13(24): p. 1-128.
41. de Vries EF, Rabelink TJ, and van den Hout WB, Modelling the Cost-Effectiveness of Delaying End-Stage Renal Disease. Nephron 2016. 133: p. 89-97.
42. Keating CL, et al., Cost-Effectiveness of Surgically Induced Weight Loss for the Management of Type 2 Diabetes: Modeled Lifetime Analysis. Diabetes Care, 2009. 32(4): p. 567-574.
43. Harrison DA, et al., Risk Adjustment In Neurocritical care (RAIN) – prospective validation of risk prediction models for adult patients with acute traumatic brain injury to use to evaluate the optimum location and comparative costs of neurocritical care: a cohort study. 2013, Health Technology Assessment.
44. M Stevenson, M Lloyd-Jones, and D Papaioannou, Vitamin K to prevent fractures in older women: a systematic review and economic evaluation. Health Technology assessment; Vol 13: No 45. 2009. 45. Henriksson M, et al., The cost-effectiveness of an early interventional strategy in non-ST-elevation
acute coronary syndrome based on the RITA 3 trial. Heart, 2008. 94(6): p. 717-23.
of advanced ovarian cancer: a systematic review and economic evaluation. Health Technol Assess, 2006. 10(9): p. 1-132.
47. Batty A, W.B., Pericleous L, Rowen D, Lee D, Nikoglou T, . A comparison of general population and patient utility values for advanced melanoma. in European Society for medical oncology. 01 October 2012.
48. P. Kind, G. Hardman, and S. Macran, UK Population norms for EQ-5D York Centre for Health Economics Discussion Paper pp.172. 1999 Nov, University of York: York.
49. Peek G, E.D., Mugford M, Tiruvoipati R, Wilson A, et al,, Conventional ventilatory support versus extracorporeal membrane oxygenation for severe adult respiratory failure. Heaalth technology assessment. 2010.
50. Christopher H Jackson, S.G.T., Linda D Sharples,, Accounting for uncertainty in health economic decision models by using model averaging
J R Stat Soc Ser A Stat Soc, 2009. 172(2): p. 383-404.
51. Ara R and Wailoo A, NICE DSU technical support document 12: The use of health state utility values in decision models, S.o.H.a.R. Research, Editor. 2011, University of Sheffield: Sheffield.
52. MJM Van Duin, et al., The impact of comorbidities on costs, utilities and health-related quality of life among HIV patients in a clinical setting in Bogotá. Expert Review of Pharmacoeconomics & Outcomes Research, 2016. 0(0,0): p. 1-8.
53. Briggs AH, et al., Analyzing Health-Related Quality of Life in the EVOLVE Trial: The Joint Impact of Treatment and Clinical Events. Med Decis Making, 2016. 36(8): p. 965-72.
54. Oostenbrink JB, Al MJ, and R.-v.M. MP., Methods to analyse cost data of patients who withdraw in a clinical trial setting. Pharmacoeconomics, 2003. 21(15): p. 1103-12.
55. Rappange DR, v.B.P., van Exel NJ, Feenstra TL, Rutten FF, Brouwer WB,, Unrelated medical costs in life-years gained: should they be included in economic evaluations of healthcare interventions? Pharmacoeconomics, 2008. 26: p. 10815-30.
56. Morton A, et al., Unrelated Future Costs and Unrelated Future Benefits: Reflections on NICE Guide to the Methods of Technology Appraisal. Health Economics, 2016. 25(8): p. 933–938.
57. van Baal P, Meltzer D, and Brouwer W, Future Costs, Fixed Healthcare Budgets, and the Decision Rules of Cost-Effectiveness Analysis. Health Economics, 2016. 25(2): p. 237-48.
58. Claxton K, et al., Uncertainty, evidence and irrecoverable costs: Informing approval, pricing and research decisions for health technologies. CHE discussion paper 69. 2011.