GENDER RELATED DIFFERENTIAL ITEM
FUNCTIONING OF SPATIAL ABILITY
SCALE
Dr. Nabeel Abedalaziz
Faculty of Education, Department of Educational psychology and counseling, University of Malaya, Kuala Lumpur, Malaysia
Abstract
The study was conducted to find out: (1) the efficiency of area differential index procedure for the 3-parameter Logistic model, and M-H method on detecting a gender-related differential item functioning of a spatial ability scale. (2) The agreement between the area differential index procedure for the 3-parameter Logistic model, and M-H method on detecting a gender-related differential item functioning of a spatial ability scale. The test Sample consisted of 1000 males and females tenth grade students in Jordan (500 male and 500 female). The study revealed that: (1) the agreement between the two methods was convergent, (2) the efficiency of the two methods wss 75% for M-H method,, and 45% for area
differential index procedure for the 3- parameter Logistic model
,
and (3) males outperform females in spatial abilityIntroduction
There are many studies that focus on a gender related differential item functioning (Gallaghe De Lisu, Holset, Mc Gillicuddy-De Lisi, Morly & Cahalan, 2000; Kimball, 1994; Willingham & Cole, 1997). From the findings of earlier studies, one conclusion can be drawn is that men have a better spatial ability than women (Geary, 1994). Men use this spatial more often than women when solving problems, which can give them advantages while solving certain kinds of problems in geometry (Geary, 1994).
Differential item functioning (DIF) is a collection of statistical that gives indications of items that are functioning differently for different groups of students. Hamblteon, Swamanithan & Rogers, (1991) define DIF in the following: "…an item show DIF if individuals having the same ability, but from different groups do not have the same probability of getting the item right." (p. 110). But it can also be added, that in order to be able to determine whether in item that show DIF is biased or not, further analysis have to been done (Camilli & Shepard, 1994). It is then of interest to determine whether the differences depend on differences of ability of the compared groups (not biased) or on the item measuring something else than intended (biased).
An item shows uniform DIF when the item performance for one group is better than the other group uniformly across all matched proficiency levels (i. e., there is no interaction between proficiency level and group membership), whereas nonuniform DIF exists when there is an interaction between proficiency level and group membership (i. e., the item ability for one group is not the same as that for the other group at all matched proficiency levels).
Purpose of the study
.
The present study sought answers to the following questions: (1) To what extent dothe two
methods (i.e. area index for the three-parameter logistic model, and mantel haenszel) agree or disagree in
the identification DIF? (2) What is the efficiency of the two methods in detecting DIF? (3) Are there
gender differences in spatial ability?
Method
Description of the Test Data and Examinee Samples
The samples used in the study were drawn from a data set containing the responses of approximately 1000 (500 males and 500 females) ninth grade students to the standardized spatial ability scale. The scale is 40 dichotomous items. In the unidimensional analysis, all 40 dichotomous items were regarded as measuring a single dimension. In the IRT analyses, the three-parameter logistic model was fitted to the data, 4 0f 40 items were regarded as poorly fit to the model
.
DIF detection procedure.
Two methods to study DIF have been chosen, Mantel Haenszel and area index for three parameter
logistic model.
Mantel-Haenszel is a X
2
- method, which is developed for DIF-studies and especially for items that
are dichotomously scored (0 or 1).The statistical significant level is set at 0.05 in this study.
The Mantel-Haenszel (M-H) procedure was originally used to match subjects retrospectively on
cancer risk factors in order to study current cancer rates (Mantel &Haenzel, 1959). The procedure has
since been adapted to study differential item functioning and is now the primary DIF detection device
used at the Educational Testing Service (ETS; Dorans & Holland, 1993). The M-H method works by first
dividing subgroups into the reference group (e. g., males) and the focal group (e. g., females). The focal
group is of primary interest in the analysis and is compared to the reference group after being matched on
θ (Uttaro & Millsap, 1994). The total test score usually serves as the θ estimate, and the performance (i. e.
item endorsement rates) of the reference and focal group is compared at unit intervals of θ weighted by
the comparison, an odds-ratio estimator can be calculated, and a x 2
test of significance can be carried out
to assess the presence of DIF.
To assess the degree of DIF present, the odds-ratio estimator can be transformed into the test ETS
"delta metric" (∆; Dorans & Holland, 1993). The ∆ statistic represents the difference in item difficulty for
the reference and focal groups after the total score has been taken into account (Scheeuneman & Gerritz,
the values of it into a classification scheme delineated by Dorans and Holland (1993). A ∆ value of 0.0
indicates no DIF, a positive value indicates DIF favoring the focal group (e. g., females), and a negative ∆
value reflects DIF that favors the reference group (e. g., males). More specifically, there are three
possible degrees of DIF: (a) negligible DIF, where X2 is nonsignificant or the absolute value of ∆ is less
than 1.0; (b) intermediate DIF, where X2 is significant and ∆ is between 1.0 and 1.49 in absolute value;
and (c) large DIF, X 2
is significant and the absolute value of ∆ is 1.5 or large (Dorans & Holland, 1993).
The ∆ statistic not only complements the X2 statistic, but also allows assessments of the degree of
DIF to be made. The one limitation of M-H procedure is that it may lack power to detect DIF that is
nonuniform
Area differential index procedure for 3- parameter Logistic model
An example of the item characteristic curve approaches is the area index by Rudner (1997). It measures the area between the two ICCS of the reference and the focal groups as an index of the difference between the performances of the two groups matched on ability. The larger the area, the larger the difference between the two curves.
indicator of the greatest value of the statistic likely to occur by chance. This approach is not ideal; however, it does provide an approximate answer to the cut-off-score determination problem (Hambleton, Swamanithan & Rogers, 1991).
. Raju (1988) formula for the 3-parameter area index was used to find the area between the two curves as follow:
In order to explore the DIF,
where:
C: guessing parameter (the mean of males and females discrimination parameters for each item).
a1 : discrimination parameter for males (reference group).
a2: discrimination parameter for females (focal group).
b1: difficulty parameter for males (reference group).
b2: difficulty parameter for females (focal group).
D=1.7(constant)
& Greenberg, 1996), and it arises whenever item parameters are estimated using data from two different subgroups (samples) of examinees (e.g., males and females; Stocking & Lord, 1983).
Results and Discussion
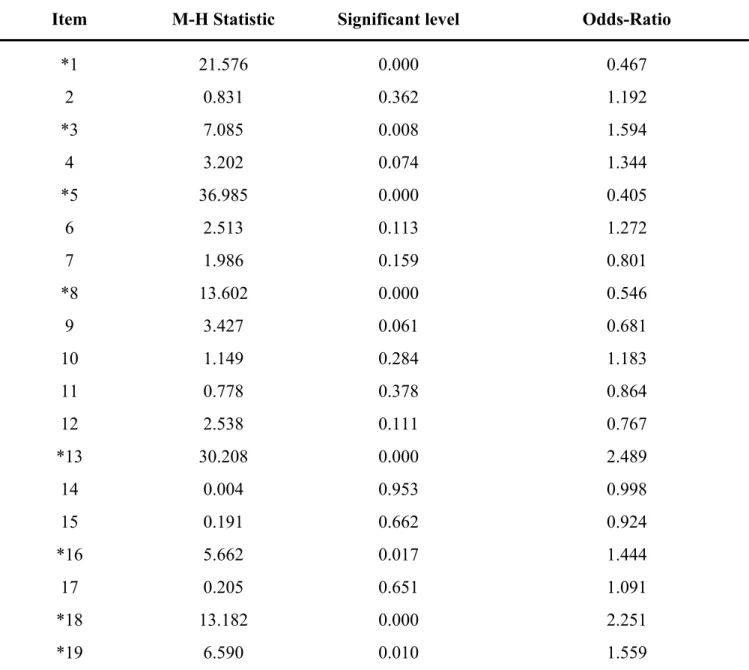
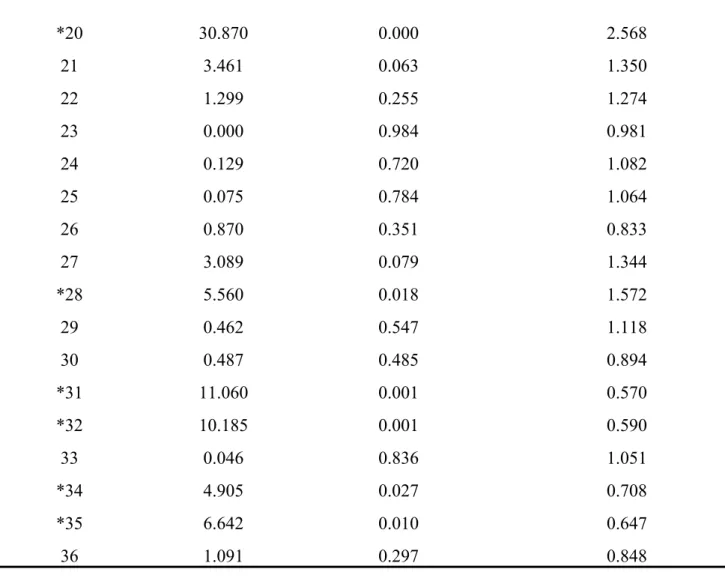
Table 1 shows the DIF statistics of Mantel-Haenszel procedure for each of the 36 items, The M-H
procedure flagged 14 items as revealing DIF in percentage of 39% (seven of them were in favor of male
students and the others were in favor of female students ).
Table 1: Mantel-Haenszel statistic, significant level, and the Odds-Ratio for items
Item M-H Statistic Significant level Odds-Ratio
*1 21.576 0.000 0.467
2 0.831 0.362 1.192
*3 7.085 0.008 1.594
4 3.202 0.074 1.344
*5 36.985 0.000 0.405
6 2.513 0.113 1.272
7 1.986 0.159 0.801
*8 13.602 0.000 0.546
9 3.427 0.061 0.681
10 1.149 0.284 1.183
11 0.778 0.378 0.864
12 2.538 0.111 0.767
*13 30.208 0.000 2.489
14 0.004 0.953 0.998
15 0.191 0.662 0.924
*16 5.662 0.017 1.444
17 0.205 0.651 1.091
*18 13.182 0.000 2.251
*20 30.870 0.000 2.568
21 3.461 0.063 1.350
22 1.299 0.255 1.274
23 0.000 0.984 0.981
24 0.129 0.720 1.082
25 0.075 0.784 1.064
26 0.870 0.351 0.833
27 3.089 0.079 1.344
*28 5.560 0.018 1.572
29 0.462 0.547 1.118
30 0.487 0.485 0.894
*31 11.060 0.001 0.570
*32 10.185 0.001 0.590
33 0.046 0.836 1.051
*34 4.905 0.027 0.708
*35 6.642 0.010 0.647
36 1.091 0.297 0.848
*Item reveals DIF
Table 2 shows the DIF findings of the three parameter area index, the procedure flagged 15 items
as revealing DIF in percentage of 42%.
Table 2: Item (difficulty b, discrimination a, and guessing c) parameter, and the area between the
0.1531 0.20 0.24 2.66 0.05 0.84 0.40 6 0.7532 0.04 0.05 2.16 0.04 0.69 -0.86 *7 0.1152 0.77 0.56 -0.71 0.05 1.21 -0.66 8 0.3483 0.00 3.26 -0.97 0.00 2.60 -0.66 9 0.7592 0.08 0.78 -0.81 0.02 1.26 0.31 *10 0.1456 0.11 0.71 -0.16 0.05 1.25 -0.76 11 0.1284 0.00 1.62 0.55 0.10 0.93 -0.62 12 0.0327 0.01 0.88 -0.60 0.01 1.27 -0.36 13 0.0883 0.05 0.25 1.34 0.10 0.95 0.03 14 0.2048 0.06 0.75 0.51 0.05 1.23 -0.46 15 0.4060 0.11 0.61 0.11 0.00 0.60 -0.51 16 0.7641 0.03 1.08 0.71 0.05 1.07 -0.13 *17 0.9406 0.04 1.51 0.50 0.00 2.42 0.96 *18 0.5938 0.00 1.13 -1.15 0.03 2.15 -0.42 *19 0.9287 0.05 1.60 -1.36 0.00 2.74 -0.36 *20 0.6709 0.09 1.47 -1.26 0.00 2.51 -0.50 *21 0.4769 0.14 1.29 -1.63 0.00 2.39 -0.74 22 0.4321 0.00 2.70 -1.18 0.11 1.08 -1.09 23 0.3350 0.34 2.08 -0.93 0.40 2.07 -0.60 24 0.5381 0.08 1.78 -1.21 0.00 2.98 -0.59 *25 0.0560 0.00 1.05 -0.75 0.00 3.48 -0.38 26 0.5925 0.01 1.87 -0.92 0.04 1.18 -0.40 *27 0.5840 0.06 1.40 -0.11 0.01 3.22 -0.40 *28 0.2722 0.31 0.27 0.00 0.00 1.67 -0.14 29 0.1280 0.00 0.46 -0.40 0.01 0.66 -1.13 30 0.4480 0.08 0.65 0.69 0.00 1.69 -0.03 31 0.1366 0.11 0.42 -0.33 0.16 2.51 -0.32 32 0.9063 0.11 -0.13 -1.76 0.04 0.96 1.16 *33 0.1426 0.12 0.57 0.48 0.03 1.19 0.12 34 0.6031 0.00 -0.01 -2.77 0.03 1.19 0.12 *35 0.4260 0.06 0.49 2.41 0.05 0.76 0.74 36
*Item reveals DIF
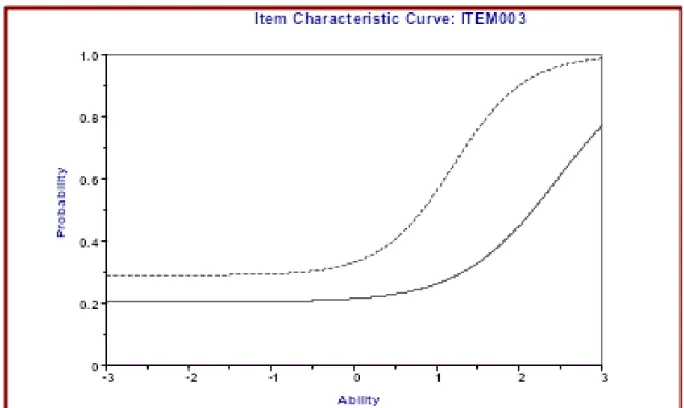
To determine the direction, and the kind of DIF (uniform or nonuniform),item characteristic
curves for males and females for each item were placed at the same graph. The figures shows that 15
items revealed DIF (five of them revealed uniform DIF for the male favor and the others revealed
nonuniform DIF ). The items: 3, 4, 7, 19, and 27 revealed uniform DIF in favor of males. The items 5, 10,
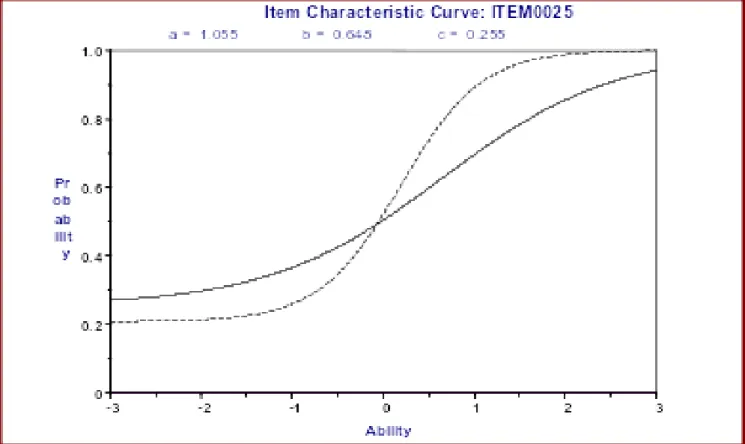
16, 18, 20, 21, 25, 28, 33,and 35 revealed nonuniform DIF. As an examples, figure 1 shows a uniform
The differential functioning in general was for males favor. Also, DIF was out standing in the
highest level of ability and standing in the lowest level of ability, and in other items DIF was out standing
in the lowest level of ability and standing in the highest level of ability.
Figure 2. Item reveals nonuniform DIF
In order to inspect the consistency between the two methods in detecting DIF, the agreement
between the two methods were computed. Table 3 summarize the consistency in which the two methods
flagged or nonflagged the items regarding to reveal DIF. The percentage of the agreement between the
two methods is 56%, which is relatively low. The lowest agreement may be due to different reasons: (1)
M-H and the area index for the 3-parameter logistic model methods rely on different measurement theory,
cut-off area for the area index is not ideal. (3) The one limitation of M-H procedure is that it may lack power
to detect DIF that is nonuniform.
Table 3: Agreement between M-H and the Area-Index methods.
Results From M-H
Results From Area Index No. of Nonflagged Items No. of flagged Items Marginal Total
No. of nonflagged items 14 7 21
No. of flagged items 8 7 15
Marginal total 22 14 36
No. M-H= Mantel-Haenszel
Area Index= Area index for the 3-parameter logistic model
Student’s scores had been distributed into classes (levels) according to the total mark, and the numbers of males and females for each level were determined. The item reveals uniform DIF when the number of one group greater than the other through all levelsof ability. The item reveals nonuniform DIF when the numbers of one group greater than the other through the lower levels, and less than through the higher levels. The item does not reveal DIF when there is no consistent difference between the numbers of the two groups through all levels (this approach considered as a reference approach).
To determine the efficiency of the M-H and 3-parameter area index methods, the agreement between the reference approach and the two methods was explored (45% for the 3-parameter area index method, and 75% for M-H method). The greatest efficacy of M-H method may be due to availability of a statistical norm for this method.
REFERENCE
Camilli, G., & Shepard, L. (1994). Methods for identifying biased test items. California: Sage. Dorans, N.J., & Holland, P.W. (1993). DIF detection and description: Mantel- Haenszel and standardization. (RR-92-10). Princeton, NJ: Educational Testing Service.
Gallagher, A.M., De lisi, R., Holst, P.C., McGillicuddy-De Lisi, A.V., Morely, M. & Cahalan, C. (2000). Gender Differences in Advanced Problem Solving. Journal of Experimental Child Psychology, 75, 165-190’
Geary, D.C. (1996). Sexual selection and sex differences in mathematical abilities. Behavioral and Brain Science, 19, 229-284.
Ha-Kim, S.,& Cohen, A. (1995). Comparison of Lord Chi Square and Rajus Measures and the Likeli hood Method on detecting of differential item functioning, Applied Measurement In education Vo14, pp (291-312).
Hambleton, R.K., & Rogers, H.J. (1989). Detection potentially biased test items: comparison of IRT areas and Mantel-Haenzel methods. Applied Measurement in Education, 2, 313-334.
Hambleton, R.K., Swaminathan, H., & Rogers, H.J. (1991). Fundamentals of item response theory. Newbury Park, CA: Sage. 26.
Harvey, R.J., & Greenberg, S.E. (1996). Gender-based differential item functioning in the Myers-Briggs Type Indicator: Implications for employee selection and big-five inventories. Unpublished manuscript. Virginia Polytechnic Institute and State University.
İntassuwan, P. (1979). Comparison of three approaches for determining item bias in cross – national testing, (un published Dissertation, university of Pittsburgh. USA).
Kimball,a M.M. (1994). (It is only a myth that girls are poorer in mathematics. ). Kvinnovetenskaplig tidskrift, 15(4), 39-53.
Mantel, N., & Haenszel, W. (1959). Statistical aspects of the analysis of data from retrospective studies of disease. Journal of the National Cancer Institute, 22, 719- 748.
Raju, N.S. (1988).The area between two item characteristic curves. Psychometrica,12, (6).
Rudner, (1997). A Monte Carlo Comparison of Seven Biased item Detection Techniques. Journal of Educational Measurement. Vol. 17, No. 1P. (1-10).
Scheuneman, J.D., & Gerritz, K. (1990). Using differential item functioning procedures to explore sources of item difficulty and group performance characteristics. Journal of Educational Measurement, 27, 109-131.
Seong, T. J, & Subkoviak, M. J. (1987). Acomparative study of recently proposed item bias detecting methods. (ERIC Document Reproducation No. E D: (365091).
Skaggs, G., & Lissits, R. (1992). The consistency of Detecting item Bias across different test Administration: Implications of anther Failure. Journal of Educational Measurement. Vol 29 No .3. Stage, Christina. (2000). Predicting Gender Differences in word item. A comparison of item response theory and classical test theory. A study of the swe SAT Subtest. ERIC. (Educational measurement, No 30).
Stocking, M.L., & Lord, F.M. (1983). Developing a common metric in item response theory. Applied Psychological Measurement, 7, 201-210.
Uttaro, T., & Millsap, R.E. (1994). Factors influencing the Mantel-Haenszel procedure in the detection of differential item functioning. Applied Psychological Measurement, 18, 15-25.