doi : https://doi.org/10.32628/CSEIT195513
Dr. H
20 - Potable Water Monitoring and Management System
M. S. Ashraj, A. M. B. M Bisham, D. S. P. N. M De Silva, M.M.H.N Manthilaka, S. G. S Fernando Sri Lanka Institute of Information Technology, Colombo, Sri Lanka
ABSTRACT
Currently, many organizations of various complexities use water dispensers to provide drinking water for the employees and other stakeholders who visit their premises. The monitoring and managing of such water dispensers is currently performed with much human interference. Moreover, individuals living in a fast moving world are negligent and are not motivated to drink the required level of water recommended by medical practitioners. In order to find solutions for the above problems, a Potable Water Monitoring and Management System was developed. This system uses an Arduino Mega 2560 micro controller together with 2 load cell sensors as the major components to extract the necessary information regarding water level of water cans and employee water bottles. Barcode reader was used to extract employee details from the barcodes embedded in the employee water bottles. According to the facts collected through the literature review, it was found that there were no current systems that detect the water level of water dispensers using load cells. Moreover, there were no efficient methods to track the daily water intake of employees in an organization as well. The purpose of this Potable Water Monitoring and Management System is to provide an easy and efficient methodology to maintain the water dispensers using minimum human interference and to regulate and notify employees about their daily water intake levels. This system also enables the storage and management of details of employees and water can suppliers.
Keywords : Arduino, Water Dispenser, Load Cell, SMS Notification, Barcode Reader
I. INTRODUCTION
Potable water is water that is free from contamination and does not contain a certain amount of saline material[1].In other words, potable water is water that is considered safe to drink. Water dispensers are widely used in many organizations around the world for the dispensing of potable water. Further, there is an increase in use of such dispensers in residences as well. A water dispenser can be described as a device that is used to dispense water thus enabling easy access to drinking water. A water dispenser may have the ability to perform functions such as filtering water, heating water and cooling water. Some water dispensers provide clean filtered
water from replaceable bottles while some dispensers provide water straight from municipal water lines [2].This system highlights the monitoring and management of water dispensers which have the ability to provide clean and filtered water from replaceable bottles placed in organizations.
so that those maybe replaced on time. Further, the managing of the water can stocks with minimum human interference is considered ideal especially for massive organizations. Moreover, research shows that individuals of the current era are negligent of drinking the recommended level of water that they require in order to maintain a healthy life. The daily water intake of human depends from person to person based on various factors such as age, gender, and their health conditions.
Since 2003 there had been 2163 reported cases of death due to dehydration [3].Dehydration has been a major cause for various ailments such as kidney failures, hyper tension and low blood volume and may even sometimes lead to death [4]. Moreover, a human body is composed of approximately 60% of water. An average adult is advised to consume at least 3.7 Liters (male) and 2.7 Liters (females) of water per day [5]. Not everyone is self -motivated to consume the required level. Individuals are negligent of the effects that would befall them due to lack of water intake that result in dehydration. Therefore, adhering to the daily recommended by medical practitioners is considered vital. Employees in an organization are mostly within air conditioned environments which further increases their risk of dehydration. Thus, they should especially be motivated to be hydrated by maintaining their regular water intake levels. This system has been developed by considering the need to develop a system to monitor and manage the water dispensers together with the urge to motivate employees of an organization to drink the recommended level of water as advised by medical practitioners in order to stay healthy and prevent various diseases. The main objective of this system was to use Arduino technology and weight sensors to detect the water level of water cans by calculating the weight of water. The desktop application for the system will be maintained by the administrator. The Potable Water Monitoring and Management System consist of two main functionalities. The system
monitors the weight of the water cans with the aid of load cells placed on the dispenser and sends a notification to the employee who is in charge of water can replacement when the water reaches a certain level. Meanwhile, auto stock updates take place when each water can is replaced.
If the stocks reduce below the minimum level, an auto notification is sent to the supplier requesting for stock. The administrator may request for stock manually if required as well. On the other hand, the weight of water taken by the employee to his/her barcode embedded bottle is calculated. All employees who use this system will get a daily notification on how much water they have used per day. This solution is not only limited to massive organizations, but may also be implemented domestically in residences as well. The technology and concepts that have been used would be helpful for those who are hoping to conduct researches related to the same domain in future.
This paper is composed of 06 sections. Section 01 highlighted the Introduction. Section 02 highlights the literature review that was conducted. Section 03 explains the methodology followed in detail. Section 04 discusses the outcome of the developed system. Section 05 highlights the technical issues that had to be confronted during the development of this system. Section 06 is the conclusion.
II. BACKGROUND STUDY
system have been gained by conducting a detailed review of related research papers. The background study includes sensor technology, use of barcode, SMS notifications and the need of water for a healthy living as the key components of study.
The main objective of the system was to detect water level of water dispensers and also encourage employees in an organization to drink the minimum required water levels. In order to accomplish this, the pivotal task of the system was to detect the level of water in the dispenser. Several concepts that had been previously implemented were analyzed for this purpose.
Mittal in his research explains how an ultra-sonic sensor is used to detect the water level of a water tank by the use of waves. Liquid Crystal Display (LCD) display shows the water level and the status of the motor. As a result the research had revealed that this system aids in reducing water wastage and maximizes water usage. Further, power is saved thus saving money. It is an automatic process, so there is each and every second by the Arduino Uno board on its display unit separately. A message will be sent to the user by GSM modem with regard to the fuel levels. Users will always be informed because of the instant message notifications sent. SMS text messages are always dependent on the available credit balance, in case the available balance is insufficient, the mobile phone user will not get the notification instantly [7].
Suheti, Sunandar explains a case control study which was based on people who suffer from hypertension
and who do not suffer from hypertension in the village of Bandung, Indonesia. Samples of data such as water intake levels, habit of exercise was taken from 156 individuals (78 case,78 control) between the age groups of 30- 59.Univariate, Bivariate and multivariate analysis was conducted in order to find the relationship between amount of water consumed and hypertension. As a result, this research revealed that consuming water regularly has contributed in the prevention of hyper tension. The results of the experiment acts as an evidence, to motivate individuals to consume the required level of water regularly [8].
Oakley, Baird discusses about a study conducted to analyze how much water was drunk by patients from a wellness clinic in Ontario, Canada. As a result of
Sudha et al explains the use of barcodes to mark the attendance of students in a school. This system helps to identify each student individually and is considered as an efficient system compared to the manual process of marking attendance [11].
Anandhakrishnan et al. highlights the development of a smart gas monitoring system using Internet of Things (IOT). This system covers various issues that a user could face while using a gas cooker. This system enables the sending of immediate notifications to the user through an android app when a leakage occurs. Whenever gas level drops below threshold level, it is detected and the gas agency is notified to replace a gas cylinder. It is an automated process and requires minimal human assistance. [12].
load cell sensors to detect the weight of an animal that steps onto the weight detector belt laid around the fence covering a breadth of 5 feet. A current is passed to the animal depending on the weight of the animal to prevent them from entering residential areas [13].
III. METHODOLOGY
The “Potable Water monitoring and Management System” was developed using the prototype methodology. The steps followed in the development process are highlighted in the sections below. This methodology was chosen in order to identify defects and missing functionalities earlier and enhance the functionalities that needs improvement in order to ensure the quality of the end product.
A. Planning
In this phase, the topic of the research was analyzed and the objectives and the research problem were discussed. The background research regarding the project and its scope was conducted. An estimated budget was prepared by considering the requirements that were at that time. A feasibility study was also conducted in order to check whether the resources required are feasible to be achieved within the time frame of the project. A detailed analysis of the technical, ethical and economic issues was discussed.
B. Requirement Gathering and Analysis
The primary purpose of the research was to find out the availability and maintenance of water dispensers at various organizations. In order to be clear about the requirements a data gathering and analyzing process had to be conducted. Primary data that was required in order to develop the system was gathered and analyzed as per requirements. Gathering
accurate data was vital before the development of the system begins. In order to fulfill this, information regarding the daily water intake of employees was sought. The population for our research was the general public who are/was employed in an organization. The research was conducted based on random sampling. A questionnaire was prepared in the form of a Google form and was distributed among prospective individuals.
The research that was conducted gathered information such as age group and gender of employees, the number of employees working in the respective organization, the number of bottles of water consumed daily from all respondents who answered the questionnaire. Specific questions were asked from the respondents depending on whether or not they had water dispensers in their organization. As a result, it was concluded that the majority of the respondents felt dehydrated while at work and that they would like to have a system to monitor their daily water intake level while at work. Therefore, a system to monitor their daily water intake level was considered ideal. Moreover, the respondents who said that they had water dispensers at their organization have included that there were situations when the water dispenser was empty when they went to get water. It was also highlighted that there were no specific employees to maintain the water dispenser at their organization
According to this diagram, the value of the weight of the water can when it reaches the minimum level (set by the administrator) is sent to the administrators’ system. Then the system sends an auto notification to the laborer in charge to replace the water can of that particular dispenser. Meanwhile, when the new water can is installed on to the dispenser, the weight is detected and water can stocks are instantly updated (reduced).Depending on the available quantity of water cans after updating, a purchase order is sent to the supplier via an email. On the other hand, whenever an employee uses his/her water bottle that has an already embedded barcode, he /she have to scan it using the barcode reader before they take water from the dispenser. The employee details can be retrieved by using the barcode.
This information is stored in the system. At the end of the day a SMS notification is sent to the employee indicating the amount of water that he/she has dispensed from the water dispenser. Since this project primarily focuses on one dispenser Ethernet cables will be used to connect the PC to the Arduino board. Fig. 1. shows the High Level Architecture diagram of the system
Fig. 1. High Level Architecture Diagram
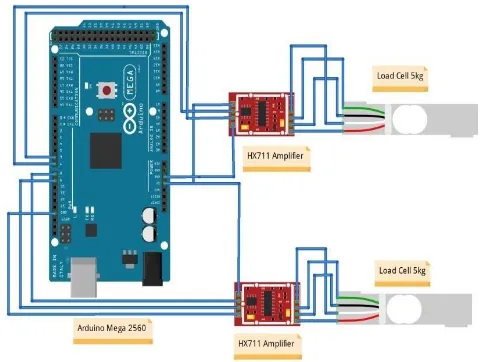
The Hardware Circuit Diagram was sketched in order to show the working components of the internal circuit.Two load cell sensors are connected to the Arduino Mega2560 through two HX711 Amplifier modules. The HX711 module is used to read the changes in resistance of the load cell. Jumper wires are used to connect the HX711 module to the Arduino board. The power is supplied to one load cell through the 5V pin and the other load cell through the 3.5V pin of the Arduino MEGA2560.
Fig. 2. shows the illustration of the Hardware Circuit Diagram
Fig. 2. Hardware Circuit Diagram
D. Implementation
Implementation can be considered as a vital stage of the software development lifecycle (SDLC) of the Potable Water Monitoring and Management System. Implementation was divided into two as hardware implementation and software implementation.
the hardware implementation are detecting the water can values and calculating the daily employee water intake values. The hardware section of the system was developed using the Arduino Mega2560 microcontroller. In order to program this microcontroller, Arduino IDE was used. Further, two load cell sensors (having the capability to weigh up to 5kg), 2 HX711 Amplifier modules and necessary jumper wires were used. The programming language used for the Arduino IDE is C++ and C language
The second part of the system focuses on the software implementation. Java was used as the programming language and NetBeans 8.2 was the IDE used for development. The database used was MySQL database connected through the XAMPP server. Employee management and Supplier management are the modules that were solely based on software while the results derived from the hardware implementation had to be integrated with the java application and the database.
E. Testing
The Potable Water Monitoring and Management System was tested in several stages. Each individual function was unit tested initially. Following the unit tests, integration testing was conducted. Finally the entire system had to undergo system testing. The required test cases were designed in order to obtain the maximum coverage. Since this system has hardware and software components, the crucial phase was when conducting the integration testing by combining the hardware and the desktop application. The tests were conducted in a way that the reliability and accuracy of the system was given high importance.
IV. RESULTS
This section highlights the final outcome of the system that was developed. The outcome of the software components are demonstrated through the interfaces and the functioning of the hardware system is depicted through a flowchart.
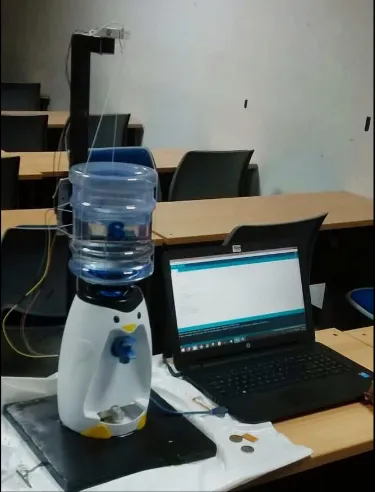
Fig. 3. shows the working model of the system that was developed.
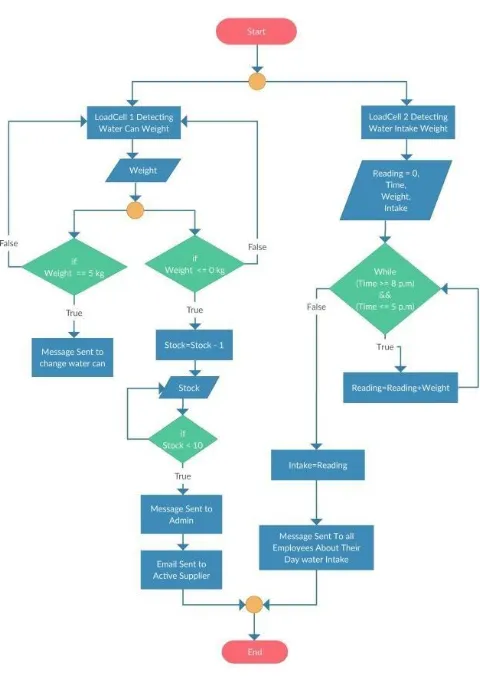
Fig. 4. shows the logic of the internal process that takes place in order to detect the water level of the water cans and the employee water bottles.
Fig. 4. Flow chart
Fig. 5. shows the main interface of the Desktop application through which the administrator can navigate to the separate sections
Fig. 5. Home Interface
Fig. 6. shows the login interface that is required to view and modify the employee details
Fig. 6. Login Interface
Fig. 7. shows the interface used to add and modify the employee details. At the end of adding an employee, a barcode is printed. This barcode will be pasted on the employee water bottles. Fig. 8. shows the generated barcode.
Fig. 7. Employee Interface
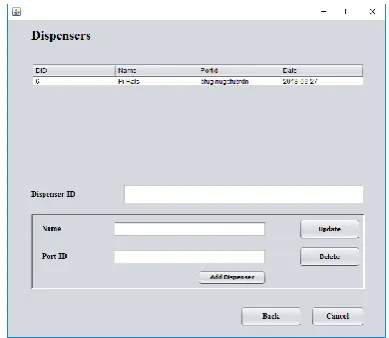
Fig. 9. shows the interface that is used to display and modify the details of all the dispensers that are installed in an organization.
Fig. 9. Dispenser Interface
Fig. 10. shows the interface that the administrator can use to set the default recommended water intake levels for employees based on Gender.
Fig. 10. Dispenser Interface
Each employee has a water bottle with a unique barcode embedded on it. Before an employee dispenses water to his/her bottle, that employee has to scan the barcode using the barcode reader placed next to the dispenser. The employee’s identity will be detected and details will be displayed. Next, a
message indicating the employee to place the bottle on the dispenser stand will be displayed as illustrated in Fig. 11.
Fig. 11. Read Barcode
Fig. 12. shows the interface that is used to view the water intake of each employee.
Fig. 12. View Employee Water Intake
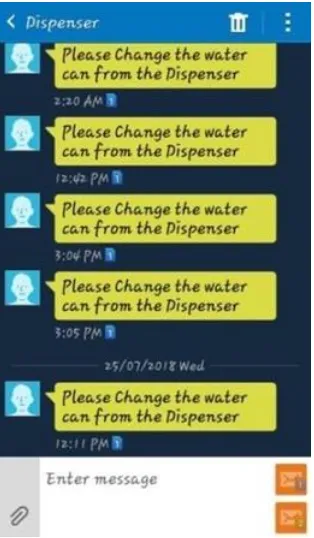
Fig. 13. SMS to Laborer
Fig. 14. is the image of an SMS sent to the employee indicating the employess water intake for the specific day
Fig. 14. SMS to Employee
Fig. 15. shows the main interface that is used to handle supplier details.
Fig. 15. Supplier Details
Fig. 16. depicts the interface that is used to generate reports for stocks
Fig. 16. Generate Reports
V. DISCUSSION
more feasible. The weight of water was calculated using kilograms (kg). The research team has considered 1000grams (1kg) as equivalent to 1000ml (1Litre).Thus, the calculations have been performed accordingly
Since this system is mainly based on hardware components, several technical issues had to be faced during the setting up of the circuit. Calibrating the load cell sensors according to the necessity was a challenge. Since two load cell sensors were used, the research team had to make sure that the calibrations of both load cells were accurate. When the position of the load cell changes, the calibration factor also tends to change at certain circumstances. Therefore, the load cell had to be placed in a fixed position prior to calibrating it. In order to get the calibration factor, different objects of known weights were placed on the load cells. This system measures weight in kilograms, thus appropriate conversions had to be done until expected accuracy level was achieved. An accuracy level of 90% and a reliability of 80% were achieved. When transferring data from the Arduino IDE to the NetBeans IDE several issues were faced. This system uses the serial port to transfer data, therefore necessary libraries had to be used. There were few instances when the USB cable and other components that were used malfunctioned. Since hardware components tend to cause unpredictable changes, the components had.to be carefully handled with much caution
VI. CONCLUSION
The Potable Water Monitoring and Management System benefits the society as a whole in many ways. This system acts as a pioneer solution to monitor and manage water dispensers at organizations and to monitor the employees’ daily water intake. The targeted audience of this system was the employees of organizations. In an era
where many organizations of various complexities are rising in number, the amount of water dispensers used will also be increasing. The purpose of developing this system was to provide an easy and efficient mechanism to monitor and manage water dispensers. Further, this system also motivates the employees of an organization to drink their recommended levels of water daily and prevent themselves from getting dehydrated.
Moreover, this system could also be implemented in hospitals, schools and any other place as needed. Although the project mainly focuses on organizations, this system can be implemented domestically as well. Thus, providing an easy and feasible solution for the users who are in need of such a system. The research team was able to successfully achieve all the objectives of the research within the stipulated period of time.
Several limitations were identified during the course of the research.
1. The power supply for the Arduino Mega2560 is
supplied from the laptop through the USB cable. Thus the laptop has to have continuous power supply at all times. A backup solution would be to have a Lithium ion battery of 12V v 8000mah.
2. A reliable Internet connection is essential for
the sending of email notifications. Therefore, an internet connection with an unlimited data plan must be activated for the system to function efficiently.
3. The transfer of data from the Arduino board to
the java application takes place through the USB cable. Data transfer can be enabled through Wi-Fi by using a Wi- Fi module so that it can be used for larger organizations with multiple dispensers.
can be further extended by the following value additions.
1. Identification of the employee can be more
precisely done using face recognition or by detecting the employee finger print. These methods can be considered more reliable than using the barcode based employee recognition system.
4. Stocks can be updated instantly when the water
can is replaced from the dispenser
VII. ACKNOWLEDGEMENT
The Research team of the ”Potable Water Monitoring and Management System” would like to extend our sincere gratitude to our academic institution Sri Lanka Institute of Information Technology (SLIIT) for the valuable opportunity provided. We are also thankful to Dr.Yasas Jayaweera for his constructive advices and recommendations during the course of the project. We would also like to thank our family and friends who always helped us whenever we needed their
[1]. "Potable water", TheFreeDictionary.com, 2018. Online. Available: https://medical-dictionary.thefreedictionary.com/potable+wate r. Accessed: 07- Mar- 2018.
[2]. "Water Dispenser Basics -How Do They Work?
| NewAir",
NewAir.comKnowledgeBase,018.Online.Availa ble: http://www.newair.com/kb/water- dispenser-basics/. Accessed: 09- Mar- 2018. [3]. K. Rawlinson, "Dehydration and malnutrition
led to 2,162 deaths in caresince2003", theGuardian,2018.Online.Available:
https://www.theguardian.com/society/2013/dec /02/dehydration- malnutrition-care-homes-hospitals. Accessed: 09- Mar- 2018.
[4]. P. Charles Patrick Davis, "Dehydration: Symptoms, Signs, Headache, Treatment, Effects", eMedicineHealth, 2018. Online. Available:
https://www.emedicinehealth.com/dehydration _in_adults/article_em.htm. Accessed: 09- Mar- 2018.
[5]. "How Much Water Should I Drink?" , Healthline, 2018. Online. Available: https://www.healthline.com/health/how-much-water-should-I-
drink#recommendations. Accessed: 06- Mar- 2018. Vardaan Mittal,” Automatic Water Level Controller”, International Journal of Science [6]. and Research(IJSR),Vol.6, pp.136-138,May
2017
[7]. Raveena, Deepa,” FUEL MEASUREMENT USING LOADCELL”, International Research Journal of Engineering and Technology (IRJET),Vol.04,pp.941-943,October 2017 [8]. T. Suheti and K. Sunandar, "Habits Drinking
Journal of Computer Applications,Vol.119,pp.1-4,June 2015
[9]. Paul A. Oakley, Melissa L. Baird Do Patients Drink Enough Water? Actual Pure Water Intake Compared to the Theoretical Daily Rules of Drinking Eight 8-Ounce Glasses and Drinking Half Your Body Weight in Ounces, Journal of Water Resource and Protection 7, 883-887
[10]. Lawrence E. Armstrong, Matthew S. Ganio, Douglas J. Casa, Elaine C. Lee, Brendon P. McDermott, Jennifer F. Klau, Liliana Jimenez, Laurent Le, Bellego, Emmanuel Chevillotte, & Harris R. Lieberman (2011). Mild Dehydration Affects Mood in Healthy Young Women. merican Society for Nutrition 10.3945/jn.111.142000.
[11]. K.Lakshmi Sudha, Shirish Shinde, Titus Thomas, Aris Abdugani,” Barcode based Student Attendance
[12]. S. Anandhakrishnan, D. Nair, K. Rakesh, K. Sampath and G. S Nair, "IOT Based Smart Gas Monitoring System", IOSR Journal of Electrical and Electronics Engineering, vol. 03, pp. 82-87, 2017.
[13]. J. Vinoj and S. Gavaskar, "A Novel Technique to Protect Human from Wild Animal with Arduino and LoadCell", International Journal of Scientific Research in Computer Science, Engineering and Information Technology, vol. 02, no. 05, pp. 1023-1026, 2017.
Cite this article as :
M. S. Ashraj, A. M. B. M Bisham, D. S. P. N. M De Silva, M.M.H.N Manthilaka, S. G. S Fernando , "Dr. H20 - Potable Water Monitoring and Management System", International Journal of Scientific Research in Computer Science, Engineering and Information Technology (IJSRCSEIT), ISSN : 2456-3307, Volume 5 Issue 5, pp. 74-84, September-October 2019.
Available at doi :
https://doi.org/10.32628/CSEIT195513