Causes of Energy Wastage in Cloud Data Centre Servers : A Survey
Kenga Mosoti Derdus*1, Vincent Oteke Omwenga2, Patrick Job Ogao3 1,2Faculty of Information Technology, Strathmore University, Nairobi, Kenya
3Faculty of Engineering Science and Technology, Technical University of Kenya, Nairobi, Kenya
ABSTRACT
Datacenters are becoming the indispensable infrastructure for supporting the services offered by cloud computing. Unfortunately, datacenters consume a lot of energy, which currently stands at 3% of global electrical energy consumption. Consequently, cloud service providers (CSP) experience high operating costs (in terms of electricity bills), which is, in turn, passed to the cloud users. In addition, there is an increased emission of carbon dioxide to the environment. Before one embarks on addressing the problem of energy wastage in a datacenter, it is important to understand the causes of energy wastage in datacenter servers. In this paper, we elaborate on the concept of cloud computing and virtualization. Later, we present a survey of the main causes of energy wastage in datacenter servers as well as proposed solutions to address the problem.
Keywords: Cloud Computing, Datacenter, Data Centre Energy Wastage, Virtualization
I. INTRODUCTION
A. Background
Cloud computing is a common method of processing enterprise workloads because of its success in delivering service on a pay-as-you-go basis. Consequently, CSPs have put many datacenters to meet the demand. Unfortunately, cloud datacenters consume a great deal of electrical energy. This is because they consume a great deal of energy accounting for 3% of global electrical energy consumption [1]. The effect of this is that cloud providers experience high operating costs [2], which leads to increased Total Cost of Ownership (TCO) of datacentre infrastructure. The effect of high TCO is low Return on Investment (ROI). Moreover, there is increased carbon dioxide emissions that affects the universe. The reason for the increased
installation of datacentres is to enable cloud users to benefit from the many advantages of cloud computing such as cost-effectiveness, ease of management and on-demand scalability, as well as ensuring Quality of Service (QoS) and Service Level Agreement (SLA) [3]. According to [4], an average datacentre consumes as much energy as 25, 000 households.
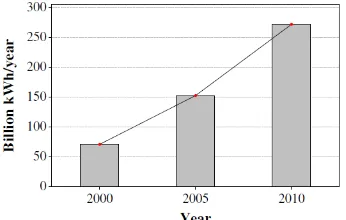
which compares projections of electricity usage by datacenters in the US and globally, shows that consumption is set to increase drastically towards the year 2020. It is also estimated that by the year 2020, the US alone will release about 150 million tonnes of CO2 as a result of its datacenter consuming electricity [6]. In another source, as seen in Fig. 3, the energy consumption in datacenters is projected to increase as other sources of energy consumption decreases such as television and personal computers (PCs).
Figure 1. The worldwide datacenter energy
consumption 2000-2010 [5]
Figure 2: Projection of datacenters electricity [7] use
Figure 3: Global Information Technology (IT) energy consumption in 2015 and forecast for
2020 and 2025 in various industries [8]
The high energy usage in the cloud is attributed to energy wastage and inefficiencies related to the way electrical energy is delivered to the computing resources and the server at large and largely in the way these resources are used by applications workloads [9]. For example, low server utilization and idle power wastage are a major source of energy wastage in a cloud computing environment.
B. What is cloud computing?
Cloud computing is a model that provides computing resources on demand or on rental basis and so users can pay only for resources they use [3]. Therefore, customers can purchase a specific set of resources when they need it instead of renting a fixed amount of physical server. [10]
defines cloud computing as “... a model for
management effort or service provider interaction ”. Shared pool means that resources are collected together and then dynamically allocated regardless of their physical location. On the other hand, network access allows the collected resources to be accessed via a network. In addition, rapid provisioning capability allows the service offering to scale so that the changing demands by cloud users are met. Cloud computing allows applications to be accessed via the internet using a browser, as well as hardware systems and systems software in the datacentres that manage user applications.
C. Virtualization in Cloud Computing
Virtualization is the main technology backing up cloud computing and it is based on physical resources abstraction in a way that several virtual resources are multiplexed on a physical one [11]. Virtualization provides high resource utilization as compared to traditional computing. This makes it possible to run multiple services or applications in the same PM including operating systems. A server is divided into number small servers known as Virtual Machines (VMs), which can run different applications independently and a VM can be moved from one PM to another (Fig. 4) [11].
The hypervisor or Virtual Machine Manager (VMM) is a software layer, which induces the partitioning capability and may run directly on the hardware or on a host operating system [11]. The VMM is responsible for managing physical resources. A host machine is a PM in which a VMM runs. Examples of VMMs are Xen, VMWare and KVM [11]. A VM is a
representation of a real machine using a software, which provides a virtual operating environment in which an operating system runs. A VM is referred to as a guest machine and it runs a guest operating system.
Figure 4. Traditional physical server versus virtual server [11]
Despite the reported successes of virtualizations such as security isolation, which prevents malicious data access and fault isolation that guarantees convenient execution of VMs while another VM fails, virtualization technology still suffers from one major demonstrated disadvantage which is lack of performance isolation mechanisms [12]. This means that
co-located VMs can interfere with each other’s’
performance.
D. Cloud computing actor
There are four main actors in a cloud environment [13].
Cloud provider: This is the owner of the cloud service. A cloud provider has the role of managing and controlling the cloud service. The role may differ depending on the service model –
IaaS, PaaS and SaaS.
Cloud broker: The cloud broker sits in the middle between the consumer and the provider. Their role is to help the consumer to overcome the complexity of choosing a cloud service provider. This actor may assist the consumer to combine the features of multiple cloud providers.
Cloud carrier: This actor ferries services of the cloud provider to cloud user.
E. Cloud computing Service and deployment models
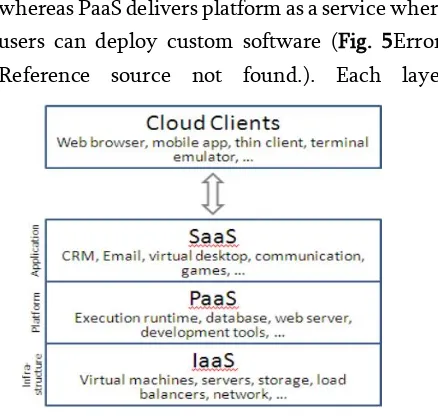
The services provided by cloud computing can be categorized into three main layers - Software as a service (SaaS), Platform as a service (PaaS) and Infrastructure as a service (IaaS). IaaS is the lowest layer [14] and is by far the most promising model in providing cloud computing services [15]. In IaaS cloud, users provision VMs and independently run applications with mixed workloads without any control from the cloud provider. SaaS normally delivers online software services, IaaS delivers computing resources such as processor, memory, network and storage
whereas PaaS delivers platform as a service where users can deploy custom software (Fig. 5Error! Reference source not found.). Each layer
consumes service provided by a lower layer. Figure 5: Cloud computing service models [16]
Cloud deployment models are private, public, community and hybrid [9]. In a private cloud, the computing resources are owned by one entity, normally the client. If many businesses share a business model, they may set up a cloud, which is called a community cloud. When cloud infrastructure is offered to a large number of users who may have differing needs, it is called a public cloud. Hybrid cloud consists of two or more cloud
deployment models (Fig. 6). When cloud computing service models are combined with deployment models, there comes up hybrid terms.
to do away with multi-tenancy, thus the problem that needs to be addressed is resource over-estimation by cloud users in public clouds. Moreover, in multi-tenant IaaS public cloud, users request a VMs to be created by selecting from predefined virtual machine types (sizes). The VMs are then created and placed on available PMs by the hypervisor/ Virtual Machine Monitor (VMM). Users run applications on their specific VMs. The user has control of the VM and can configure and execute any type of application. From the CSP point of view, applications are a black box host in a VM. Unfortunately, in IaaS public clouds, inexperienced users tend to over-provision leading to resource wastage.
II. WHERE DOES THE ENERGY GO?
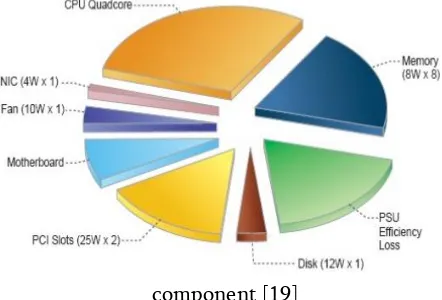
The CPU, disk storage, memory and network are the main consumers of energy in a server [18]. The CPU consumes the largest portion of the energy supplied to a server in a datacentre followed by the memory (Fig. 7). However, due to improvements in CPU efficiency, it no longer dominates energy consumption [5]. On the other hand, energy consumed by the processor greatly depends on processor types. For example, the new Intel processor has power saving mechanisms [19]. Energy consumed by a
datacentre can be saved up to 50% by efficiently performing VM consolidation [5]. For example, efficient VM consolidation can ensure VMs are packaged in the least number of servers so that other servers are shut down thus saving more energy. This is because an idle server consumes 70% of the power when it is fully utilized [5].
Figure 7: Server Power consumption by server
component [19]
Apart from IT load (CPU, disk storage, memory and network), electrical energy is also consumed by cooling and during distribution. As the datacentre servers are used, they emit heat, which needs to be eliminated to avoid additional energy wastage and hardware failure [20].
Figure 8: Energy consumption by datacentre components [21]
component design and most importantly, the amount of work done [19]. Removing the heat generated allows the components to operate on their safe operating temperature failure of which may lead to service degradation or complete damage of the component.
III.CAUSES OF ENERGY WASTAGE IN
CLOUD DATACENTER SERVERS
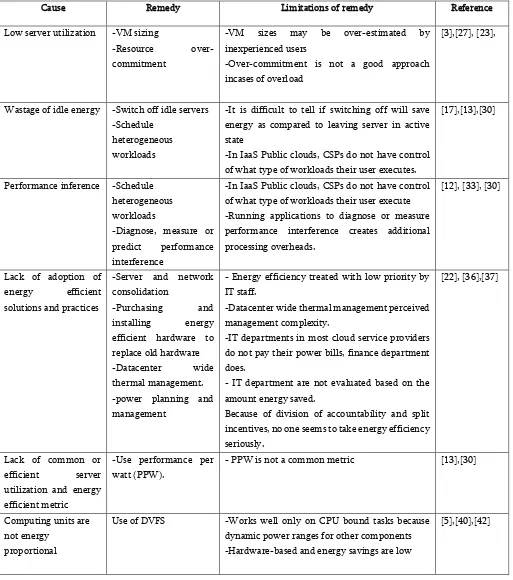
In this section, we review the main causes of energy wastage in cloud datacenter servers, how these causes are addresses as well as the limitations of the approaches used. The review is also summarized in Table 1.
A. Low level of server utilization
Server utilization is the percentage of time during which a server is busy processing workload tasks [5]. Low server utilization is a major cause of energy wastage and is caused by the inefficient utilization of computing resources [13]. At high server utilization, computing resources are efficiently used and as a result, less physical server is used hence saving energy that would have been used by powering more servers. [22] reports that average server utilization for
small-to-medium datacentres, with market
segmentation by electricity consumption of 49%, is 10%, and 50% for High Performance Computing (HPC) datacentres, whose market segmentation by electricity consumption is 1%, and that the physical machines drew up to 90% of their peak power. Clearly, this is resource over-provisioning, which leads to increased energy consumption because many servers have to be used.
A six-month data analysed from about 5000 servers revealed that, although servers are generally not idle, their utilization never reaches 100% [5]. According to an analysis conducted by [23] on Google cluster’s resource usage, 65 % of
CPU and 45 % of memory goes to waste. This shows that application workloads utilize less resources than what is provisioned- low server utilization. With high resource utilization, the number of physical servers required will be greatly reduced thus reducing the amount of energy used in datacentres.
Moreover, slim dynamic power ranges cause low server utilization because even an idle server consumed up to 70% of its peak power [3]. In this regard, it makes sense to operate at high server utilization levels. However, according to [24], there are three main challenges towards ensuring that servers are fully utilized at 100% all the time. These challenges are; diurnal patterns experienced on server workloads and load spikes, which calls for resource over-provisioning leaving servers underutilized, servers are heterogeneous and have changing configuration, thus matching diverse workloads to the servers is not trivial and at high server utilization, there is interference due to resource contention leading to performance loss.
average monthly CPU utilization is above 60% [25]. Another reference model is a threshold setting for physical CPU and memory known as VMware Knowledge Base (VMware KB) [26]. According to VMware KB, 80% CPU utilization is considered a ceiling and a warning if CPU utilization is 90% for 5 minutes. On the other hand, 85% memory utilization should be considered a ceiling and above 95% for 10 minutes is an alarm state.
Another concept that can be used to ensure high server utilization levels is VM sizing. VM size is the measure of computing resources –CPU, Memory and I/O – assigned to a VM [3]. For instance, IaaS cloud VM can be sized to have 1 VCPU, 1 GB memory, 2000 GB network bandwidth and 25 GB of SSD. Most IaaS cloud providers require their users to determine the resource demands of their VMs. For inexperienced users, this is easy. However, for inexperienced users, much resources, than required, are assigned to VMs leading to server underutilization [27], which is a major cause of energy wastage in the cloud. Thus VM sizing ensures that the resources allocated to a user VM
match the VM’s resource demands. For non
-critical workloads, overcommitment can be used
to ensure high resource demands.
Overcommitment involves allocating resources to the VMs than a host PM can afford. For instance, allocating 4 VMs 2GB each of RAM on a PM with 6GB of RAM. Overcommitment assumes that no VM will utilize all the resources that is allocated to it, thus more VMs can be placed in one PM, hence reducing energy consumed as fewer PMs.
B. Wastage of server idle power
An idle server (a server not processing any workload) can consume over 70% of their peak energy [13]. This behaviour of severs does not represent any proportionality in an increase of energy consumption with respect to system throughput. As a result, a server running at 20% can consume 80% of the energy consumed by a server operating at 100% [28]. This represents a huge energy loss when servers run idle without any throughput and is usually the case for many typical servers. In this regard, one can see that this is a cause of idle energy wastage. Moreover, if an application workload does not utilize computing resources in a balanced manner, the idle components will also waste idle energy [29]. For example, if an application workload is CPU intensive, then memory idle energy goes to wastage. Therefore, it is essential that co-located VMs utilize all computing resource without leaving some being idle.
comatose servers and aversion to risk such as IT managers fear that, by removing any previously installed servers, they may interfere with application functions that occasionally run on the servers.
Therefore, to address the problem of idle power wastage, the idle server should be switched off [13]. In addition, heterogeneous workloads should be scheduled to run in servers as opposed to homogenous workloads. Heterogeneous workloads utilize computing resources in a balanced manner thus ensuring that server components make good use of idle energy [30].
C. Performance interference among hosted workloads
Cloud computing is entirely supported by virtualization technology. Workloads are executed in VMs, which share same physical machine. Although server virtualization has well-known advantages such as security isolation of VM and efficient use of server resources, it suffers from performance interference as demonstrated in [31]. This means that, for co-located VMs, the performance of one VM can affect another. Because of inter-VM inference, it has been shown in [32] that network I/O bandwidth can vary by almost 50% due to inter-VM interference. Besides, CPU performance is affected by the time slices allocated to the VMs which are based on a weight (the CPU share for each VM and the hypervisor), a cap (the maximum usage), and the amount of pending tasks for the physical processor.
As consolidation increases (equivalent to increasing the number of VMs running in the same PM), the more instances compete for resources and the hypervisor capacity. As a result of this interference, guest systems may experience high performance variations which lead to unpredictable system behaviour and SLO violations such as a drop in application throughput or an increase in the response time of a web service [33]. According to [30], performance interference is more dominant inhomogeneous workloads. Homogeneous workloads put a hotspot of activity on one particular computing resource and all the workloads have to compete for the capacity of the same hypervisors.
Apart from VM interference, hardware heterogeneity within the same VM instance type can cause substantial performance variation to tenant application [34].
Performance interference affect energy wastage in the sense that, the reduced throughput means that processing workloads takes a long time than expected. As a consequence, more energy is used (energy is a product of time and power).
the authors have have proposed a system called CloudScope, which diagnosing performance interference among co-resident VMs. This system predicts performance interference by using VM information obtained from hypervisor layer and then reassigns the VM to PMs that do lead to high performance interference.
D. Lack of adoption of energy efficient solutions and practices
According to [22], it is only large cloud firms that have adopted energy efficient datacentre practices. Alas, these firms account for only 5 percent of global energy consumption. The rest, 95 percent, is left to small and medium firms, which are terribly energy inefficient because of the lack of adoption of energy efficient solutions and practices. Such solutions and practices include server and network consolidation, datacentre wide thermal management, purchasing and installing energy efficient hardware to replace old hardware, power planning and management (such as checking from time to time to identify and remove idle servers) and installation of energy management software [22].
Although rising energy costs is an incentive to adoption of energy efficient practices, pressure to keep up technological advancements have made many organizations to treat energy efficiency with low priority [22]. This has led to organizations not adopting even the simple and cost-effective power management software, which can monitor measure and manage both hardware level and software level energy usage. For example, energy management software
offered by TSO Logic is relatively affordable and can measure datacentre power demands, active and comatose servers and energy cost, as well show how these change over time and assist in relocating application workloads and shutting down servers [36]. Nevertheless, some datacentre operators feel that by adopting automated energy usage monitoring, their employment is threatened and thus they discourage its adoption [22]. Moreover, power-saving features embedded in hardware, which can monitor hardware utilization and report to datacentre dashboards, are often disabled because of the perceived management complexity and risk associated with switching off servers. In this regard, even organization running full-scale cloud clusters do not deploy energy management solutions.
In addition, cloud providers have poor habits of procurement, which includes focusing on initial cost rather than TCO [22]. When a procurement procedure focusses only on initial purchase rather than long-term electricity costs, it may miss on energy efficient equipment in the market. For example, [37] reports that with the arrival of
Intel’s Sandy Bridge and Standard Performance
for implementing energy efficient practices because they are not evaluated based on the amount of energy saved. In fact, IT staff have no access to power bills and most of them are more concerned with software costs. This division of accountability and split incentives are a barrier to adoption of energy efficient solutions.
E. Lack of common or efficient server utilization and energy efficiency metrics Server utilization metric is the unit of measure of the percentage of time during which a server is busy processing workload tasks [5]. Lack of a common standardized server utilization metric has been a cause for energy wastage for many decades [22]. Increasing server utilization offers the best option for improving datacentre IT energy productivity as compared to PUE and Power Supply Efficiency (PSE) [38]. In fact, below 50 percent server utilization, a continued increase in server utilization offers the highest energy usage productivity because of the idle energy [3] [5] [24] [28].
For many years, CPU utilization has been the measure of server utilization but it is not the best since different application workloads have different CPU intensities with some of them being memory, network or I/O intensive than CPU-intensive. Besides, CPU shows the amount of work with no way of determining if that work is useful or otherwise [22]. As a result, a number of new metrics have sprung up to take care of other datacentre parameters. For example, the [39] developed a metric based on datacentre design, executing software, datacentre hardware, CPU, memory and disk as parameters. [39] also developed another metric, which attempts to
measure server utilization at the application level, for example tracking the number of emails sent by a server.
Other metrics include Power to Performance Effectiveness (PPE), which measures server
performance per kilowatt, and
SPECpower_ssj2008v1.12, which provides a means to measure power in conjunction with a performance metric. Unfortunately, there is slow adoption of these metrics because they are complicated to implement and cannot deliver complete reports on their own without the need multiple implementations. Furthermore, different server designs have different levels of energy efficiency hence cannot work across all server designs. Therefore, average CPU utilization and average datacentre utilization (average server utilization when not in sleep mode over period), will remain in use until better metric better is developed.
On the side of energy efficiency metrics, [39] has offered two datacenter power efficiency metrics: Power Usage Effectiveness (PUE) and Datacenter Efficiency (DCE). PUE is defined as the total power consumed by the datacenter divided by the power used by the IT equipment, as shown in equation 1.
PUE=Total Facility Power
IT Equipment Power (1)
DCE is the ratio of IT datacenter energy efficiency and is defined as the reciprocal of PUE as shown in equation 2
DCE=IT Equipment Power
Total Facility Power (2)
DCE= 1
However, these two metrics do not communicate a lot of information because they simply measure how much of the energy entering a datacenter facility is used to power the computing devices within, versus the amount used for cooling and overhead of the facility. Another performance metric that can be used to measure and rank the energy efficiency of servers is Performance per Watt (PPW) [13]. PPW can be defined as “…the term performance per watt is a measure of the energy efficiency of computer architecture or computer hardware. It can be represented as the rate of transactions or computations or a certain performance score that can be delivered by a computer for every watt of power consumed". This metric is important because it ranks servers regardless of their architecture, manufacturer or size. For instance, PPW of a CPU can be computed according to equation 4. The higher the PPW value, the higher the energy efficiency of the server.
𝑃𝑃𝑊𝑐𝑝𝑢=
𝐼
𝑃 (4)
where PPWcpu is the PPW of a CPU, I is the number of instructions processed by the processor per second in MIPS and P is the CPU power. The proposed model (equation 4) has been used successfully in [30] to analyze the effect of consolidation on performance different types of workloads.
F. Computing units are not energy proportional
Energy consumption of computing units is not proportional to processing workload: when server load is low, energy consumption is still high. According to [40], proportional computing is an energy efficiency technique where energy
consumption by servers is proportional to the workload. From this definition, idle computers should not consume energy. Unfortunately, as seen earlier, an idle server (a server not processing any workload) can consume over 70% of their peak energy. To achieve proportional computing, dynamic voltage and frequency scaling (DVFS) is used. DVFS is an energy saving technique in computer architecture that is used to save energy when server load is low [3]. In this technique, the frequency and voltage of the CPU is scaled dynamically to relate with the amount of server load. According to this approach, if the server load is at X percent of peak load, then the energy consumption should be at X percent of peak energy. Dynamic Voltage and Frequency scaling of CPU is applied for improving the energy consumption of the datacentre. The frequency of CPU is decided according to the workload by the resource controller, which is installed on each server [5].
disk and network) are much narrower (< 50% for DRAM, 25% for disk drives, and 15% for network switches) [5].
In [42], the authors have proposed a DVFS-enabled Energy-efficient Workflow Task Scheduling algorithm (DEWTS) tool, which uses DVFS and their experiments report a 46.5% energy savings. Conversely, as DVFS is too dependent on the hardware, the resulting energy savings are low compared to other methods [13]. Although DVFS is a good solution, its savings are small because an idle server will still consume over 70% of peak energy [3].
Because of the observed failures of DVFS, powering down or switching off servers when they are not in use is a viable option and has been supported by a number of researchers [5] [13] [20].
IV.CONCLUSION
In this paper, we have reviewed the most common causes of energy wastage in datacenter servers. Further we have recommended remedies to the identified causes. The remedies have been supported by previous research work.
V. REFERENCES
[1] A. Rallo, "Industry Outlook: Data Center Energy Efficiency," 2014. [Online]. Available: http://www.datacenterjournal.com/industry-outlook-data-center-energy-efficiency/. [Accessed 4 August 2015].
[2] G. Albert, H. James, A. M. David and P. Parveen, "The cost of a cloud: research problems in data center networks," The ACM Digital Library is published by the Association for Computing Machinery, vol. 39, no. 1, 2009.
[3] F. P. Sareh, "Energy-Efficient Management of Resources in Enterprise and Container-based Clouds," The University of Melbourne , 2016.
[4] G. K. V. Rao and K. Premchand, "Scheduling Virtual Machines across Data Centres in accordance to availability of Renewable Sources of Energy," International Journal Of Engineering And Computer Science, vol. 5, no. 10, 2016.
[5] B. Anton, "Energy-Efficient Management of Virtual Machines Data Centers for Cloud Computing," THE UNIVERSITY OF MELBOURNE, 2013.
[6] A. Khosravi, "Energy and Carbon-Efficient Resource Management in Geographically Distributed Cloud Data Centers," The University of Melbourne, Melbourne, Australia, 2017.
[7] I. Salam, R. Karim and M. Ali, "Proactive dynamic virtual-machine consolidation for energy conservation in cloud data centres," Journal of Cloud ComputingAdvances, Systems and Applications, vol. 7, no. 1, 2018.
[8] R. Hintemann and J. Clausen, "Green Cloud? The current and future development of energy consumption by data centers, networks and end-user devices," in ICT4S Conference, Amsterdam, 2016.
[9] F. P. Sareh, "Energy-Efficient Management of Resources in Enterprise and Container-based Clouds," The University of Melbourne , 2016.
[11] R. M. Sharma, "The Impact of Virtulization in Cloud Computing," International Journal of Recent Development in Engineering and Technology, vol. 3, no. 1, 2014.
[12] S. Amri, H. Hamdi and Z. Brahmi, "Inter-VM Interference in Cloud Environments: A Survey," in 2017 IEEE/ACS 14th International Conference on Computer Systems and Applications, Hammamet, Tunisia, 2017.
[13] G. Chaima, "Energy efficient resource allocation in cloud computing Enviroment.," Institut National des T´el´ecommunications, Paris, 2014.
[14] R. Neha and J. Rishabh, "CLOUD COMPUTING: ARCHITECTURE AND CONCEPT OF VIRTUALIZATION," International Journal of Science, Technology & Management, vol. 4, no. 1, 2015.
[15] B. Esha, Y. J. S. and I. Biju, "Energy Efficient Virtual Machine Placement using Enhanced Firefly Algorithm," Multiagent and Grid Systems - An International journal, pp. 167-198, 2016.
[16] E. Gorelik, "Cloud Computing Models," MIT, 2013.
[17] H. AlJahdali, A. Albatli, P. Garraghan, P. Townend, L. Lau and J. Xu, "Multi-Tenancy in Cloud Computing," in 8th IEEE International Symposium on Service-Oriented System Engineering, Oxford, UK, 2014.
[18] B. Anton and B. Rajkumar, "Energy Efficient Resource Management in Virtualized Cloud Data Centers," in 10th IEEE/ACM International Conference on Cluster, Cloud and Grid
algorithm to schedule virtual machines," International Journal of Applied Mathematics and Computer Science, vol. 24, no. 3, 2014.
[21] G. Akhil and C. Navdeep, "A Proposed Approach for Efficient Energy Utilization in Cloud Data Center," International Journal of Computer Applications (0975 – 8887), vol. 115, no. 11, 2015.
[22] Natural Resources Defense Council (NRDC), "Data Center Efficiency Assessment," NRDC, 2014.
[23] M. Dabbagh, B. Hamdaoui, M. Guizani and A. Rayes, "Toward energy-efficient cloud computing: Prediction, consolidation, and overcommitment," IEEE Network, vol. 29, no. 2, 2015.
[24] C. Delimitrou, "Improving Resource Efficiency In Cloud Computing.," Stanford University, 2015.
[25] P. Xuesong, P. Barbara and V. Monica, "Virtual Machine Profiling for Analyzing Resource Usage of Applications," in International Conference on Services Computing, Milano, Italy, 2018.
[26] VMware, "Performance Best Practices for VMware vSphere 6.0," VMware, Inc, Palo Alto, CA, 2015.
[27] P. Jemishkumar, I.-L. Y. Vasu, B. Farokh, Jindal, X. Jie and G. Peter, "Workload Estimation for Improving Resource Management Decisions in the Cloud.," in 2015 IEEE TwelfthInternational Symbosium on Autonomous Decentralized Systems , 2015.
[28] T. Mastelic, A. Oleksiak, H. Claussen, I. Brandic, J.-M. Pierson and A. V. Vasilakos, "Cloud computing: survey on energy efficiency," ACM Computing Surveys, vol. 47, no. 2, 2015.
[30] K. M. Derdus, V. O. Omwenga and P. J. Ogao, "The Effect of Cloud Workload Consolidation on Cloud Energy Consumption and Performance in Multi-Tenant Cloud Infrastructure," International Journal of Computer Applications (0975 – 8887), vol. 181, no. 37, pp. 47-53, 2019.
[31] X. Pu, L. Liu, Y. Mei, S. Sivathanu, Y. Koh and C. Pu, "Understanding Performance Interference of I/O Workload in Virtualized Cloud Environments," in 2010 IEEE 3rd International Conference on Cloud Computing, Miami, FL, USA, 2010.
[32] R. Nathuji, A. Kansal and A. Ghaffarkhah, "Q-clouds: managing performance interference effects for QoS-aware clouds," in EuroSys '10 Proceedings of the 5th European conference on Computer systems, Paris, France, 2010.
[33] X. Chen, L. Rupprecht, R. Osman, P. Pietzuch, F. Franciosi and W. Knottenbelt, "CloudScope: Diagnosing and Managing Performance Interference in Multi-tenant Clouds," in 2015 IEEE 23rd International Symposium on Modeling, Analysis, and Simulation of Computer and Telecommunication Systems, 2015.
[34] F. Xu, F. Liu and H. Jin, "Heterogeneity and Interference-Aware Virtual Machine Provisioning for Predictable Performance in the Cloud," IEEE Transactions on Computers, vol. 65, no. 8, pp. 2470 - 2483, 2016.
[35] G. Dhiman, "Dynamic Workload Characterization for Energy Efficient Computing," University of California, 2011.
[36] TSO Logic, "TSO Logic," 2017. [Online]. Available: http://tsologic.com/. [Accessed 4 January 2017].
[37] B. Subramaniam and W.-c. Feng, "Towards Energy-Proportional Computing Using
Subsystem-Level Power Management," in
Proceedings of the 4th ACM/SPEC
International Conference on Performance Engineering, Prague, Czech Republic, 2013.
[38] V. Sanjeev, "INNOVATIONS IN TECHNOLOGY: CLOUD COMPUTING AND ENERGY EFFICIENCY," International Journal of Engineering and Management Sciences, vol. 6, no. 2, 2015.
[39] Green Grid, "THE GREEN GRID DATA CENTER COMPUTE EFFICIENCY METRIC: DCcE," 2010.
[40] B. Luiz and H. Urs, "The Case for Energy-Proportional Computing," IEEE Computer Society , 2007.
[41] V. J. Patel and H. A. Bheda, "Reducing Energy Consumption with Dvfs for Real-Time Services in Cloud Computing," IOSR Journal of Computer Engineering (IOSR-JCE), vol. 16, no. 3, 2014.
[42] Z. Tang, L. Qi, Z. Cheng, K. Li, S. U. Khan and K. Li, "An Energy-Efficient Task Scheduling Algorithm in DVFS-enabled Cloud Environment," Journal of Grid Computing , vol. 14, no. 1, 2016.
Cite this article as :
Kenga Mosoti Derdus, Vincent Oteke Omwenga, Patrick Job Ogao, "Causes of Energy Wastage in Cloud Data Centre Servers : A Survey ", International Journal of Scientific Research in Computer Science, Engineering and Information Technology (IJSRCSEIT), ISSN : 2456-3307, Volume 5 Issue 3, pp. 416-430, May-June 2019.
Available at doi :
https://doi.org/10.32628/CSEIT1953139
Table 1 : A summary of review of causes of energy wastage in cloud datacenter servers
Cause Remedy Limitations of remedy Reference
Low server utilization -VM sizing
-Resource over-commitment
-VM sizes may be over-estimated by inexperienced users
-Over-commitment is not a good approach incases of overload
[3],[27], [23],
Wastage of idle energy -Switch off idle servers -Schedule
heterogeneous workloads
-It is difficult to tell if switching off will save energy as compared to leaving server in active state
-In IaaS Public clouds, CSPs do not have control of what type of workloads their user executes.
[17],[13],[30]
Performance inference -Schedule heterogeneous workloads
-Diagnose, measure or predict performance interference
-In IaaS Public clouds, CSPs do not have control of what type of workloads their user execute -Running applications to diagnose or measure performance interference creates additional processing overheads.
[12], [33], [30]
Lack of adoption of energy efficient solutions and practices
-Server and network consolidation
-Purchasing and installing energy efficient hardware to replace old hardware -Datacenter wide thermal management. -power planning and management
- Energy efficiency treated with low priority by IT staff.
-Datacenter wide thermal management perceived management complexity.
-IT departments in most cloud service providers do not pay their power bills, finance department does.
- IT department are not evaluated based on the amount energy saved.
Because of division of accountability and split incentives, no one seems to take energy efficiency seriously.
[22], [36],[37]
Lack of common or efficient server utilization and energy efficient metric
-Use performance per watt (PPW).
- PPW is not a common metric [13],[30]
Computing units are not energy
proportional
Use of DVFS -Works well only on CPU bound tasks because dynamic power ranges for other components -Hardware-based and energy savings are low
![Figure 4. Traditional physical server versus virtual server [11]](https://thumb-us.123doks.com/thumbv2/123dok_us/1049386.1131222/3.612.319.533.197.312/figure-traditional-physical-server-versus-virtual-server.webp)