Visualization for Coreference Annotation
Andre Burkovski and Gunther Heidemann
Intelligent Systems Group
Institute for Visualization and Interactive Systems University of Stuttgart
{firstname.lastname}@vis.uni-stuttgart.de
Abstract
The annotation of documents with linguis-tic information requires time-consuming and therefore expensive manual annota-tion. Especially, a complex task, like coreference resolution, needs large data sets for the training of supervised machine learning methods. We present a tool which combines visualization techniques and un-supervised machine learning to support the annotation of documents with coref-erence information. Self-organizing Maps are used to cluster similar data and visu-alize the feature space. For link visualiza-tion, precise annotavisualiza-tion, and error correc-tion a matrix-based coreference visualiza-tion is used which exploits the transitive property of the coreference relation.
1 Introduction
The task of finding noun phrases which refer to the same discourse entity in a plain text is called coreference resolution. Many applications in in-formation retrieval (Nicolov et al., 2008), machine translation, and text summarization (Mitkov et al., 2007) use coreference resolution to improve the results. Currently, the popular Jeopardy! winner machine “Watson” uses a coreference resolution module among other modules for question answer-ing (Ferruci et al., 2010).
In many cases, coreference is resolved using su-pervised machine learning methods. These meth-ods need large amounts of training samples. Yet, particularly for languages other than English, such data sets are rare and they mostly contain rela-tively few samples. Another problem is that super-vised methods which are trained on a specific do-main, such as news articles, may degrade on texts from other domains, like books or reports. E.g. Bakkenson and Soroka (2010) report on how the genre influences pronominal anaphora resolution.
The manual annotation of a document with coreference information is time consuming, be-cause it depends not only on the background knowledge of the annotator, but also requires a high level of concentration to avoid annotation er-rors. Most annotation tools use text-based visual-izations to show and highlight the noun phrases for coreference annotation. However, using only text-based visualizations tools has a major drawback. Annotators are prone to annotation errors because they often need to repeatedly read passages in a text for every new unlabeled noun phrase. Mitkov et al. (2000) introduce some strategies for tors to reduce errors and to accelerate the annota-tion speed, but the annotaannota-tion of large data sets still is a problem. Rule-based or unsupervised machine learning methods may be used to highlight prob-able coreference pairs and chains and to support the annotators in identifying coreferences. Such an approach further reduces the time spent on the search of suitable coreference candidates.
In our approach we address the annotation effi-ciency from the visualization and interaction point of view. We propose a combination of unsu-pervised machine learning method and visualiza-tions for annotation purposes. We use the Self-organizing Map (SOM) to visualize gropus of sim-ilar links of noun-phrases. These groups are fur-ther visualized with a coreference matrix, which takes advantage of the equivalence relation prop-erty of the coreference relationship. In such a way annotators are able to quickly identify conflicting annotations and to correct them.
2 Related Work
Generally, coreference annotation tools, like CorefDraw (Harabagiu et al., 2001), GATE (Cun-ningham et al., 2002), PALinkA (Or˘asan, 2003), MMAX2 (M¨uller and Strube, 2006), or BART (Versley et al., 2008) provide only a text-based visualization of coreference information. The
cently introduced Reconcile tool (Stoyanov et al., 2009), which provide resources for developing a coreference resolution system, also uses plain text for presentation of coreference information.
All text-based visualizations present corefer-ence information via a color scheme, link identi-fication by indices, or visual edges between noun phrases. This does not show the the feature space or the similarity between links. Such visualiza-tions are also limited by the size and the number of lines/colors a user can distinguish. This makes it difficult to analyze large chains, inter-document coreference or many links at once.
Advanced visualizations for coreference reso-lution exist. Witte and Tang (2007) present a graph-based visualization of coreferences. The framework manage coreferences as topic maps. The views used in the framework provide a good overview about the relationship of noun phrases in a link. The authors address the problem that the visualization of coreferences consists solely of highlighted plain text, possibly including edges for marking a coreference relation. We agree with them that textual visualization slows down the user and also makes cross document annotation diffi-cult. Nonetheless, their representation only serves to visualize and navigate the space of already an-notated coreferences. Another visualization cre-ated by Zeldes et al. (2009) add parse trees to plain text visualization to support annotation decisions. Still, visualization of coreference information is somewhat rare.
In contrast, we aim to visualize the actual coref-erences as well as the coreference feature space and provide interaction methods for annotation in both visualizations. The basic idea is to use SOMs for clustering similar data and allow a fast and structured approach to annotation. Bekel et al. (2005) and Moehrmann et al. (2011) success-fully applied this technique for image annotation. Instead of images we use pairs of noun phrases (links) as input. We extend the work of (Burkovski et al., 2011), where SOMs are used to create fea-ture space visualizations of links and focus on methods for coreference annotation. We augment the SOM visualization with annotation informa-tion and addiinforma-tional matrix-based coreference visu-alization for a more precise annotation and anno-tation error detection supported by a visualization for links in a text-based manner. All visualizations are linked together via multiple coordinated views
(Roberts, 2007). Such an approach allows annota-tors to independently cycle through different rep-resentations of the data and systematically anno-tate different sets of links.
3 Coreference and Annotation
Coreference resolution is an active research area. Elango (2005) provide a detailed survey and Ng (2010) summarizes challenges and recent machine learning advances. In this work we use a pairwise model for coreferences: two noun phrases are con-sidered to be coreferent if by replacing each other they do not change the meaning of a sentence. These two noun phrases form a link. The corefer-ence relationship is reflexive, symmetric and tran-sitive and therefore an equivalence relation. This property is used to automatically deduce and cre-ate additional annotations as well as to perform er-ror detection of the manual annotation. A set of noun phrases which all refer to the same entity is called a chain. In a coreference chain every phrase is coreferent to every other phrase in that chain due to the transitive and symmetry property.
The main purpose of annotated data is to be used as a training and test set in supervised ma-chine learning methods. One can argue, that it is enough to annotate only coreferent links to form coreference chains as one can create non-coreferent samples by creating links between dis-junct chains. Such an approach would neglect the presence of non-referential noun phrases in a text, such as idioms, duration phrases, and others. Yet, links of these non-referential noun phrases are use-ful samples for supervised learning. Therefore, it is beneficial to annotate such links as well. Al-though a non-coreferent link does not guarantee that a noun phrase in the link is non-referential, it reduces the annotation errors. An erroneous anno-tation of a noun phrase as a non-referential would result in many false negative samples in the train-ing set.
4 Visualization Methods
from links of a pairwise coreference model and let the SOM create groups of similar links. SOMs are easy to visualize and are rather intuitive. Second, the links in the selected clusters are visualized us-ing the coreference matrix (Figure 2). The corefer-ence matrix allows easy and systematic interaction for annotation. It shows annotations which con-tradict the transitive property of the coreference relationship and allows annotators to identify and resolve annotation errors. The visualizations are additionally supported by a traditional text-based visualization of links (not shown here).
4.1 Self-organizing Maps
A SOM is an unsupervised machine learning method where artificial neurons are connected to each other by a low dimensional topology (Ko-honen, 1990). This topology is applied to the high-dimensional data and the SOM learning algo-rithm tries to create a suitable projection of high-dimensional data. Thus, similar feature vectors in the feature space will be close in the projection space. Such coherence between the low dimen-sional map and high dimendimen-sional data allows cre-ation of intuitive visualizcre-ations. The most popular visualization is the U-Matrix (Ultsch and Siemon, 1990) and its variants. The U-Matrix shows the low-dimensional grid with nodes and edges and color-codes them based on their distance in the high-dimensional feature space. Further, for a sys-tematic annotation we use the component planes visualization introduced by Vesanto (1999). Com-ponent planes visualize the influence of one or more features to cluster formation.
To train the SOM, we use feature vectors cre-ated from pairs of noun phrases. We used a sub-set of features inspired by the popular feature sub-set of Ng and Cardie (2002). Although using basic features, the SOM already clusters the data in a way, that annotators may annotate whole clusters with a low error rate. However, the SOM does notperform unsupervised coreference resolution. Instead, the SOM and its visualization provides methods to systematically select nodes and clus-ters with similar properties. For example, using component planes for string matching and Word-net distance annotators are able to select areas of the SOM where links match in their head words and also are semantically close to each other. In-teraction allows to annotate whole clusters as well as to show the actual links in selected clusters. For
the visualization of links we use the coreference matrix.
4.2 Coreference Matrix
Transitive relations can be easily visualized in a matrix. Since coreference is symmetric, for anno-tation purposes we only need to show the upper triangular matrix. Each element of the matrix rep-resents a link between the phrase in the row and the phrase in the column. Rows and columns are ordered by the text position of a phrase. Annota-tors can systematically cycle through the matrix entries and annotate the links accordingly. The contents of the links are visualized by displaying the surrounding text in another coordinated text-based visualization (not shown here). However, the key to an efficient annotation is an intelligent interaction technique. Annotators do not need to explore all entries in the matrix, but only entries in the upper triangular matrix close to the main diag-onal, because of the transitive property.
For example, let i, j, k, l be phrases
in the according column/row ordered by
their position in the text. Let every link (i, j),(i, k),(i, l),(j, k),(j, l),(k, l) be corefer-ent. To annotate the links, the annotator only has to visit and label the cells(i, j),(j, k),and(k, l). Due to the transitive property, the annotation for the remaining links can be done automatically.
Another feature of the coreference matrix is to show annotation errors. The coreference matrix is able to highlight links that violate the transitive property. Such errors are created by a contradict-ing annotation by the annotator. A phraseacannot be coreferent to a phraseband non-coreferent to a phrase c when both phrases b and c are corefer-ent. In such cases, annotators are able to correct the links and modify the annotation accordingly.
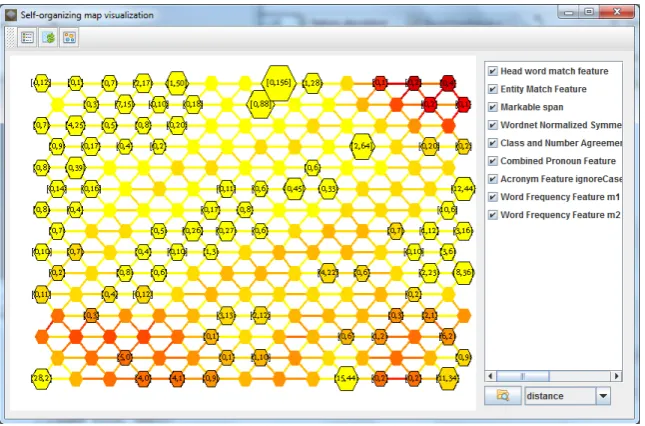
Figure 1: Self-organizing Map visualization of coreference feature space for links extracted from Ontonotes corpus (Pradhan et al., 2007). The feature vectors of links are assigned to nodes in the SOM (black border). The size of the nodes is a hint for the amount of links that are assigned to a node. The label indicates the number of links which are annotated coreferent and non-coreferent separated by a comma. Additional labels are possible e.g. the number of links with no annotation or the proportion of coreferent and non-coreferent links in a node. Annotators are able to select individual features (com-ponent planes) to show their influence in the SOM. By selecting individual nodes or group of nodes annotators select the contents in the nodes (links) and enabling the to these links. Additionally, the links are highlighted in the coreference matrix for further inspection and error correction.
(a) Annotation Overview (b) Zoom and Details
the transitive property) and non-coreferent anno-tations to that chain in a single pass. The second interaction strategy allows the creation of multiple chains. From multiple chains non-coreferent sam-ples are deduced by creating links with phrases from disjunct chains.
5 Annotation Strategies using Visualizations
The proposed visualizations allow additional an-notation strategies to the guidelines presented by Mitkov et al. (2000).
SOMs can be trained for nominal to nominal noun phrase annotation only. In that case, clus-ters of similar noun phrases, as defined by the fea-tures, can lead to faster recognition of coreferent and non-coreferent links in matrix-based and text-based visualizations. After the annotation of nom-inal phrases, the SOM can be trained on nomnom-inal to pronominal links. By annotating a pronoun to a noun phrase in a chain, an annotation for all noun phrases in the chain is created automatically. Al-ternatively, the SOM can be trained with all kinds of noun phrases and additional features. Anno-tators are then able to use the component planes of the SOM to systematically investigate differ-ent combinations of noun phrases as shown by Burkovski et al. (2011).
Using the coreference matrix, annotators can follow two different strategies. First, annotators can use the SOM to select nodes with good indi-cators for coreferent or non-coreferent links. Such indicators depend of the features used. E.g. the head match feature is a good indicator for corefer-ence. Annotators can easily identify regions with interesting features by using component planes of the SOM. Subsequently, by selecting the SOM nodes, the links are highlighted in the matrix and annotators are able to annotate them. In many cases most links are annotated automatically due to the transitive property. Second, starting with the first noun phrase, annotators can use the ma-trix to annotate some links in advance. The an-notations will be reflected in the SOM, and allow annotators to see potentially coreferent and non-coreferent regions in the SOM. Also, using the SOM for general, and probably erroneous anno-tation the annotators will discover conflicts in the annotation. With the coreference matrix visualiza-tion it is easier to resolve conflicts in annotavisualiza-tion than to annotate all links correctly in one single pass.
6 Conclusion
In this work we presented a visualization approach to coreference annotation. Instead of using tra-ditional text-based visualization only, we propose Self-organizing Maps (SOM) and a matrix-based visualization of links in addition to text-based vi-sualizations. SOM visualizes the feature space of the links where annotators may systematically choose regions with interesting links by utilizing component planes for feature space navigation. The matrix-based link visualization with interac-tion techniques allows a detailed and precise an-notation of links. The coreference matrix exploits the transitive property of the coreference relation to detect and highlight annotation errors made in the process. Using visualizations as multiple co-ordinated views, annotators are able to systemat-ically create coreference annotations. Our vision is that the next generation of annotation tools will employ more visualization techniques for a more efficient annotation of the data1.
Future work includes additional coreference resolution methods (other classifiers or rule-based systems) for the links in a SOM node which may provide confidence values. This can easily be vi-sualized in the matrix or in the SOM by using a color gradient. For such links, annotators are able to quickly navigate to the matrix entries and in-spect the proposed automatic annotation. Addi-tional interaction techniques and graph-based vi-sualizations will be investigated which may fur-ther improve and support a systematic annotation. In the future, we plan to show the efficiency of the tool by conducting a long term user study.
References
Michael Bakkenson and Barry I. Soroka. 2010. Impor-tance of genre in pronominal anaphora resolution. In International Conference on Artificial Intelligence, pages 900–906.
Holger Bekel, Gunther Heidemann, and Helge Ritter. 2005. Interactive image data labeling using self-organizing maps in an augmented reality scenario. Neural Networks, 18(5–6):566–574.
Andre Burkovski, Wiltrud Kessler, Gunther Heide-mann, Hamidreza Kobdani, and Hinrich Sch¨utze. 2011. Self Organizing Maps in NLP: Exploration of Coreference Feature Space. InWorkshop on Self-Organizing Maps, pages 228–237.
1The tool will be available at the project page: