University of Windsor University of Windsor
Scholarship at UWindsor
Scholarship at UWindsor
Electronic Theses and Dissertations Theses, Dissertations, and Major Papers
2011
Utilizing a systems engineering approach to evaluate end-of-life
Utilizing a systems engineering approach to evaluate end-of-life
opportunities for complex automotive seat subassemblies
opportunities for complex automotive seat subassemblies
Siobhan Barakat
University of Windsor
Follow this and additional works at: https://scholar.uwindsor.ca/etd
Recommended Citation Recommended Citation
Barakat, Siobhan, "Utilizing a systems engineering approach to evaluate end-of-life opportunities for complex automotive seat subassemblies" (2011). Electronic Theses and Dissertations. 154.
https://scholar.uwindsor.ca/etd/154
This online database contains the full-text of PhD dissertations and Masters’ theses of University of Windsor students from 1954 forward. These documents are made available for personal study and research purposes only, in accordance with the Canadian Copyright Act and the Creative Commons license—CC BY-NC-ND (Attribution, Non-Commercial, No Derivative Works). Under this license, works must always be attributed to the copyright holder (original author), cannot be used for any commercial purposes, and may not be altered. Any other use would require the permission of the copyright holder. Students may inquire about withdrawing their dissertation and/or thesis from this database. For additional inquiries, please contact the repository administrator via email
UTILIZING A SYSTEMS ENGINEERING APPROACH TO EVALUATE END‐OF‐LIFE
OPPORTUNITIES FOR COMPLEX AUTOMOTIVE SEAT SUBASSEMBLIES
by
Siobhan Barakat
A Thesis
Submitted to the Faculty of Graduate Studies through Industrial and Manufacturing Systems Engineering
in Partial Fulfillment of the Requirements for the Degree of Master of Applied Science at the
University of Windsor
Windsor, Ontario, Canada
2011
UTILIZING A SYSTEMS ENGINEERING APPROACH TO EVALUATE END‐OF‐LIFE
OPPORTUNITIES FOR COMPLEX AUTOMOTIVE SEAT SUBASSEMBLIES
by
Siobhan Barakat
APPROVED BY:
______________________________________________ Dr. Edwin Tam
Department of Civil and Environmental Engineering
______________________________________________ Dr. Michael Wang
Department of Industrial and Manufacturing Systems Engineering
______________________________________________ Dr. R. Jill Urbanic, Advisor
Department of Industrial and Manufacturing Systems Engineering
______________________________________________ Dr. Reza Lashkari, Chair of Defense
Department of Industrial and Manufacturing Systems Engineering
iii
DECLARATION OF CO-AUTHORSHIP/PREVIOUS PUBLICATION
This thesis includes 1 original paper that has been previously submitted for publication in an international peer reviewed conference, as follows:
Thesis Chapter Publication title/full citation Publication status*
Throughout A Systematic Investigation for Reducing Shredder Residue to Complex Automotive Seat
Subassemblies Published
I certify that I have obtained a written permission from the copyright owner(s) to include the above published material(s) in my thesis. I certify that the above material describes work completed during my registration as graduate student at the University of Windsor.
I declare that, to the best of my knowledge, my thesis does not infringe upon anyone’s copyright nor violate any proprietary rights and that any ideas, techniques, quotations, or any other material from the work of other people included in my thesis, published or otherwise, are fully acknowledged in accordance with the standard referencing practices. Furthermore, to the extent that I have included copyrighted material that surpasses the bounds of fair dealing within the meaning of the Canada Copyright Act, I certify that I have obtained a written permission from the copyright owner(s) to include such material(s) in my thesis.
iv
ABSTRACT
v
ACKNOWLEDGEMENTS
I sincerely would like to thank my advisor, Dr. Jill Urbanic for her sincere supervision and guidance. Through her direction, I was able to grow as a researcher and develop a systems approach of problem solving to enable myself to solve any problem in both real-life and research.
I would also like to thank the professors sitting on my thesis committee, Dr. Michael Wang and Dr. Edwin Tam, whom assisted in broadening the scope of my thesis while highlighting contributions that I had not considered. Both professors, coming from different backgrounds, guided me to look at the problem from all perspectives while ensuring practicality.
vi
TABLE OF CONTENTS
DECLARATION OF CO-AUTHORSHIP/PREVIOUS PUBLICATION iii
ABSTRACT iv
ACKNOWLEDGEMENTS v
LIST OF TABLES viii LIST OF FIGURES x
LIST OF EQUATIONS xii LIST OF ACRONYMS xiii INTRODUCTION 1
1.1. General Overview ... 1
1.2. Objectives of Research ... 5
1.3. Organization of Research ... 5
REVIEW OF LITERATURE 6 2.1. Scope of Recycling in Ontario ... 6
2.2. End-of-Life Vehicle Management ... 8
2.2.1. Dismantling ... 9
2.2.2. Shredding ... 13
2.2.3. Material Separation ... 14
2.3. Government Roles in ELV Management ... 15
2.3.1. Directive 2000/53/EC of the EU on End-of-Life Vehicles ... 16
2.3.2. Waste Diversion Act 2002 (Canada) ... 17
2.4. Plastic Recycling... 19
2.5. Research Motivation ... 22
INDUSTRIAL BENCHMARKING 24 DESIGN METHODOLOGY 28 4.1. 2001 Dodge Neon ... 28
vii
4.3. 2001 Dodge Caravan ... 35
ANALYSIS OF RESULTS 40 5.1. MOST Analysis ... 40
5.2. Teardown Analysis ... 41
5.3. Disassembly vs. Dismantling ... 45
5.4. Complexity Analysis... 48
5.4.1. Heuristic Complexity Metrics ... 49
5.4.2. Disassembly & Dismantling Time Complexity Model ... 53
5.4.3. Sensitivity of Model ... 60
5.4.4. Counting Components and Connections ... 62
5.4.5. Case Study ... 64
5.5. Summary ... 67
BUSINESS MODEL 69 6.1. Business Model with Experimental Scenario ... 69
6.2. Business Model with Real World Scenario ... 74
6.3. Business Model with Polyurethane Scenario ... 77
CONCLUSIONS 80 7.1. Future Work ... 81
REFERENCES 83 APPENDICES 88 Disassembly Structure for 2001 Dodge Neon ... 89
Dismantling Structure for 2001 Dodge Neon ... 90
Vehicle Breakdown Statistic Summary ... 91
Case Study Disassembly MOST Time ... 125
Case Study Dismantling MOST Time ... 126
viii
LIST OF TABLES
Table 1 Material composition of 2001 Dodge Neon ... 31
Table 2 Material composition percentages of 2001 Dodge Neon ... 31
Table 3 Material Composition of 2001 Dodge Intrepid ... 34
Table 4 Material Composition Percentages of 2001 Dodge Intrepid ... 34
Table 5 Material Composition of 2001 Dodge Caravan ... 38
Table 6 Material Composition Percentages of 2001 Dodge Caravan ... 38
Table 7 Disassembly time for 2001 Dodge Neon ... 40
Table 8 Disassembly time for 2001 Dodge Intrepid ... 41
Table 9 Disassembly time for 2001 Dodge Caravan ... 41
Table 10 Table of disassembly and dismantling times for all three vehicles disassembled ... 47
Table 11 Types of connections and their corresponding normalizing factors ... 56
Table 12 Connection and component count ... 60
Table 13 Partial calculations for vehicle seats ... 61
Table 14 Comparison between the calculated and actual disassembly and dismantling times ... 62
Table 15 Actual and estimated number of components and connections ... 64
Table 16 Difference between actual and estimated component count ... 65
Table 17 Difference between actual and estimated connection count ... 65
Table 18 Calculations for disassembly and dismantling times ... 65
Table 19 Percentage of accuracy in case study ... 66
Table 20 Summary of complexity disassembly and dismantling time model... 67
Table 21 Summary statistics of all three vehicles that were disassembled ... 69
Table 22 Amount of ferrous recovered per minute ... 70
Table 23 Sensitivity analysis of the business plan (Neon) ... 72
ix
Table 25 Light vehicle sales and retired vehicles by segment in Canada in 2006 ... 74
Table 26 Estimated number of components and connections by vehicle segments ... 74
Table 27 Estimated dismantling times for each vehicle segment ... 75
Table 28 Table outlining the total number of vehicles required to be dismantled to break even .. 76
Table 29 Estimated annual revenue and diverted SR from each vehicle segment ... 76
Table 30 Estimated expenses and profit ... 77
Table 31 Identifies all possible scenarios for the business model and the related profits ... 77
Table 32 Historical baled PU foam prices (RecycleNet, 2010) ... 78
Table 33 Summary statistics of 2001 Dodge Neon Breakdown ... 91
Table 34 Summary statistics of 2001 Dodge Intrepid Breakdown ... 92
Table 35 Summary statistics of 2001 Chrysler Caravan Breakdown ... 93
Table 36 Detailed disassembly information for 2001 Dodge Neon front driver and passenger bucket seats ... 94
Table 37 Detailed disassembly information for 2001 Dodge Neon rear bench seat ... 95
Table 38 Detailed disassembly information for 2001 Dodge Intrepid front driver and passenger bucket seats ... 103
Table 39 Detailed disassembly information for 2001 Dodge Intrepid rear bench seat ... 104
Table 40 Detailed disassembly information for 2001 Dodge Caravan front driver and passenger bucket seats ... 108
Table 41 Detailed disassembly information for 2001 Dodge Caravan middle (left & right) bucket seats ... 110
x
LIST OF FIGURES
Figure 1 Framework of ELV management process within Ontario ... 6
Figure 2 Typical vehicle life cycle (purple identifies the end-of-life activities) ... 8
Figure 3 IDEF0 model outlining the automotive dismantling process ... 10
Figure 4 Elevated fluid draining station at Standard Auto Wreckers ... 11
Figure 5 Process flow of shredder operation and material separation ... 15
Figure 6 WDA 2002 schedule of items to be included ... 19
Figure 7 Pie chart of the mass flows of the ELV management process ... 22
Figure 8 Composition of SR ... 23
Figure 9 Simple overview of assembly line at XYZ facility ... 25
Figure 10 Example of a hog ring ... 26
Figure 11 Pie chart of the percentage of materials present in each type of seat for the Neon ... 29
Figure 12 Pie chart of the percentage of materials present in each type of seat for the Intrepid ... 32
Figure 13 Pie chart of the percentage of materials present in the bucket seats for the Caravan .... 35
Figure 14 Pie chart of the percentage of materials present in the bench seat for the Caravan ... 36
Figure 15 Typically connecting bracket ... 42
Figure 16 Connecting bracket utilized in power seats ... 43
Figure 17 Example of new material-foam interface ... 44
Figure 18 Example of the base used to raise the height of the Caravan's front seats ... 44
Figure 19 Chrysler Neon bench seat upper portion; the red identifies metal parts, blue = plastic 46 Figure 20 Elements that effect product complexity ... 51
Figure 21 Example of a structural screw and two basic screws ... 55
Figure 22 Example of ‘other’ connection type ... 56
Figure 23 Example of a fabric connection which utilizes hog rings ... 56
xi
Figure 25 Experimental comparison of disassembly time compared to CEF/H ... 58
Figure 26 Example of a additional time ... 59
Figure 27 Chart of the difference between calculated and actual times for disassembly ... 62
Figure 28 Chart of the difference between calculated and actual times for dismantling ... 62
Figure 29 Guidelines for counting components of seat ... 63
Figure 30 Before and after picture of the 2000 Chrysler Voyager driver’s seat ... 64
Figure 31 Accuracy of the estimated and actual component and connection count ... 66
Figure 32 Potential expenses and revenues from seat dismantling facility... 71
xii
LIST OF EQUATIONS
Equation 1 Equation used to normalize difficulty levels developed by Cooper et. al (1992) ... 50
Equation 2 Compression factor developed by ElMaraghy and Urbanic (2003) ... 51
Equation 3 Diversity factor developed by ElMaraghy and Urbanic (2003) ... 51
Equation 4 Total product complexity developed by ElMaraghy and Urbanic (2003) ... 52
Equation 5 Product complexity index developed by ElMaraghy and Urbanic (2003) ... 52
Equation 6 Complexity factor for the feature and specification developed by ElMaraghy and Urbanic (2003) ... 52
Equation 7 Connection effort factor calculation ... 54
Equation 8 Entropy amount calculation ... 58
Equation 9 Interrelation factor calculation ... 59
Equation 10 Time to disassemble calculation ... 60
Equation 11 Time to dismantle calculation ... 60
xiii
LIST OF ACRONYMS
ELV: End-of-life vehicle
EPR: Extended Producer Responsibility EU: European Union
I/P: Instrument Panel
IC&I: Industrial Commercial and Institutional JIS: Just-in-sequence
JIT: Just-in-time
MOE: Ontario Ministry of the Environment MOST: Maynard Operation Sequence Technique OARA: Ontario Automotive Recyclers Association OTS: Ontario Tire Stewardship
PU: Polyurethane foam
RCO: Recycling Council of Ontario SR: Shredder residue
1
Chapter 1 INTRODUCTION 1.1.General Overview
Vehicle end-of-life management varies based on region because most countries and states do not have any type of governing body in place to regulate how End-of-Life Vehicles (ELVs) are handled and disposed of. This often results in the improper disposal of ELVs and ELV parts that contain chemicals that are harmful to the environment.
The ELV recycling industry, which is a profit driven business in Canada, only removes parts, assemblies, and fluids that are of value or require mandatory removal. The remainder of the ELV is sent through a shredder which breaks up the ELV into a mixture of ferrous metals, non-ferrous metals and non-metallic materials. The non-metallic material contains a mixture of plastics, rubber, glass, textiles and carpeting, ceramics, paper and any other types of non-metal materials that were in the ELV prior to shredding. This mixture is known as shredder residue (SR) and is a by-product, or waste, of the shredding process. Although technologies do exist to separate SR, none have been commercially proven. Therefore this mixture, which represents approximately 15% of ELVs weight, is sent to landfill (Sawyer-Beaulieu & Tam, 2008)(Staudinger & Keoleian, 2001).
2 A major issue that is plaguing Canadian and EU dismantlers alike is the implications of plastic recycling. There are associated labour costs for removing and sorting plastic components, which are compounded with improper plastic resin labeling, incompatibilities with various plastics, and the competitive price for virgin material. These issues are to date unresolved and have proven to have exasperated any efforts in developing an effective automotive plastic recycling industry. As the EU achieves recycling rates closer to the 95% mark, the plastic recycling challenge will begin to play a key role in their success of achieving this target, as plastics compose almost 7% of a vehicles overall weight and 48% of the SR (Staudinger et. al, 2001). The recycling of plastics may require government support for the development and sustaining of businesses. Tax breaks for plastic recycling companies, or imposed taxes on new vehicle owners could be imposed to supplement the associated difficulties and incurred expenses as was done in Ontario to help facilitate the recycling of used tires.
With the attempt to increase the percentage of plastic content in vehicles that is being recycled, vehicle seats were chosen to be thoroughly analyzed as a case study. A systems engineering approach was applied to determine the potential for recycling vehicle seats regardless of the fate of the plastic recycling industry. A thorough understanding was first required of vehicle seat’s material composition, material interfaces, components, component weights and manufacturing operations before such a study could be completed. The tools that were utilized in this analysis include:
− A stakeholder analysis to assess each involved party in the vehicle recycling industry and their associated functions
− Benchmarking of a vehicle seat assembly facility and dismantlers
− An overall process IDEF0 model of the vehicle recycling industry
− Conducting a physical teardown of three vehicle seats circa 2000
3 The physical teardown resulted in an understanding of the material configurations as well as MOST (Maynard Operation Sequence Technique) times that represent both the time to disassemble and dismantle a vehicle seat. In dismantling, dissimilar material types are removed from one another in a sometimes destructive manner, whereas disassembly fully separates all components while also maintaining their structural integrity. The distinction between disassembly and dismantling operations is drawn using examples from the disassembled vehicle seats. The major difference was found to lie with the material connections and interfaces between components. In dismantling, if two materials are to be diverted in the same recycling stream they can remain connected; otherwise, they require separation. The difference found between disassembly and dismantling times can range between 0 to 62% as explained in detail in section 5.3.
The wide range of differences found between the disassembly and dismantling times prompted an investigation to determine a relationship between the product’s complexity and the observed disassembly and dismantling times. After a thorough review of various complexity measures, none were found to be directly applicable to the dismantling operation and none related complexity to process times. As a whole, they were found to require data that was not obtainable for the vehicle seats and seemed too intricate for the given application. Several heuristic complexity models were found to have components that were chosen to be integrated into the developed model, including a difficulty level normalizing calculation (Cooper, et. al, 1992), a compression factor, and a diversity factor (ElMaraghy & Urbanic, 2003).
4 The feasibility of recycling vehicle seats was determined by applying the calculated MOST time for dismantling the vehicle seats to a business scenario equivalent to a vehicle dismantler. Dismantling times were used opposed to disassembly because the structural integrity of the vehicle seat does not have to be maintained to recycle the material components. Business assumptions were made, distinguishing the integral assumption that the vehicle dismantlers will willingly donate vehicle seats as a result of implemented government mandates that impose recycling rates and penalty fees.
Considering the vehicle seat that is the least profitable (i.e. recovers the least amount of ferrous metal per minute) the business model proves to be marginally successful. Changing the model to consider the other disassembled vehicle seats, the profitability of the model drastically increases to excess of $125,000 annually. The model to predict disassembly and dismantling times is used to predict the dismantling times for all vehicle segments that are currently driven on Canadian roads. Using statistics from the vehicles purchased in 2006, the number of vehicles retired is accordingly calculated. With this data, a real-life scenario is determined to be even more successful than previous assessments.
5
1.2.Objectives of Research
The objectives of the research are as follows:
1. Develop an understanding of the contribution vehicle seats make to the amount of SR that is created through the shredding process.
2. Develop an understanding of the similarities and differences in vehicle seat designs to effectively determine the disassembly and dismantling costs and process times.
3. Develop a method to estimate the amount of time it would take a seat to be disassembled or dismantling based on the number of components and connections present in the seat.
4. Determine if it is economically viable to operate a facility dedicated to dismantling vehicle seats.
1.3.Organization of Research
The research in this thesis is organized in the following chapters: 1. Introduction
2. Review of literature involving the activities that occur at the end of a vehicle’s useful life, the role the government plays in this process, and the difficulties faced in recycling plastics
3. Benchmarking of the vehicle seat assembly process 4. Physical teardown of three selected vehicle’s seats
5. Analysis of the findings of the tear down, complexity analysis of the vehicle’s seats design and model to estimate disassembly and dismantling times
6
CHAPTER 2
REVIEW OF LITERATURE
2.1. Scope of Recycling in Ontario
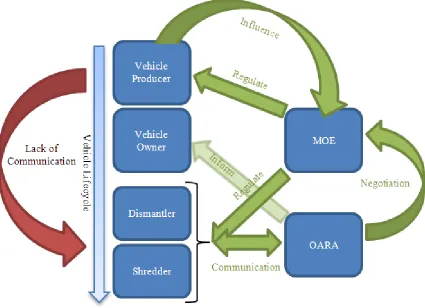
The ELV management systems are investigated within Canada, with the majority of work relevant to Ontario. The automotive recycling industry in Ontario cannot be described without fully defining all the actors involved; their roles and responsibilities; and the interactions between actors.
Figure 1 Framework of ELV management process within Ontario
7 organizations it would be nearly impossible for recyclers to interact with the public as most recycling companies are relatively small private operations.
− MOE (Ministry of Environment of the Province of Ontario) is a government ministry that has many divisions responsible for environmental protection. The main roles of MOE are to act as the guardian of public interest, carry out enforcement and lead/approve environmental protection programs.
− Vehicle producers range from a variety of manufacturers present within Canada. Manufacturers typically design vehicles in the most economically viable way. Presently little time is spent on ELV management planning and coordination with recyclers.
− Vehicle owners can change multiple times throughout a vehicle’s useful life. The owner’s environmental knowledge will determine how the vehicle is to be discarded at the end of its life.
8
2.2. End-of-Life Vehicle Management
There are many different explanations as to why a vehicle reaches its end-of-life and typically this is when a vehicle’s value approaches zero; these reasons can be summarized into the following (Staudinger & Keoleian, 2001):
− Loss of structural or mechanical integrity through corrosion or accident
− Poor reliability of parts and components
− Degraded performance
Figure 2 Typical vehicle life cycle (purple identifies the end-of-life activities)
The decision for an owner to permanently retire their vehicle tends to be a balancing act between the investments of additional resources to return the car to working order and the cost of replacement (i.e. purchasing new vehicle). Once the value required to repair the vehicle exceeds the value of the vehicle, most owners opt to retire. In cases of accidents however this decision then becomes that of the insurance company. Once the owner/insurance company has made this decision, they must decide what channel to
Vehicl Useful Life
Dismantler
Shredder
Metal & Plastic
Material Processing Vehicle
Design & Manufacture
Direct Reuse
Parts that require special disposal are removed
SR sent to landfill Open-loop
9 direct their ELV. Only 94% of ELVs are recycled while the remaining 6% are thought to be abandoned in remote or hard-to-reach places (AAMA, 1997). Other vehicles that do not reach the ELV phase may be stored indefinitely by the owners; stolen and processed for parts; or maintained in working condition indefinitely (i.e. classic/antique cars (Staudinger & Keoleian, 2001).
Figure 2 represents the typical vehicle life cycle. Materials that are recovered from the ELV recycling process can be redirected either back into the vehicle life cycle (closed-loop recycling) or into other industries (open-(closed-loop recycling).
2.2.1. Dismantling
Automotive dismantlers can fall into either of the following categories:
1. High-value parts dismantlers that typically operate on a high volume turnover basis and salvage parts for resale or remanufacturing.
2. Traditional salvage yards or junk yards that typically require customers to recover parts themselves and operate on a slow volume turnover basis.
Automotive dismantling can be described as a process in which automotive parts, materials and assemblies are removed for direct reuse, remanufacturing, recycling, and disposal. The removal of these parts can sometimes be semi-destructive, where the parts of no value are sacrificed for the removal of a valuable part. Dismantling must not be confused with disassembly, which is the reversed process of assembly.
Both types of dismantlers will evaluate an ELV based on their make, model, model year, physical condition, value, demand for specific automotive parts and their current inventories (Sawyer-Beaulieu & Tam, 2008)(Gold, 2010). These ELVs are then categorized into either “late-model” or “early-model” ELVs. “Late-model” vehicles are those newer vehicles retired due to write-offs and typically have maximum parts recovered; whereas, “early-model” vehicles are those older vehicles mainly retired due to old age or write-offs.
10 wide variation in practices from region to region. There are organizations such as OARA that give certifications to recyclers that comply with set standards and practices; however there is nothing in place to stop dismantlers that are not certified from operating.
Figure 3 IDEF0 model outlining the automotive dismantling process adapted from (Sheppard, 1998) and (Gold, 2010)
Figure 3 outlines the automotive dismantling process’s inputs, outputs, controls and mechanisms in the form of an IDEF0 diagram. This process will be described in sequential order, using the figure as a reference.
ELVs come to a dismantler through three primary sources (Sheppard, 1998): 1. Private individuals who sell their vehicle to the dismantler
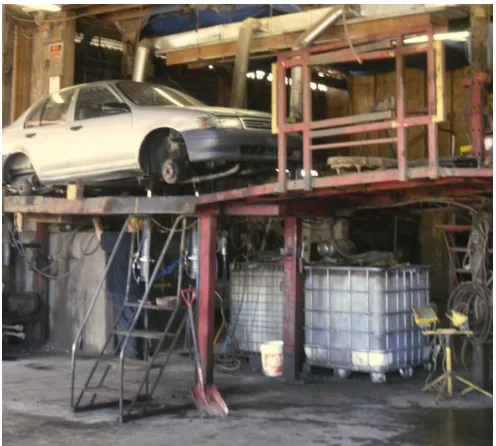
11 Figure 4 Elevated fluid draining station at Standard Auto Wreckers
In Ontario, dismantlers are required to remove components and fluids that are harmful to the environment (RCO, 1999). Automotive shredders also require the removal of certain components and fluids to prevent fires, explosions and damage to their equipment. Fluids are typically removed while elevated so operators can visually see where cuts need to be made to drain the vehicle. Standard Auto Wreckers, which can be classified as a high value parts dismantler, also employ hydraulics that tilt the vehicle to ensure that the maximum amounts of fluids are recovered (Gold, 2010).
The following components and fluids removal are mandatory from all vehicles (RCO, 1999):
− Fluids/refrigerants (Sheppard, 1998)
o Engine coolant, engine oil, transmission oil, differential gear oil, power steering fluid, brake fluid, and windshield washer fluid are recycled
o Air conditioning Freon recovered for reuse or destroyed o Fuel recovered for reuse
− Mercury switches (recycled by authorized recycler)
− Gas tanks (steel tanks are flattened and recycled; plastic tanks are disposed of in landfills)
12
− Batteries ( reused or sent to a lead-acid battery recycler for recycling)
ELVs are then dismantled to remove parts for direct reuse and for remanufacturing. The parts that are removed are based on trends observed in market demand, recent sales and existing parts in inventory. Assemblies that are traditionally removed for remanufacturing as cited by Johnson and Wang (2002) include:
− Air
− Conditioner compressor
− Alternator
− Brake booster
− Starter
− Engine
− Transmission
− Heat box assembly blower motor
− Power steering pump
− Cooling fan shroud assembly
− Windshield wiper motor
− Electronic control unit (ECU)
Remanufacturing does not currently represent a large portion of the ELV management process in Ontario as a result of lower cost of remanufacturing in Asia; as a result, many remanufacturing facilities have shut down in past years (Gold, 2010). Therefore dismantlers in Ontario focus primarily on reuse and recycling of ELVs parts and assemblies.
13 2.2.2. Shredding
Shredding involves the mechanical processing of ELV hulks and other metal-rich scrap materials using a hammer-mill. The metal-rich products that can be sent through a shredder include (Sawyer-Beaulieu & Tam, 2005):
− ELV parts
− End-of-life appliances or white goods (refrigerators, washers, dryers, dishwashers, air conditioners, stoves, furnaces, microwave ovens, hot water heaters, freezers, space heaters, bath tubs, dehumidifiers, range hoods, sinks, etc.)
− Building demolition wastes (light fixtures, roofing, siding, guttering, trims, HVAC components, etc.)
− Oversize sheet steel scrap from manufacturing operations
Water is typically added to the shredder to decrease the frictional heat produced by the process thus preventing: mill fires, generation of oil fumes or mist and increased wear of the mill. The amount of water used throughout the process defines whether it is “dry shredding” or “wet shredding” operation. Wet shredding completely immerses the process in water and can prevent air emissions; while dry shredding uses enough water to keep fires in check, while not requiring the drying of discharged materials.
These materials can then be separated into one of three categories using material separation technologies:
1. Ferrous metals are any type of metal alloy that contains iron (typically steel) and are all magnetic. The ferrous material that is recovered from the shredding process can generally be sent directly to steel mills to be used as alternative feed stock because it contains a minimal amount of impurities (<1%)(Staudinger & Keoleian, 2001).
2. Non-ferrous metals are metals that do not contain any iron and are not magnetic (i.e. aluminum, brass, copper, lead, magnesium, nickel, stainless steel and zinc). Non-ferrous metals typically require additional processing and treatment to be sorted into individual metals.
14 The shredder’s feed material is often of concern for shredder operators. This is why dismantlers are required to remove certain components and fluids as previously discussed. If any type of hazardous material enters the shredder the quality of the ferrous metal, non-ferrous metal and SR can often be compromised; however the most significant concern is the SR. Once SR has been contaminated it becomes a hazardous waste, and must be disposed of accordingly which increases costs of disposal.
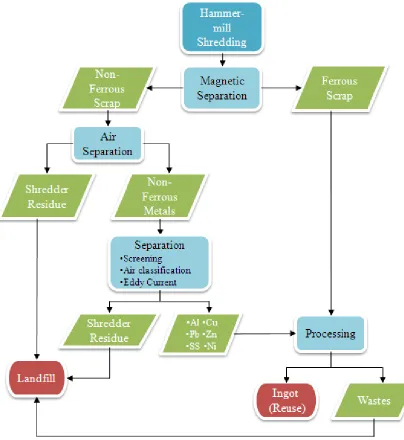
The ferrous metal portion of the shredder output is sent directly to steel mills and is separated using magnetic separation technologies. The ferrous metals and non-metallic materials are processed again typically using an eddy current separator however this process is not as accurate as the separation of ferrous metals; other techniques can also be used such as screening and air classifications. Figure 5 identifies the material separation techniques and flow of materials through the process.
It should be noted that SR is developed at two times throughout the process (Staudinger & Keoleian, 2001):
1. “Light” SR: Generated when the nonferrous materials are separated into metal and non-metal streams using the air classification process. This portion contains a larger portion of lighter materials like plastics and rubber.
2. “Heavy” SR: Generated when the non-ferrous metals are processed to separate into various metal streams. This portion typically contains heavier materials such as glass and metal fines.
2.2.3. Material Separation
15 Figure 5 Process flow of shredder operation and material separation adapted from
(Sawyer-Beaulieu, 2010) and (Staudinger & Keoleian, 2001) 2.3. Government Roles in ELV Management
16 easier reuse and remanufacturing of their products. While some governments opt for full EPR, others tend to lean toward shared responsibility between the manufacturers and government. The EU Directive 2000/53/EC which has been in place since 2000 is described in detail along with the WDA 2002 Review of Ontario which is currently in the process of approval by the MOE.
2.3.1. Directive 2000/53/EC of the EU on End-of-Life Vehicles
This EU Directive on ELVs is the most progressive government movement to prevent waste from vehicles from reaching landfill and promoting the reuse, recycling and other forms of recovery of ELVs and their components. The Directive was put in place by the EU in September 2000 and acts as a guide for Member States to achieve a more sustainable ELV management system. The Directive classifies vehicles as any type of motor vehicle (including their spare/replacement parts) that: (1) Transports less than 8 people (2) A cargo-vehicle’s mass does not exceed 3.5 tons, or (3) Two or three wheeled motor vehicles excluding motor tricycles(European Commission, 2000). The makers (or importers) of these types of vehicles are made financially responsible for the vehicle’s end-of-life management. The last owner of the vehicle is required to continue paying vehicle registration fees until they provide a ‘Certificate of Destruction’ from the dismantler to ensure that vehicles are not abandoned.
The Directive addresses how ELVs should be handled by the dismantler by specifying the minimum technical requirements for treatment. These technical requirements express the environment vehicles should be stored and treated, what components and fluids should be removed (i.e. hazardous materials and fluids), and how to increase recyclability.
17 Recycling targets were strategically set to ensure that all Member States could achieve them and are as follows (European Commission, 2000):
(a) No later than 1 January 2006, for all end-of life vehicles, the reuse and recovery shall be increased to a minimum of 85 % by an average weight per vehicle and year. Within the same time limit the reuse and recycling shall be increased to a minimum of 80 % by an average weight per vehicle and year; for vehicles produced before 1 January 1980, Member States may lay down lower targets, but not lower than 75 % for reuse and recovery and not lower than 70 % for reuse and recycling.
(b) No later than 1 January 2015, for all end-of life vehicles, the reuse and recovery shall be increased to a minimum of 95 % by an average weight per vehicle and year. Within the same time limit, the re-use and recycling shall be increased to a minimum of 85 % by an average weight per vehicle and year.
Most Member States and producers have experienced significant difficulties in implementing this Directive and the Commission has taken legal action against most of the EU-151
2.3.2. Waste Diversion Act 2002 (Canada)
. The Directive does require additional procedures than were not previously performed which results in extra costs in dismantling. It is believed by the EU that these obstacles can be overcome with sufficient time, effort and resources.
The Waste Diversion Act (WDA), 2002 is Ontario’s main legislation to promote the reduction, reuse and recycling of waste through the development, implementation and operation of waste diversion programs (Ministry of the Environment of the Province of Ontario, Canada, 2008). In October 2008 the Ministry MOE began a public dialogue on how to achieve greater waste diversion and to explore EPR as the foundation for Ontario’s waste diversion while working towards a zero waste society (Ministry of the Environment of the Province of Ontario, Canada, 2009).
18 Waste diversion can be defined as any act that prevents waste from reaching landfill. WDA more specifically defines waste diversion as (Ministry of the Environment of the Province of Ontario, Canada, 2009):
− Diversion will continue to be reduce, reuse and recycle
− The material value recovered and preserved from all processes and technologies will be counted as diversion
− Burning waste without recovering material for reuse will not be counted as diversion
The WDA focuses on EPR as the main driver of their legislation, with the idea that putting producers in charge of their products’ end of life management will force design changes to reduce recycling costs. Ontario was considering implementing a shared responsibility EPR program at the early stages of the WDA however full EPR was decided upon in order to shift the cost from municipal taxpayers and businesses to the producer. Other benefits of full EPR include increased creativity, competition among producers, and more efficient waste collection.
The current recycling rate within residential areas is 39% whereas the IC&I (Industrial Commercial and Institutional) sector is only 12%. The WDA therefore plans to strengthen diversion rates within the IC&I sectors through the use of economic incentives and waste audits. IC&I facilities include a wide variety of establishments including small family businesses, factories, schools and malls. A problem in Ontario is that it is often cheaper to send waste to landfill than diversion. The WDA proposes a disposal levy be implemented to make it more economical for businesses to recycle; the disposal levy revenues would then be used to promote waste diversion. Larger sized IC&I facilities will also be required to prepare waste audits and develop waste reduction plans. The success of the WDA will be attained through setting achievable goals for the province and the plans has not yet been finalized as the government is currently seeking stakeholder’s opinions of the set targets.
19 target in terms of percentage of recycling however it is implied that the whole vehicle must be diverted from landfill (i.e. 100%). For the components present in a vehicle that cannot be recycled or remanufactured, it is assumed that there will be an approved disposal process.
Figure 6 WDA 2002 schedule of items to be included (Short term=2 years; medium term= 3 to 4 years; long term= 5 years)
Overall, the goal of the WDA is to help shift society’s thinking that waste does not have any value; materials such as wood, glass and metals do have value, especially considering the amount of energy saved eliminating raw material extraction. Through these changes Ontario could eventually become a zero (or almost zero) waste society by making the waste of one product the output of another.
2.4. Plastic Recycling
Plastic contributes the highest percentage of SR, at 48%, and represents 6.72% of the vehicle’s total weight (Staudinger & Keoleian, 2001); therefore the focus will consequently be on how to reduce the plastic content in vehicles. Currently, there are many reasons as to why an automotive plastic recycling industry has not been successful, including (Duval & MacLean, 2007):
− Lack of government recycling policies
− Negligible landfill tipping fees in many regions (i.e. it is cheaper to dispose of SR in landfill sites than to recycle)
− Competitively priced virgin resin (low petroleum prices)
− Inadequate labeling and sorting technologies Short Term
IC&I Packaging and Paper
Waste Electronic and Electrical Equipment (Phase 3).
Construction/Demolition Material
Medium Term
Bulky Items (i.e. furniture and
mattresses)
Long Term
Vehicles
Branded Organics
20
− Concerns with plastic efficacy and appearance
Many plastics are also incompatible which requires them to be separated however once the plastics have gone through shredding operations. The only types of separation that can currently be done are either manual or fluid based. Manually sorting plastics is not possible in Canada due to the high labour costs; however, is still done is some developing countries. Fluid based separation is done using a fluid to separate two polymers based on their density (Coulter et. al, 1996) but if two polymers have the same density, their separation is not possible.
Effective separation must therefore be done at the dismantlers, but even they are often unable to identify and differentiate between the large quantities of different plastic types in a vehicle. ISO 1043 (and related SAE J1344) are standards that govern marking of parts and can greatly facilitate identification and sorting. ISO 1043 standards only states that parts heavier than 100 grams (0.22 lb.) be marked and that letters should be at least 3 mm high. Manual sorting requires visual identification which, with these labeling standards, is ineffective.
Additionally, for automotive recyclers to begin recycling plastics, they must have a market to sell recycled plastic to. Once the business is proven to be profitable better separation techniques will be developed. In order for this to occur there needs to be a change in the automotive life cycle (as identified in Figure 2) and this could occur at any stage of the life cycle. For instance, at the dismantling stage, plastic components could be removed and sold to businesses that use these components to manufacture their products. If better plastic recycling does not develop or is not possible, government funding could help prompt businesses to develop that create ‘green’ alternative consumer products. The development of these businesses could be funded through government support programs like the Used Tire Program.
21 per tire (Gold, 2010); however, this value could change at any time. These tires are then directed to businesses that reuse or recycle the tires into new materials that have the following applications (OTS, 2010):
1. Crumb Rubber is recycled from scrap tires’ rubber (steel and fluff is removed) and is processed into a granular consistency much like small gravel. The particles are then classified based on their colour and size. The majority of scrap tires are recycled into crumb rubber that can be used in many applications including:
− Playgrounds as a sand substitute
− Landscaping as a mulch substitute
− Raw materials for molded products such as engine components, subflooring, and mouse pads
− Added to asphalt road mixture to make roads quieter, shed water better and last longer
2. TDA (Tire Derived Aggregate) is an engineering product that requires tires to be cut into pieces that vary in size from 25 mm to 300 mm. TDA is typically used in civil engineering applications such as: sub grade fill and embankments, backfill for walls and bridge abutments, sub grade insulation for roads, landfill projects, and septic system drain fields, and can be a feed stock for crumb rubber producers.
3. Fabricated Products that simply reuse cut tires as a new product. For example, some tire cones are created from the sidewalls of tires, and the tread area of tires can be used to build blasting mats.
Other options such as reuse and remanufacturing of plastic subassemblies could be plagued by obsolescence and high costs of disassembly. There also tends to be less of a demand for subassemblies that are not mechanical and have low failure rates; which is the case for the majority of plastic subassemblies, but these possibilities will also be investigated. A list of subassemblies that contain a high portion of plastic include (Coulter et. al, 1996) (Reuter et. al, 2004):
− Exterior components including bumpers, grill, lights
22
− Windows (both manual and automatic) assemblies
− I/Ps including electronics
− Seats
2.5. Research Motivation
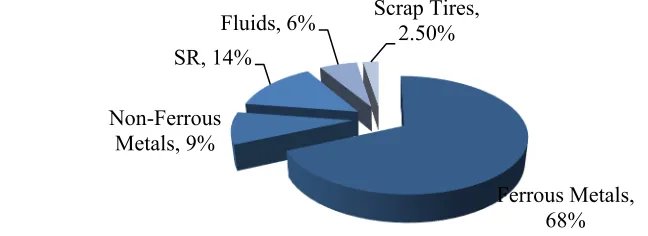
Over time the ferrous metal within vehicles has been decreasing while the non-ferrous and plastic content has been increasing. This has lead to vehicles that require more complicated recycling processes that are also more labour and energy intensive. Over the past 20 years, the amount of ferrous metals has decreased about 10%, from 85% to 75% of the total vehicle weight (Coulter et. al, 1996). The majority of the recycling profits are derived from the metal-rich content in vehicles and their high recyclability rates; ferrous and nonferrous metals shredding operations can recover approximately 95% of the materials (Sawyer-Beaulieu & Tam, 2008). With these trends in material content increasing, vehicle recycling rates will continually decrease, as will the profits of automotive recyclers, until something is done to effectively address the increasing nonmetal content in vehicles.
Figure 7 Pie chart of the mass flows of the ELV management process adapted from Staudinger et. al [2001]
The mass flows of the ELV management process are shown in Figure 7. The only component of this pie chart that does not currently have a system in place to correctly manage it is SR. SR contains a combination of plastics, foam, rubber, glass, textiles and carpeting, ceramics, paper and any other types of non-metal materials that are present in the vehicle when shredding takes place. Although some technologies exist to handle SR, none have been proven commercially successful in Canada (Sawyer-Beaulieu & Tam, 2008) and as a result, SR is currently sent directly to landfill. The increasing trend of
Ferrous Metals, 68% Non-Ferrous
Metals, 9% SR, 14%
23 movement towards government regulated recycling targets has created a need for research to find ways to address SR. The goal of this research is to present opportunities to address ASR pre-shredding by removing those major contributors of SR at the dismantling stages.
Figure 8 Composition of SR adapted from Staudinger et. al [2001]
It was decided to investigate vehicle seats’ contributions to SR and the possibility of developing a recycling process to divert the nonmetals within the seats from landfill. Vehicle seats were chosen due to the assumption that they are a significant contributor to SR. In the past, the recycling of assemblies with high plastic content has been plagued by high disassembly costs and lack of market demand for materials. It is still however necessary to determine how much vehicle seats contribute to SR and how much it could potentially cost dismantlers in the event that recycling targets are put in place. The development of markets for used PU foam and seat fabric could also become a reality through government support programs and the growing demand for green products.
Plastics, 48%
Rubber, 13% Glass, 19% Other
24
CHAPTER 3
INDUSTRIAL BENCHMARKING
In order for the disassembly and dismantling processes to be fully understood, the process of assembly should be examined to analyze the product’s geometry, components, assemblies, and assembly techniques. The facility chosen for the study was a facility in Orangeville, Ontario and will be referred to as XYZ for anonymity. Company XYZ is a multi-industry company that focuses mostly on manufacturing parts for the automotive interiors, car seats, batteries, and climate control systems while also offering facility management services. The facility is a dedicated Tier-1 Chrysler supplier that supplies the automotive assembly plant in Brampton, Ontario with seats for their Chrysler 300, Dodge Charger, and Dodge Challenger and headliners. The assembly plant is set up in a way to supply Chrysler with products utilizing both the JIT in-Time) and JIS (Just-in-Sequence) manufacturing paradigms. This enables Chrysler to sequence their assembly lines to install vehicle seats and headliners as they come off the truck from the facility.
Quality at the facility is mainly measured by appearance and these defects are ideally identified before the assembly process. Reworks are done on-site to both seat covers and foam using trade secret methods that could not be disclosed. The reworks that are required on final assemblies are also carried out on-site; however, the difference must be distinguished between appearance and structural defects. Anything that relates to the structural components of the seat, or safety buckles that could result in product failure requires a complete tear down in order to be reworked. Seats are also subject to damages at the Chrysler assembly facility and as a result, Chrysler regularly sends back damaged seats. These products are treated in the same manner as any internal quality defect and reworked accordingly.
25 that is available within the vehicle for the seats and XYZ designs accordingly. XYZ and Chrysler will go back and forth and produce multiple iterations of the design before committing to the final version. Currently the designs for the three vehicles seats that are assembled at the facility are very modular in design and feature many similar components with the major differences being in detailing and final finishings.
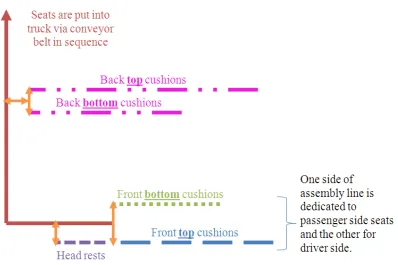
The assembly process at the XYZ facility, because of the JIT and JIS commitments to Chrysler, is initiated by the output of a WIP (work-in-process) ticket printed off at printers within the facility. These printers are connected to the Chrysler facility and send requests as production begins on the final vehicle at their facility. The requests are sent to the beginning of the bucket seat line and to the beginning of the bench seat line; these requests are sent to the printers with enough of a gap in time that the seats will meet at the end, to be loaded together into the truck. The assembly lines are all connected utilizing a conveyor system that loads the trucks for delivery. Figure 9 represents the overall picture of the assembly lines at the XYZ facility and how the final seats are assembled and loaded into the truck to be sent to Chrysler.
Figure 9 Simple overview of assembly line at XYZ facility
26 The first step in the process is assembling the foam, wire components (for heated seats), metal frame, and affixing the seat fabric (leather or cloth).
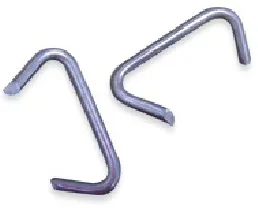
For the bottom portion of the seats, the affixing is done utilizing hog rings (similar to staples) as shown in Figure 10. An operator, through the use of a pneumatic hog ring gun fastens the material to the foam using approximately 3-4 rings on each side of the seat. Unlike the bottom portion of the seat, the upper portion is required to be fully covered and therefore requires a different assembly operation. An operation called “skinning” is used which utilizes both a machine to stretch the material over the foam and an operator with a pneumatic hog ring gun to fix the material around the seams of the seat. The seats that go through the “skinning” process require to be sent through heating ovens to relax the material after being stretched over the foam.
Figure 10 Example of a hog ring
Before the bucket seats upper and lower portions are affixed, they have a variety of small plastic components and accessories added to them, including the reclining levers, head rest adjusters, bolts covers, etc. When the bucket seat portions are attached it is done using pneumatic screw guns. Machines are used to test the torques and angles used for the connection and recorded using bar codes; in parallel, the head rests are assembled. Using a plastic bag, the foam head cushion is shrunk and the material cover is easily put on by an operator. Once finished the plastic bag (which is very thin) remains as an interface thus preventing the foam and material from squeaking. The head rests are then installed on the bucket seats and pass through inspection. The final step is the ironing of the material using robots which is done in a caged off area in the facility.
27 the bench seat. Whereas the lower portion of the seat only requires an operator, with a pneumatic hog ring gun, to affix the visible portion of the material to the foam and clip the material in place at the bottom, non-visible, side of the seat.
28
CHAPTER 4
DESIGN METHODOLOGY
Prior to determining if recycling vehicle seats prior to the shredding process is economically viable, the variety of seats that would be encountered in such an operation must be understood. In order to accomplish this, three different vehicle segment types were chosen from the same manufacturer. The hypothesis behind this decision was that if similarities were shown between different vehicles from the same model year and manufacturer then there may also be similar designs utilized across vehicle manufacturers and a standardized process could be developed. A small and large passenger vehicle and minivan were chosen for the study to get an understanding of the difference in seat design between vehicle segments.
The vehicles chosen for the study include: 1. 2001 Dodge Neon
2. 2001 Dodge Intrepid 3. 2001 Dodge Caravan
The seats from these vehicles were donated by a local dismantler and were already removed from the vehicle prior to this research. The study therefore does not incorporate the removal of the seats from the vehicle or any of the bolts or assemblies used to attach the seat to the vehicle frame. In order to understand the structural make-up of the vehicle a thorough disassembly was performed and all operations, part types, weights and material compositions were recorded. The physical make-up of the vehicle is stated below:
4.1. 2001 Dodge Neon
The 2001 Dodge Neon is a compact front wheel drive vehicle which comes both in a 2 and 4 door model. This Neon represents the second generation of the vehicle which was produced from 2000 until 2005.
− MSRP: $14,555
29
− MPG City/Highway: 27/33 (8.71-7.13 L/100km)
− Curb Weight: 2627.9 lbs (1,192 kg)
− Vehicle Length: 174.4 inches (4.43 m)
− Vehicle Width: 67.4 inches (1.71 m)
The seats in the Neon were typical seats that you would find in any vehicle. Two bucket styled seats in the front that have the ability to recline and slide laterally with respect to the dashboard. The seats in the back are bench style and are built right into the frame of the vehicle. These seats have the ability to fold down to provide access to the trunk of the vehicle. The seats fold down in two portions; therefore there are three separate components that make up the upper portion of the back seat: (1) The frame, (2) The right portion, and (3) The left portion. The results of the study are summarized in Figure 11, Table 1 and Table 2.
Figure 11 Pie chart of the percentage of materials present in each type of seat for the Neon The components of the bucket style front seats:
− Two connecting joints that connect that top portion of the seat to the bottom on either side (attached seat belt)
− Upper portion of seat o Metal frame
o PU foam (not molded on frame) o Material fabric
o Head rest (made up of fabric, PU foam molded onto metal frame)
− Lower portion of seat
Metals 73% Fabric
9% Foam
16% Plastic2%
Bucket Seat
Metals 23%
Fabric 17% Foam
24% Plastic
36%
30 o One side panel for aesthetics
o One lever to enable the seat to recline
o One seat belt buckle attached to the seat connecting joint
o Tracking system that enables seat to and slide laterally with respect to the dashboard
o Metal frame
o PU foam (not molded on frame) o Material fabric
The components of the bench rear seats:
− Top portion of bench seat o Frame
Right and left mounting bracket that allows the seat to be folded down Bolts connecting frame to right and left portions of seat
Cushioning on frame Plastic frame structure
Material fabric covering frame o Right portion of seat
Material fabric
PU foam (not molded on frame) Plastic frame
Bracket that connects seat to frame Head rest connecting bracket
Head rest (made up of fabric, PU foam molded onto metal frame) o Left portion of seat
All components that are included in right portion of seat Bracket that pulls chair down with cloth pulley
− Lower portion of bench seat
31 Table 1 Material composition of 2001 Dodge Neon
Part Information Weights of Parts & Materials (g) Part
Type Assembly Overall Metals Fabric Foam Plastic Other
2001 D od ge Ne on Driver Seat
Driver seat upper 5,911 4,111 800 1,000 0 0 -Head rest 700 367 96 200 37 0 Driver seat lower 9,509 7,197 600 1,400 312 0
Total 16,120 11,675 1,496 2,600 349 0
Pass. Seat
Driver seat upper 5,616 4,016 600 1,000 0 0 -Head rest 700 367 96 200 37 0 Driver seat lower 9,004 6,793 500 1,400 311 0
Total 15,320 11,176 1,196 2,600 348 0
Back Seat (bench)
Bench upper 4,853 801 1,000 52 3,000 0 Bench upper left 2,654 644 410 400 1,200 0 -Head Rest 893 560 96 200 37 0 Bench upper right 3,736 326 610 800 2,000 0 -Head Rest 893 560 96 200 37 0 Bench seat lower 4,417 1,017 800 2,600 0 0 Total 17,446 3,908 3,012 4,252 6,274 0 GRAND TOTAL 48,886 26,759 5,704 9,452 6,971 0 Table 2 Material composition percentages of 2001 Dodge Neon
Part Information Percent Weight of Part Percent Weight of Complete Vehicle, With Fluids
Type Part Assembly Metals Metals Non- Part Metals Metals
Non-20 01 D od ge N eon Driver Seat
Driver seat upper 69.55% 30.45%
1.35% 0.98% 0.37%
-Head rest 52.43% 47.57% Driver seat lower 75.69% 24.31%
Total 72.43% 27.57%
Pass. Seat
Driver seat upper 71.51% 28.49%
1.29% 0.94% 0.35%
-Head rest 52.43% 47.57% Driver seat lower 75.44% 24.56%
Total 72.95% 27.05%
Back Seat (bench)
Bench seat upper 16.51% 83.49%
1.46% 0.33% 1.14%
Bench seat upper left 24.27% 75.73% -Head Rest 62.71% 37.29% Bench seat upper right 8.73% 91.27% -Head Rest 62.71% 37.29% Bench seat lower 23.02% 76.98%
Total 22.40% 77.59%
32
4.2. 2001 Dodge Intrepid
The 2001 Dodge Intrepid is a large, four door, full size, front wheel drive sedan that was produced from 1993-2004. This Intrepid represents the second generation of the vehicle was produced from 1998 until 2004.
− MSRP: $22,605
− Engine size: 2.7L 201hp V6
− MPG City/Highway: 20-28 (11.76-8.4 L/100km)
− Curb Weight: 3492.1 lbs (1,574 kg)
− Vehicle Length: 203.7 inches (5.17 m)
− Vehicle Width: 74.7 inches (1.90 m)
The seats in the Intrepid are simpler in comparison to those in the Neon. For the front seats, the combination of using a metal stamping for the base, few material interfaces and simplicity in design has enabled the Intrepid to be disassembled in the least amount of time. The back bench seats are also much simpler in comparison to the Neon. The back seat does provide access to the trunk of the vehicle however it folds down in one piece as opposed to the Neon that folds down in two pieces. The design of the bench seats are also very basic, they are both composed of a metal frame, PU foam and material. Unlike the other vehicles seats that were disassembled, the Intrepid did not have the foam molded onto the frame for the bench seats. This enabled for much easier disassembly and prevented the operator from having to peel the foam off the frame piece by piece; thus drastically reducing the disassembly time. The results of the study are displayed in Figure 12, Table 3 and Table 4.
Figure 12 Pie chart of the percentage of materials present in each type of seat for the Intrepid Metals
71% Fabric
7% Foam
19%
Plastic 3%
Bucket Seat
Metals 25%
Fabric 13% Foam
53% Plastic
0% Other
9%
33 The components of the bucket style front seats:
− Hinge screw that attaches the tracking system to the upper frame of seat (no connecting bracket was utilized in this seat which was different from the two other vehicles). The seat belt is also attached at this point.
− Upper portion of seat o Metal frame
o PU foam (not molded on frame) o Material fabric
o Head rest (made up of fabric, PU foam molded onto metal frame)
− Lower portion of seat
o One side panel for aesthetics
o One lever to enable the seat to recline
o One seat belt buckle attached to the seat connecting bolt
o Tracking system that enables seat to slide laterally with respect to the dashboard
o Metal stamping used for support o PU foam (not molded on frame) o Material fabric
The components of the bench rear seats:
− Top portion of bench seat
o Material covered plywood-like material o Material fabric
o Foam (not molded on frame) o Metal frame
− Lower portion of bench seat
o Material fabric connected to frame with hog rings o Foam (not molded on frame)
34 Table 3 Material Composition of 2001 Dodge Intrepid
Part Information Weights of Parts & Materials (g)
Type Part Assembly Overall Metals Fabric Foam Plastic Other
2001 D odg e Intr epi d Driver Seat
Driver seat upper 4,717 2,717 600 1,400 0 0 -Head rest 683 437 89 157 0 0 Driver seat lower 9,857 7,631 400 1,400 426 0 Total 15,257 10,785 1,089 2,957 426 0
Pass. Seat
Driver seat upper 4,701 2,701 600 1,400 0 0 -Head rest 681 437 90 154 0 0 Driver seat lower 9,652 7,628 400 1,200 424 0 Total 15,034 10,766 1,090 2,754 424 0 Back
Seat (bench)
Bench seat upper 10,200 2,800 1,200 4,800 0 1,400 Bench seat lower 6,000 1,200 1,000 3,800 0 0
Total 16,200 4,000 2,200 8,600 0 1,400 GRAND TOTAL 46,491 25,551 4,379 14,311 850 1,400
Table 4 Material Composition Percentages of 2001 Dodge Intrepid
Part Information Percent Weight of Part Percent Weight of Complete Vehicle, With Fluids
Type Part Assembly Metals Metals Non- Part Metals Metals
Non-2001 D od ge In tr ep id Driver Seat
Driver seat upper 57.60% 42.40%
0.97% 0.42% 0.17%
-Head rest 63.98% 36.02% Driver seat lower 77.42% 22.58%
Total 70.69% 29.31%
Pass. Seat
Driver seat upper 57.46% 42.54%
0.95% 0.42% 0.17%
-Head rest 64.17% 35.83% Driver seat lower 79.03% 20.97%
Total 71.61% 28.39%
Back Seat (bench)
Bench seat upper 27.45% 58.82%
1.03% 0.16% 0.42%
Bench seat lower 20.00% 80.00%
Total 24.69% 75.31%
35
4.3. 2001 Dodge Caravan
The 2001 Dodge Caravan is a family minivan that has been produced from 1984-present and has 5 generations. This Caravan represents the fourth generation of the vehicle was produced from 2001 until 2007.
− MSRP: $19,160
− Engine size: 2.4L 150hp I4
− MPG City/Highway: 20-25 (11.76-9.41 L/100km)
− Curb Weight: 3919.8 lbs (1,773 kg)
− Vehicle Length: 189.1 inches (4.80 m)
− Vehicle Width: 78.6 inches (2.00 m)
The Dodge Caravan features three rows of seating consisting of: driver and passenger bucket seats, 2 middle bucket seats and third row bench seating. The last two rows of seating offer the ability to be removed to enable sizable cargo to be transported in the vehicle. This option, which is also a selling factor for the vehicle, creates difficulty in the design of the seats. This added feature has added complexity to the vehicle seats’ design and consequently additional weight and increased disassembly times. The results of the study are displayed in Figure 13, Figure 14, Table 5 and Table 6.
Figure 13 Pie chart of the percentage of materials present in the bucket seats for the Caravan Metals
75% Fabric
9% Foam
10% Plastic
6%
Front Bucket Seat
Metals 73% Fabric
4% Foam
11%
Plastic 12% Other
0%
36 Figure 14 Pie chart of the percentage of materials present in the bench seat for the Caravan The components of the front bucket seats are:
− Two connecting joints that connect that top portion of the seat to the bottom on either side (attached seat belt)
− Upper portion of seat o Arm rest
o Grip bar (on back for passengers sitting behind) o Head rest
o PU foam & material fabric (attached) o Metal frame
− Lower portion of seat o Two Side panels
o Panels on the back at seat base o Reclining lever
o Bar to adjust lateral distance with respect to the dashboard connected to tracking system
o PU foam & material fabric (attached) o Metal stamping used for support o Base (to elevate the seat)
The components of the middle bucket seats are:
− Two connecting joints that connect that top portion of the seat to the bottom on either side, with attached seat belt
− Upper portion of seat
Metals 68% Fabric
8% Foam
16% Plastic
2% Other6%
37 o Two arm rests
o Plastic backing to the seat to be used if seat is folded down o Head rest
o PU foam & material fabric (attached)
o Metal frame with incorporated wire meshing used for support
− Lower portion of seat o Two Side panels o Cup holder o Reclining lever
o PU foam & material fabric (attached)
o Metal frame with incorporated wire meshing used for support
o Base that enables the seat to be easily removed with an incorporated lever The components of the back bench seats are:
− Two connecting joints that connect that top portion of the seat to the bottom on either side
− Upper portion of seat o Two head rest
o Plywood-like material on back of seat o PU foam & material fabric (attached) o Metal frame
− Lower portion of seat o Two side panels
o Panels on the back at seat base o Reclining lever
o PU foam & material fabric (attached) o Metal stamping used for support
38 Table 5 Material Composition of 2001 Dodge Caravan
Part Information Weights of Parts & Materials (g) Part
Type Assembly Overall Metals Fabric Foam Plastic Other
20 01 C hr ys le r Ca rava n Front Seat (x 2)
Driver seat upper 7,101 4,437 600 1,319 745 0 -Head rest 716 460 90 166 0 0 Driver seat lower 12,990 10,609 1,200 600 581 0 Total 20,807 15,506 1,890 2,085 1,326 0 Middle
Seat (x 2)
Driver seat upper 11,398 7,866 600 1,238 1,694 0 -Head rest 716 460 90 166 0 0 Driver seat lower 11,760 9,068 400 1,200 1,092 0 Total 23,874 17,394 1,090 2,604 2,786 0 Back
Seat (bench)
Bench seat upper 24,470 13,920 2,500 5,000 50 3,000 -Head Rests (x2) 1,432 920 180 332 0 0 Bench seat lower 22,983 18,473 1,000 2,400 1,110 0
Total 48,885 33,313 3,680 7,732 1,160 3,000 GRAND TOTAL 138,247 99,113 9,640 17,110 9,384 3,000 Table 6 Material Composition Percentages of 2001 Dodge Caravan
Part Information Percent Weight of Part Percent Weight of Complete Vehicle, With Fluids Part
Type Assembly Metals Metals Non- Part Metals Metals
Non-20 01 C hr ys le r Ca rava n Front Seat (x 2)
Driver seat upper 62.48% 37.52%
1.17% 0.87% 0.30%
-Head rest 64.25% 35.75% Driver seat lower 81.67% 18.33%
Total 74.52% 25.48%
Middle Seat (x 2)
Driver seat upper 69.01% 30.99%
1.35% 0.98% 0.37%
-Head rest 64.25% 35.75% Driver seat lower 77.11% 22.89%
Total 72.86% 27.14%
Back Seat (bench)
Bench seat upper 56.89% 43.11%
2.76% 1.88% 0.71%
-Head Rests (x2) 64.25% 35.75% Bench seat lower 80.38% 19.62%
Total 68.15% 31.85%
GRAND TOTAL 71.69% 28.31% 7.8% 5.58% 2.76%
39 given load. The material that is used for this application was a plywood-composite that is typically used in lower-end home furnishing.


![Figure 8 Composition of SR adapted from Staudinger et. al [2001]](https://thumb-us.123doks.com/thumbv2/123dok_us/1441601.1176590/37.612.167.464.166.254/figure-composition-sr-adapted-staudinger-et-al.webp)