20th International Conference on Structural Mechanics in Reactor Technology (SMiRT 20) Espoo, Finland, August 9-14, 2009 SMiRT 20-Division 5, Paper 2008
Experimental Compression Behavior of Stiffened Steel Plate Concrete (SSC)
Structures under Compression Loading
Byong Jeong Choia, Keunkyeong Kimb, Chong-Hak Kimc, and Tae Young Kimd
a
Architectural Engineering, Associate Professor, Kyonggi University, Seoul, Korea, e-mail:[email protected]
b
Korea Hydro and Nuclear Power Company, Youngdongdaero 411, Kangnam-Gu, Seoul, Korea
c
Korea Hydro and Nuclear Power Co., Daejeon, Korea
d
Korea Power Engineering Co., Ltd, Yongin, Kyonggido, Korea
Keywords: Steel Plate Concrete Structure, B/t ratio, Effective Length Factor, Euler Buckling Load
1
ABSTRACT (NO MORE THAN 200 WORDS)
The primary objective of this paper is to understand the compression buckling behavior of the stiffened steel plate concrete (SSC) structures. The buckling strain was evaluated and the compatibility between steel plate and concrete was observed. The compressive strength estimation for the new SSC structures was suggested based on the compression test results. The effective length factor for the SSC structures supported by top and bottom studs was suggested. The buckling behaviour was well agreed with the one of FEM analysis.
2
INTRODUCTION
The importance of the research on the steel-plated concrete (SC) structure is now ever increasing in nuclear structures. The experiments on concrete filled tube (CFT) columns which are similar to SC structures have conducted widely in Korea. However, the experiments on SC structures were not conducted. While, the compression tests for SC structures have conducted in Japan (Kanchi et al, & Miyauchi et al, 1996). These experiments include the maximum compressive strength of SC wall, shrinkage strain, buckling stress with variation of B/t ratio and tensile behavior of stud bolt. The following expression for compressive strength of the SC structures (JEAG4618, 2005) was suggested by Kanchi et al based on experiments.
c ck sf y si cr
n F A F A f A
P = + + (1)
In this expression, the buckling strength of steel plate was applied to strength of steel plate when plate buckling occurred. The maximum compressive strength of concrete was used to compressive strength of concrete. Therefore, the material deficiencies of concrete and construction errors were not considered in eqn (1). It is judge that eqn (1) should be modified to apply the practical structures.
3
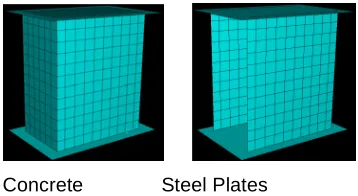
FEM ANALYSIS MODEL
Concrete Steel Plates
Figure 1 Finite element method modelling
Figure 2. FEM restraint and loading condition
4
EXPERIMENTAL PLAN4.1 Specimen Schemes
In this experiment, to evaluate the compressive strength of stiffened SC structures, H-shaped rib(4-H-60X60x4.5x4.5) was welded the both side face and stud bolt was arranged with variation of ratio of stud space(stud space/thickness of plate, B/t). The rib and stud bolt were welded on steel plate and then concrete was placed. The compressive strength of concrete was 42N/mm2. For the steel plate, two types of steel were sued: SM 490 and SS 400. The thickness of steel plate was 6mm and B/t was 50, 33 and 25 according to the buckling range. It was planned that B/t=50 specimen buckles in elastic range and B/t=25 specimen buckles in plastic range. Based on these parameters, the effects of stud bolt space and thickness of plate could be analyzed. The diameter of stud bold was 8 mm and the length of that was 71 mm. The specimen shape of B/t=33 was shown in Figure 3 and each specimens were listed in Table 1.
60
0
68
0
10
0
<Long itud ina l Sect ion>
70
50 50 200
580
60 50 60 50
20
0
20
0
50 50
400 50100 10050
70
20
0
20
0
60
0
68
0
10
0
<T ransve rse Sect ion>
Figure 3. Specimen shape for B/t=33
! " ! "#$%&'(#)*+,#-.(++/ !/0(+ ! " # $ ! "#$%&'#(%')#* +,-./ $0''1 !120' !"#$%&'"()*+",
! " #
$ % & -.'**/ -/0'* !"#$%&"'$&(") *+,-. !"# $"% &"' (") / #0&&1 /120&
Figure 5. Location of LVDT and strain gauges
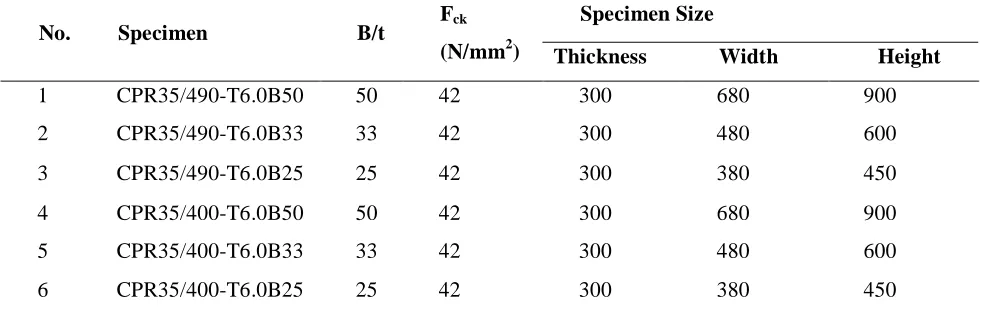
Table 1. Specimen Schedule
Specimen Size
No. Specimen B/t Fck
(N/mm2) Thickness Width Height
1 CPR35/490-T6.0B50 50 42 300 680 900
2 CPR35/490-T6.0B33 33 42 300 480 600
3 CPR35/490-T6.0B25 25 42 300 380 450
4 CPR35/400-T6.0B50 50 42 300 680 900
5 CPR35/400-T6.0B33 33 42 300 480 600
6 CPR35/400-T6.0B25 25 42 300 380 450
For loading of specimens, monotonic loading was applied with a U.T.M. of 10,000 kN capacity as shown in Figure 4. The LVDT and strain gauge were attached the each specimens to monitoring the axial displacement and strain of steel plate as shown in Figure 5.
4.2 Material Properties
The properties of steel plate were listed in Table 2 and compressive strength of concrete was listed in Table 3. The results of tensile test of the steel plate showed that the yield stress of SS 400 and SM 490 exceeded the expected yield stress about 39N/mm2 18N/mm2,respectively. The results of compressive test of the concrete showed that the compressive strength of specimens exceeded the expected compressive strength about 7N/mm2.
Table 2. Steel Coupon Test
Type of Steel
Thickness (mm)
Yield Strength (MPa) Tensile Strength (MPa) Elastic Modulus (MPa) Yield Ratio (%) Elongation (%)
SSS400 66.0 274 432 2.0x10⁵ 63 37.6
SM490 66.0 418 572 2.0x10⁵ 79 31.4
Table 3. Concrete Mixing Plan
Gravel Amount Obtained Compressive Strength(MPa) W/C (%) Slump
(mm) W C S G
5
RESULTS AND DISCUSSION
5.1 Material Properties
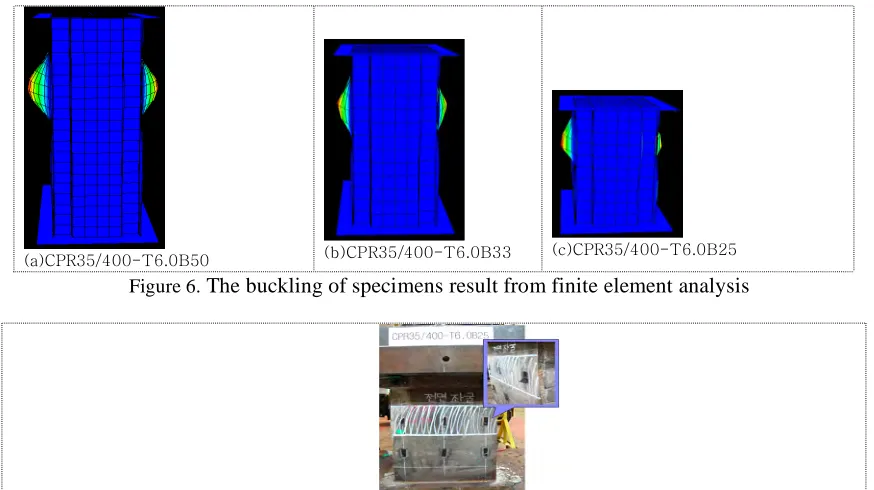
The buckling behaviors of specimens stiffened by the rib were shown in Figure 6 with variation of B/t as results of finite analysis. Figure 6 showed the buckling behavior of CPR35/400 series specimens made of SS 400 steel.
Figure 6. The buckling of specimens result from finite element analysis
Figure 7. The failure of CPR35/400-T6.0B25 specimen
The buckling behavior of specimens made of SM 490 steel was similar to that of using SS 400 steel. Figure 7 showed the failure shape of the CPR/400-T6.0B25 specimen. The plate buckling, the location of failure of the concrete and stud bolt for SS 400 specimens were illustrated in Figure 8. The results of experiment and analysis, the buckling of steel plates occurred between the stud bolts. The buckling of steel plate results from finite element analysis occurred at symmetric shape while those of results from experiment occurred at non-symmetric shape. It is judge that this was caused by errors of setting of the specimens, non-uniform set of the concrete, errors of the loadings, and etc.
Figure 8.
The buckling of specimens results from experiments
Table 4 showed the compressive strength when buckling of steel plates occurred and maximum compressive strength. In Table 4, central value means the value when buckling occurred between (2 or 8) and (5 or 11) while mean value means the mean value when buckling occurred among (1,2,3 or 7,8,9) and (4,5,6 or 10,11,12) in Figure 5.
specimens except for No. 1(PR35/490-T6.0B50) specimen occurred at 71%~80% of the maximum compressive loads. In specimens stiffened by rib, with the B/t ratio increased, the buckling of steel plate was occurred at the inelastic range rather than the elastic range.
Table 4. The buckling loads of steel plate
Buckling Loads
Pbuckling(kN) Ptest /Pbuckling No
Col(1)
Specimens Col(2)
Failure loads Ptest(kN) Col(3)
Center Col(4)
Average Col(5)
Center Col(6)
Average Col(7)
1 CPR35/490-T6.0B50 8122 7822 8022 0.96 0.99
2 CPR35/490-T6.0B33 9398 7215 6665 0.77 0.71
3 CPR35/490-T6.0B25 7567 5995 6038 0.79 0.80
4 CPR35/400-T6.0B50 9407 5518 7317 0.59 0.78
5 CPR35/400-T6.0B33 9024 6911 6592 0.77 0.73
6 CPR35/400-T6.0B25 7733 5736 5622 0.74 0.73
7 Average 0.77 0.79
8 Standard deviation 0.12 0.10
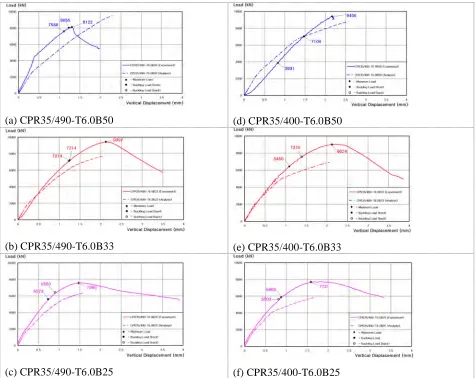
5.2 Maximum Compressive Strength
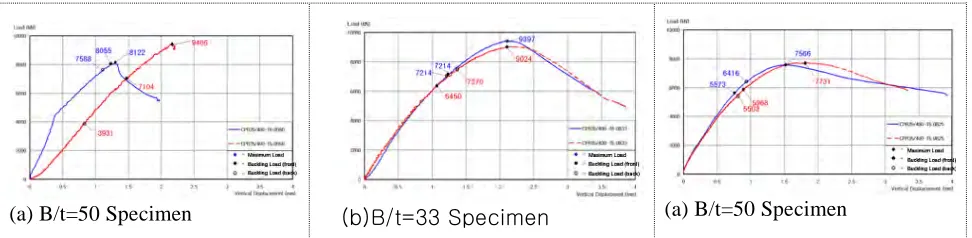
The load-displacement curves for all specimens were illustrated in Figure 9. In these figures, the solid lines displayed the experimental values while dot lines displayed the values results from finite element analysis.
(a) CPR35/490-T6.0B50 (d) CPR35/400-T6.0B50
(b) CPR35/490-T6.0B33 (e) CPR35/400-T6.0B33
(c) CPR35/490-T6.0B25 (f) CPR35/400-T6.0B25
According to the experimental values, with decreased the B/t ratio from 50 to 25, a cross section area of the specimen decreased, and the maximum compressive strength of the specimen also decreased from about 9,400kN to 7,700kN. The compressive strength of experimental results was shown to be about 22% more than those of finite element analysis except for N0. 1(PR35/490-T6.0B50) specimen. And, the compressive strength of the JEAG4618 by equation 1 had good agreement with those of finite element analysis showing to be about 2% more than those of finite element analysis. However, the compressive strength results from N0. 1(PR35/490-T6.0B50) specimen shown to be about 11% and 15% less than those of JEAG4618 and finite element analysis, respectively. This could be because of non-uniformity of concrete, construction errors, and so on. Therefore, the maximum compressive strength predicted by JEAG4618 (Eqn. 1) would not reflect appropriately the strength reduction due to above mentioned factors. In this paper, proposed formula which could secure the safety caused by strength reduction was suggested by modifying fckAc to
c ckA
f
85 .
0 of the compressive strength of concrete. The proposed formula was as follows.
c ck ss
ys s cr
n F A F A f A
P = + +0.85
(2)
5.3 Effect of Yield Strength
The effect of yield strength was evaluated by the graph by load vs. B/t ratio in Figure 10. The compressive strength usually increases with the increase of the yield strength. However, the maximum compressive strength was not increased by the increase of the yield strength due to the small cross sectional area of the steel plate. The buckling of the steel plate for the elastic specimen, B/t=50, occurred at the inelastic range due to the confinement effect of the rib.
(a) B/t=50 Specimen (a) B/t=50 Specimen
Figure 10. Load vs. Displacement for SS400 and SM490
5.4 Buckling Analysis
The buckling strength of the steel plate was evaluated by the Euler column theory (Kanchi, 1996; Miyauchi, 1996). If we consider SC structure as column supported by top and bottom studs, the buckling strength by Euler can be expressed as;
( )
2( )
22 2
2
/
12K B t
E A
KL I
E s
col s
s s col
cr
!
!
"
= =#
# (3)
The stress vs. B/t ratio relationship was expressed by the Euler buckling stress (
!
cr,Euler) and AISC equations(
!
cr,LSD) in Figure 11. The strains were measured from strain gauge at the local buckling state. The strains were ranged from 650x10-6 to 2100x10-6. The strain of the specimen with B/t =50 for SM490 steel was above the limit by AISC. The one with B/t=33 resulted within the range by AISC. The strain with B/t=25 showed a little difference when the elastic equation was used. The strain ranges for B/t=50 and 33 with SS400 steel showed higher value than the limit line by AISC suggested. However, strain ranges for B/t=25 resulted lower values than the limit line by AISC. The paper identified that the strain values for the elastic specimen well agreed with Euler Equation.5.5 Effective Length Factor
(b) SM400 Type specimen Figure 11. Strain of steel plates vs. B/t relationship
( )
22
/
12 B t
K
test
!
"
= . (4)
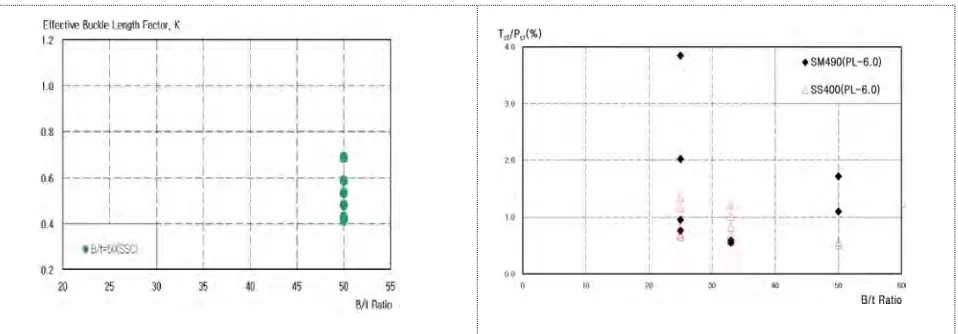
The effective length values vs. B/t relationships are plotted in Figure. 12. The strain values for the B/t=25 and 33 was not include in the statistics of the K calculation in this paper. The K values was calculated with the elastic specimens, B/t=50 which are No. 1 and No. 4 specimens. The effective length factor in Kanchi and Miyauchi’s research was about 0.7. However, this paper concluded that the effective length factors ranged from 0.41 to 0.69. And the average was 0.50. Accordingly, it is considered that the stiffened steel plate structures showed quite good confinement effect between steel and concrete.
Figure 12. Effective length vs. B/t relationship Figure 13. Tensile strength of stud vs. B/t relationship
5.6 Tension Behavior of Headed Studs Bolts
Initially the strains of steel plates are in elastic range. If compression force is continuous increased to the inelastic range, the headed shear studs are subjected to take tension force by the separation between steel plates and concrete. In other word, the steel plates between the top and bottom studs push out to separate from concrete. At this moment, the buckling strength of steel plates and the tension force of stud bolt can be expressed as follows:
Bt E
Pcr =
!
cr sf (5)st st st
st
E
A
T
=
!
(6)
excellent in the SSC structure. The studs usually subjected to take combination both tension and shear, the 4% will be reasonable.
6
CONCLUSION
The compression characteristics for the SSC structures were experimentally evaluated. The buckling pattern, maximum compressive strength, the yield strength effect, and effective length factors were studies. The following conclusions can be drawn:
First, the buckling of the SSC structures occurred in horizontal direction between the studs. The buckling pattern was also identified by FEM analysis.
Second, the buckling strength of steel plates showed about 20% higher values than the theoretical values. The suggested equation for compression strength showed about 35% marginal safety.
Fourth, the effective length factor was evaluated and the K value can be approximated by 0.5 such as fixed condition in column end condition.
Fifth, the tensile strength of the head stud bolt over the buckling strength was ranged from 0.5% to 3.9%. The paper recommended this ratio at least by 4% to secure the safety.
Acknowledgements. This research was supported by the Electric Power Industry RNS, “Development of Modular Construction Method in NNP structures (SC structures)” in 2006 and the authors also appreciate for the support.
Symbols.
s
A Area of steel plates mm2
B Horizontal and vertical spaces of headed stud bolts mm
Pcr Buckling strength of steel plates between studs MPa
Tst Tensile strength of headed stud bolts MPa
REFERENCES
ABAQUS the general analysis program documnetation, 1996
Masaki, Kanchi et al. 1996. Experimental study on a concrete filled steel structures, Part 2, Compressive Test(1). Architectural Institute of Japan Conference. P. 1071-1072
M. Takeuchik, M. Narikawa, I. Matsuo, K. Hara, S. Uaami. 1998. Study on a concrete filled structure for nuclear power plants, Nuclear Engineering and Design. Vol. 179. P.209-223
Theodore V. Galambos. 1998. Guide to stability design criteria for metal structures. Fifth Edition. P.126