Large Scale Data Munging using SparkR
Sachidanand Tripathi1, Hrishikesh Kherdekar2
Solution Architect, Tata Technologies Limited, Mumbai, India1
Jr. Data Scientist, Tata Technologies, Mumbai, India2
ABSTRACT: It is a known fact that 90% of all the data in the world has been generated over the last two years. The internet companies are swamped with data that can be aggregated and analyzed. Big Data and Distributed Computing is the next essential thing that the companies have to adapt to, for exploring their data to maximize their profits and increase business efficiency using data analysis. This is where analytical tools come into the picture; R is one such tool with amazing capabilities however it is widely publicized that the biggest limitation in the R is the data processing technique which is to load everything up in memory and process it. This not only limits the amount of data you can process but it also scales very badly for complex processes. In this paper we will present how to perform large scale data munging and its subsequent analysis with R.
KEYWORDS: Big Data; Amazon S3; Apache Spark; Elastic Compute Cloud; Elastic Map Reduce; Predictive models; R; Statistical learning;
I. INTRODUCTION
As of 2016 Q1, limits on the size of data sets that were viable to process in a reasonable amount of time were on the order of ‘petabytes' of data. Now, be it Walmart’s handling of more than 1 million customer transactions every single hour, the FICO Falcon Credit Card Fraud Detection System’s protection of 2.1 billion active accounts worldwide or be it the volumes of data generated by Large Hadron Collider experiments in CERN, there are 100 collisions of interest per second. Big data is a definite eventuality. It is difficult to work with big data using our traditional relational databases, desktop statistics and visualization packages, demanding the use of massive parallel software.
Although Hadoop addresses such concerns at the moment, bearing in mind the business feasibility of procuring it and the speed at which research and development in R, people are developing integrated tools, building more user friendly versions of machine learning and at the same time bridging the gap in handling large datasets, R is the future – without any costs.
A common misconception about Big Data is that it is a black box: you load data and magically gain insight. That is not the case. For Big-Data Scientists, data preparation is the crucial hurdle to Insights; loading a big data platform with good quality data that has enough structure to deliver value is a lot of work. Data scientist spend a reasonably large amount of time in the data preparation phase of most projects. Whether you call it data wrangling, data munging or data janitor work, it is estimated 50%-80% of any data scientists' time is spent on data preparation. [4]
Although this issue can be addressed by enterprise software, in this paper we will focus on an alternative approach with technologies which are more accessible and have high scalability features.
We faced similar problems in achieving our objectives while trying to create a propensity model for a large dataset. Let’s look at the case study of prediction of sales of Annual Maintenance Contracts for a renowned manufacturing OEM.
We then explored the objectives and business usefulness of this case study followed by the current approach. Having done that, we have showcased our approach and further discussed over the same.
II. DATASET
number of vehicle, sale date, service date, and annual maintenance contract date amongst others. We used inner join to these tables to get comprehensive data based on the chassis number of vehicle. We then used the above mentioned fields to derive some key variables that we needed such as age of vehicle from sale date till the reference date that was the date till which we had the data. We then used this data for further analysis.
This data is not freely available. We have not published any customer or company detail in this paper. We have published our findings from performing propensity modelling with a new methodology that we have described. We have not published the findings of our model as it would violate our security policy but have described in detail the method and steps used to get there.
III.OBJECTIVE
A Propensity Model is a statistical scorecard that is used to predict the behavior of your customer or prospect base. Propensity models are often used to identify those most likely to respond to an offer, or to focus retention activity on those most likely to churn.
The model may be applied to your database to score all your customers or prospects. You can then select only those who are most likely to exhibit the predicted behavior, for example response, and focus your mailing activity appropriately.
We will look at our case study wherein we have built a propensity model through large dataset that would not have been possible earlier through traditional open-source R. The datasets that we have used for this are in the order of Gigabits.
IV.CURRENTAPPROACH
We work a lot on propensity model using on premise enterprise software implementation. The components that we talk to are data warehouse software which acts as the data mart for our analytical application and our advanced analytics enterprise software which is our analytical engine.
V. OURAPPROACH
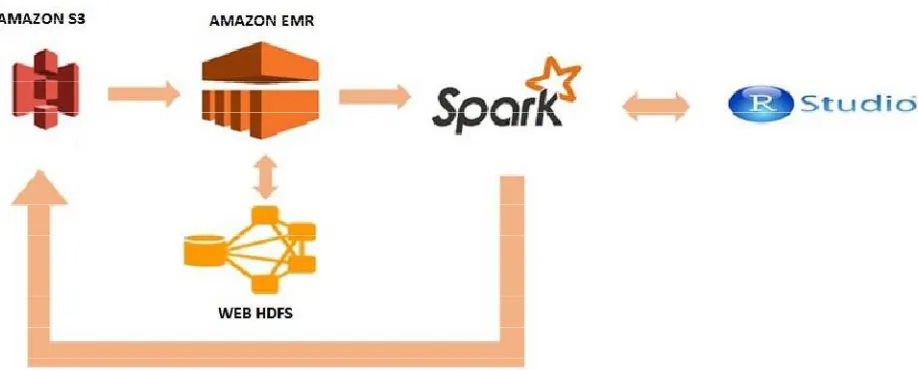
Figure 1: Base Architecture for our approach.
5.1 Data Storage
any time, from anywhere on the web. It gives any developer access to the same highly scalable, reliable, fast, inexpensive data storage infrastructure that Amazon uses to run its own global network of web sites. The service aims to maximize benefits of scale and to pass those benefits on to developers. [1]
In this paper, we have used the Amazon Web Services (AWS) for storage of our data in its S3 buckets and hence the data can be retrieved from anywhere at any time making our approach highly accessible. It is a managed service and hence the security measures of AWS S3 make the data highly resilient and secure access to data is assured.
We had stored 3 data sets namely the vehicle sale data, vehicle service data and AMC data in the S3 bucket for further processing.
5.2 Large Data Processing
Amazon Elastic Map-Reduce (EMR) is a web service that makes it easy to quickly and cost-effectively process large amounts of data. EMR simplifies big data processing, providing a managed Hadoop framework that made it easy, fast, and cost-effective for us to distribute and process vast amounts of our data across dynamically scalable Elastic Compute Cloud (EC2) instances.
EC2 provides scalable computing capacity in the Amazon Web Services (AWS) cloud. Using EC2 eliminated the need to invest in hardware up front, so it was possible to develop and deploy our application faster. EC2 can be used to launch as many or as few virtual servers as needed, configure security and networking, and manage storage. EC2 enabled us to scale up or down to handle changes in requirements or spikes in popularity, reducing our need to forecast traffic. [2]
In this paper, we interacted with data in AWS data store, S3 and used the EMR to process our data. EMR securely and reliably handles big data on cloud and we can provision one, hundreds, or thousands of compute instances to process data at any scale. We can easily increase or decrease the number of instances and we only paid for what we used.
EMR has tuned Hadoop for the cloud; it also monitors our cluster —retrying failed tasks and automatically replacing poorly performing instances. For security purposes, EMR automatically configures EC2 firewall settings that control network access to instances, and it is possible to launch clusters in an Amazon Virtual Private Cloud (VPC), a logically isolated network that we define. We can easily enable encryption for data at-rest and in-transit using EMR security configurations, including S3 server-side encryption and client-side encryption with EMRFS, on-cluster HDFS and local disk encryption, and open-source features for encryption in-transit for a variety of applications.
5.3 Data Munging
Apache Spark is an open-source, distributed processing system commonly used for big data workloads. It utilizes in-memory caching and optimized execution for fast performance, and also supports general batch processing, streaming analytics, machine learning, graph databases, and ad hoc queries. [5]
Apache Spark on Hadoop YARN is natively supported in EMR, and it is possible to quickly and easily create managed Apache Spark clusters from the AWS Management Console, AWS CLI, or the Amazon EMR API. Moreover, there is scope to leverage additional Amazon EMR features, including fast Amazon S3 connectivity using the Amazon EMR File System (EMRFS), integration with the Amazon EC2 Spot market, and resize commands to easily add or remove instances from the cluster in case it is required.
This method helps us to join/break and manipulate the data according to our requirements and it is this method that has enabled us to perform large dataset joining in a matter of minutes which was not possible earlier. The logic behind using RDD for this method is that as RDDs are partitioned across nodes of the cluster, the individual elements can be computed in parallel which gives immense boost to the time taken and greatly reduces the computation load on single processing system.
Once we imported the data from S3 as RDDs, we executed the necessary join operations and then cleaning and filtering as well as sub setting procedure was performed. Once we had the data in our suitable format, we then converted the transformed data into R datasets for the next step of building the propensity model through R methodologies and packages.
5.4 Propensity model building.
We followed a standard methodology henceforth for the building of the propensity modelling in R. We first derived a few required variables such as the age of vehicle and used libraries such as “reshape” and “sqldf” to format the data to run the Generalized Linear Modelling algorithm over it.
In statistics, the Generalized Linear Model (GLM) is a flexible generalization of ordinary linear regression that allows for response variables that have error distribution models other than a normal distribution. The GLM generalizes linear regression by allowing the linear model to be related to the response variable via a link function and by allowing the magnitude of the variance of each measurement to be a function of its predicted value.
Generalized linear models were formulated as a way of unifying various other statistical models, including linear regression, logistic regression and Poisson regression. It was proposed as an iteratively reweighted least squares method for maximum likelihood estimation of the model parameters. [6]
Logistic regression is useful when you are predicting a binary outcome from a set of continuous predictor variables. As we were predicting whether the customer will buy the AMC, yes or no, this was the preferred method for our model. [7]
Once we run our model, we got a few significant variables and when that was tested against the dataset, we got an accuracy of 76% over the data.
5.5 Making Predictions
Once we had the model ready, we ran it over the whole dataset which was already processed and munged. This complete dataset was not previously tested and we used this to make our predictions on the data based on our model. The whole dataset was in the order of Gigabits.
This data was then stored again in a S3 bucket along with the R code. The data that was derived from the predictions was then used for visualization process.
VI.USECASE-15MILLIONROWSDATAPROCESSING
One of the datasets that we used had over 15 Million rows and 44 columns. We tried processing the data over different technologies to compare our methodology with the existing technologies in the industry.
This chart depicts the efficiency of our model over other existing approaches
VII. CONCLUSIONANDFUTUREWORK
In this paper, we have successfully been able to demonstrate the large scale data munging in R. Our method involves use of open source and highly reliable technologies that have high scalability capabilities. As our method uses fast in-memory parallel processing for data, it can handle the data with the estimated pace of growth in data sizes over the upcoming years. It is an extremely affordable option for analytics as well using storage and processing on a managed cloud. As our data storage is managed, it is extremely secured as well.
Summary of our AMC model:
The signification variables found in the model was same as what we got in our advanced analytics enterprise software.
The co-efficient values of the variables were also the same as that in our advanced analytics enterprise software.
Model efficiency was 76% accurate in the prediction which is benchmarked against what we get in our advanced analytics enterprise software.
This method is hugely dependent upon the packages available for R language and as R has a large number of openly available libraries, the only limitation of our methodology is a new analytical technique that is not supported by R.
In our future endeavours, we will try to implement this methodology for enterprise level architecture, direct integration with several data sources and data visualization tools for automated and real time insights for business.
5 10
72
0.25 0
10 20 30 40 50 60 70 80
SAS RMR / map-reduce
Open Source R SparkR
Ti
m
e
ta
ke
n
(
H
o
u
rs
)
REFERENCES
1. http://docs.aws.amazon.com/AmazonS3/latest/dev/Welcome.html 2. http://docs.aws.amazon.com/AWSEC2/latest/UserGuide/concepts.html 3. https://aws.amazon.com/emr/details/spark/
4. http://www.datasciencecentral.com/profiles/blogs/in-big-data-preparing-the-data-is-most-of-the-work 5. http://spark.apache.org/docs/latest/programming-guide.html
6. https://en.wikipedia.org/wiki/Generalized_linear_model 7. http://www.statmethods.net/advstats/glm.html
8. http://www-bcf.usc.edu/~minlanyu/teach/csci599-fall12/papers/nsdi_spark.pdf
9. http://www.altran.fr/fileadmin/medias/0.commons/documents/Whitepapers/Spark_abstract.pdf
BIOGRAPHY
Sachidanand Tripathi has around 14 years of work experience in implementing technical solutions in IT. He is currently working as a Project Manager at Tata Technologies and has handled the role of Enterprise architect, solution architect and technical lead for many on premise applications and cloud applications. He has been involved in solving unique problems for the customers, most of them first timers. He has a TOGAF 9 Certification from The Open Group. He is pursuing his BIG data Analytics program from S P Jain School of Global Management and has completed his engineering from Swami Ramanand Teerth Marathwada University. He has an affinity of learning new technologies and sharing it with peers. He is an SME in data integration andloves to work on integration challenges.