Evaluation of the residual stresses for modified 9Cr-1Mo steel welds by a neutron
diffraction technique and a numerical simulation
Seok-Hoon Kim1), Jong-Bum Kim1), Won-Jae Lee1)
1)Korea Atomic Energy Research Institute, Daejeon, Korea
ABSTRACT
The objective of this paper is to compare the measured residual stresses for modified 9Cr-1Mo steel welds induced by welding processes and the predicted residual stresses by a numerical simulation. The neutron diffraction technique is used to measure the residual stresses both on the surface and in the interior of a thickness for welded specimens. A T-plate specimen and a V-butt specimen are prepared and their residual stresses are measured. A finite element model is employed to calculate the transient temperature and the residual stresses based on a distribution of the temperature fields. The measured data and the simulation results are compared and the characteristics of a distribution of the residual stresses are discussed.
INTRODUCTION
Cr-Mo ferritic steels are widely used as the structural material of the steam pipes in fossil and nuclear power plants because of their excellent strength as well as their good oxidation resistance at a high temperature. The mechanical strength of 9Cr-1Mo steel at an elevated temperature can be improved by V and Nb additions and it is called a modified 9Cr-1Mo steel. The use of modified 9Cr-1Mo steel is economical not only to reduce the weight of the steam pipes but also to be cost effective in the construction of power plants. This alloy is much more resistant to a thermal fatigue than austenitic stainless steels because of its lower thermal expansion coefficient and higher thermal conductivity. Thus, modified 9Cr-1Mo steel provides extremely good mechanical properties at a high temperature when produced and heat treated to form a proper microstructure. A modified 9Cr-1Mo steel is being considered for the structural material of the reactor pressure vessel and piping in advanced reactors such as VHTR(Very High Temperature Reactor) and SFR(Sodium Fast Reactor). The weld characteristics in thick rolled or forged plates is important in the design of a reactor pressure vessel and piping. The interest on the weld characteristics of modified 9Cr-1Mo steel is increasing due to its potentiality for an application to all modern power plants and advanced reactor system[1].
In the design of a welded structure the effects of a residual stress and deformation are important. Residual stresses in a welded structure occur throughout the area of a solidified weld metal and a heat affected zone. A nonuniform transient temperature field occurs due to a high intensity of a localized heat source. This field initially causes a rapid thermal expansion followed by a thermal contraction of a heat affected material. The induced temperature gradient and the restraint condition determine a residual stress of welded structures when it has cooled down. The residual stress field is the initial stress field of a welded structure, and it should be combined with the applied service loading in a structural design. The magnitude and distribution of a residual stress play a fundamental role in the integrity and reliability of a welded structure. For instance, a compressive surface stress can prevent a stress corrosion cracking or fatigue crack initiation, whereas a tensile residual stress combined with the stresses due to service loads can induce catastrophic effects on a fatigue behavior, corrosion properties and a brittle fracture.
utilized to measure the residual stress distribution in both the longitudinal and transverse directions. The experimental and calculated results are compared and the characteristics of a distribution for a residual stress are discussed.
EXPERIMENTAL WORK
Specimens
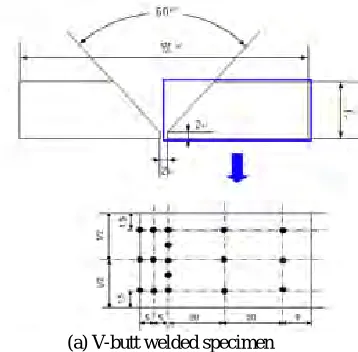
Two types of specimens were manufactured from modified 9Cr-1Mo, and by utilizing a GTAW welding process as shown in Fig. 1. A T-plate welded specimen was made with two plates of size 140mm x 100mm x 15.88mm and 100mm x 80mm x 15.88mm. A V-butt welded specimen was made with two plates of size 60mm x 100mm x 15.88mm.
Table 1. Dimension of the welded specimens
Type Welding
Method
W (mm)
t (mm)
Total no. of Weld Pass V-butt weld
specimen GTAW 120 15.88 9
T-plate weld
specimen GTAW 140 15.88 12
Fig. 1 Configurations of the V-butt and T-plate welded specimens
(a) V-butt welded specimen (b) T-plate welded specimen
Table 2. Welding condition
Current(A) Voltage(V) Welding
Speed(mm/min)
100 30 350
Each plate was cut by a laser from a large sheet and the joint parts were machined at the edge of a plate along its length according to a joint design. The weld joint of the V-butt and T-plate specimens as presented in Table 1 were made by 9 passes and 12 passes deposits in a groove, respectively. The residual stress pattern is not totally symmetrical because of a cutting variation, a restraint condition and the effect of the weld deposits. The welding parameters of the two types of specimens were a current of 100 A, a voltage of 30 V and a welding speed of 350 mm/min as shown in Table 1. The configurations for both the T-plate and V-butt welded specimens are presented in Fig. 1. The number of measurement points for the residual stresses is 17 for each specimen as shown in Fig. 2. The weld metal used a production equivalent to ER90S-B9 according to the AWS standard.
Measurement method of residual stress
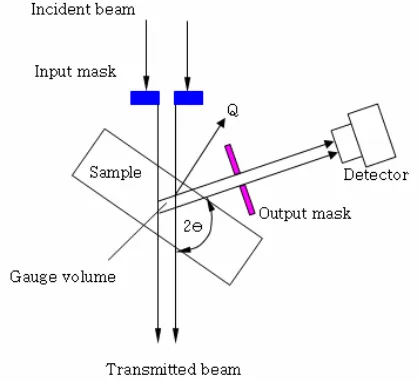
When a beam of neutrons of wavelength λis incident on a crystalline material, a diffraction pattern with a sharp maxima is produced. The angular positions of the maxima for a family of crystallographic planes of separation d are given by the Bragg equation
λ
θ n
dsin =
2 (1) wherenis an integer and 2θis the diffraction angle as shown in Fig. 3. Measurements can be made with a continuous monochromatic or a pulsed polychromatic beam of neutrons. For a monochromatic beam of a constant wavelength any change in the lattice spacing ∆dwill cause a corresponding shift ∆θ in the angular position of the Bragg reflection so that the lattice strain in the direction of the scattering vector Q is given by
θ θ
ε = ∆ = −∆ cot
d d
(2)
To calculate the absolute values of a strain, the unstressed lattice spacing do must be known. Also, in general, to define the
strain tensor at a point accurately, measurements of six orientations are required. However, when the principal directions are known, three will suffice. When these coincide with the coordinate directions x, y and z, the principal stresses are given by
[
(1 ) ( )]
) 2 1 ( ) 1
( x y z
x
E ν ε ν ε ε
ν ν
σ − + +
− +
= (3)
with corresponding expressions for σy and σz. In this equation, Eis the elastic modulus and νis the Poisson’s ratio.
Fig. 3 Principles of a neutron diffraction
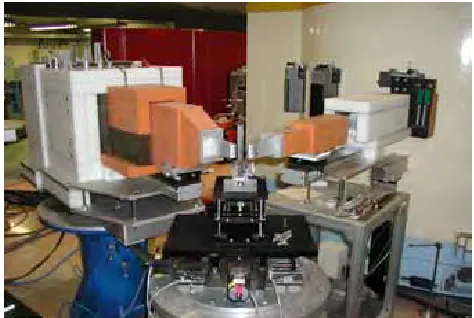
For measuring the residual stress of a welded specimen, HRPD(High Resolution Powder Diffractometer) as shown in Fig. 4 was used. The experiment procedure when using a neutron diffraction consists of three steps. First is the initial stage that determines the position of the equipment and the size of the slit, and measures the wavelength of the neutron beam. Second is measuring the distance between the lattices do for the specimen in a condition of a zero stress and this becomes
the baseline value for the measurement of a residual stress. Finally, after fixing the welded specimen at the sample stage, we measure the distance d between the diffraction measurement volumes from each measurement direction.
Fig. 5 shows a conceptual diagram of the experimental equipment. The center axis is determined by fixing the incident beam and by adjusting the X-Y direction translator under the specimen holder and the detector at the left side. In order to measure the strain components of the three rectangular coordinate directions (normal, transverse and longitudinal directions), each welded specimen is positioned in the specimen holder[2,3].
Fig. 4 High Resolution Powder Diffractometer
Fig. 5 Schematic diagram of the experimental apparatus
FINITE ELEMENT ANALYSIS
Model Description
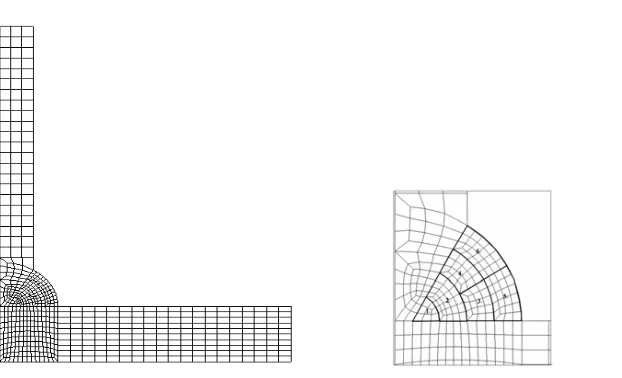
sequential addition of each weld bead. The weld passes were modeled to be added to the weld region just before a welding for each pass by using the ‘born and death’ option in the ABAQUS software. A V-butt welded specimen is composed of 11 weld passes and a T-plate specimen is composed of 6 weld passes. To achieve an element death effect, the ABAQUS does not actually remove the elements, instead, it just deactivates them. In the case of the heat flow model, the actual conductivity of a material is set to zero. In a similar way, when elements are born, they are actually added to the model. During the reactivation step the thermal conductivity of the heat transfer elements is ramped up from zero for each step. The mechanical analysis was modeled similarly for a sequential addition of each weld bead. All the new bead elements were added to the model in an initial strain-free state. Loading was supplied from the temperature-time history of the thermal analysis[4].
Fig. 6 Finite element model of the V-butt welded specimen
Fig. 7 Finite element model of the T-plate welded specimen
Material Properties and boundary condition
above a melting point as a thermal load to an element equivalent to a molten metal. For the V-butt welded specimen, the boundary condition of the mechanical model had a plain strain condition with a constraint in the x directional displacement for the left end, and both ends were simply supported in the y-direction. For the T-plate welded specimen, it had a plain strain condition with a constraint in the x directional displacement of the left symmetric axis and the right end was simply supported in the y-direction[5].
Table 3. Chemical composition of the base metal
Composition C Mn P S Si Cu Ni Cr Mo Al Nb
Base Metal 0.117 0.443 0.020 0.0005 0.330 0.090 0.153 8.888 0.862 0.011 0.073
Composition V Ti N
Base Metal 0.192 0.003 0.0451
Table 4. Mechanical properties of the base and weld metal and the heat treatment condition
Material Yield Strength
(0.2%) Tensile Strength Elongation Normalizing Tempering
Base Metal 593 MPa 734 MPa 35 % 1050
o
C, 1min/mm
770 oC, 3min/mm
Weld Metal 431 MPa 569 MPa 34 % N/A N/A
Analysis Results and Discussion
In the thermal transient analysis of the multipass welds, each weld pass was modeled as being deposited instantaneously just before a welding of each pass by using the model change option in ABAQUS. Each weld pass was assumed to have the same welding parameters as shown in Table 1. The temperature distribution after a final pass is not the same for both sides of the weld centerline because the weld beads are not deposited symmetrically about the weld centerline. This can generate different residual stresses and strains in the right and left side of the weld centerline.
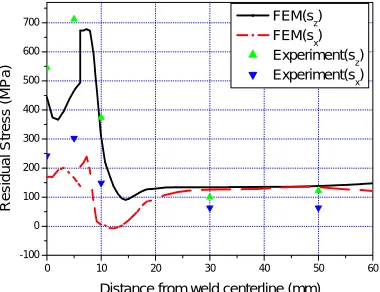
For the V-butt welded specimen, Figs. 8 to 10 illustrate the predicted and measured residual stress distributions at the top, middle and bottom surface, respectively. These distributions show that high tensile longitudinal residual stresses(Sz) are
predicted near the weld and heat affected zone and they drop off rapidly with their distance from the weld centerline. The high tensile longitudinal residual stress of 678 MPa was predicted at the heat affected zone at the middle surface, which is smaller than the measured residual stress as shown in Fig. 9. The transverse residual stresses(Sx) were all predicted as
smaller than the longitudinal residual stresses. The maximum transverse residual stress of about 400MPa was predicted at the weld toe at the top surface. According to the analysis results, the maximum high tensile residual stress is located in the area of the heat affected zone at the condition of a under-matched weld. The predicted residual stresses have a close agreement with the measured data although there are some differences, quantitatively.
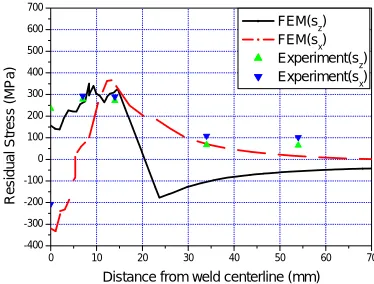
For the T-plate welded specimen, Figs. 11 to 13 illustrate the predicted and measured residual stress distributions at the top, middle and bottom surface, respectively. The distribution of the longitudinal and transverse residual stresses were predicted as lower than those of the V-butt welded specimen. A tensile longitudinal residual stress of 326 MPa is predicted at the weld toe as shown in Fig 11. Transverse residual stresses was mainly predicted near the top surface[6].
0 10 20 30 40 50 60
-100 0 100 200 300 400 500 600 700 Residual Stres s (M Pa )
Distance from weld centerline (mm) FEM(sz) FEM(s
x)
Experiment(s
z)
Experiment(sx)
0 10 20 30 40 50 60
-100 0 100 200 300 400 500 600 700 R esidua l Str ess (M Pa )
Distance from weld centerline (mm) FEM(sz) FEM(sx) Experiment(s
z)
Experiment(s
x)
0 10 20 30 40 50 60 -200 -100 0 100 200 300 400 500 600 700 Residua l Stress (M Pa )
Distance from weld centerline (mm) FEM(sz) FEM(sx) Experiment(sz) Experiment(sx)
0 10 20 30 40 50 60 70
-400 -300 -200 -100 0 100 200 300 400 500 600 700 R e si d u a l S tr e ss ( M P a )
Distance from weld centerline (mm) FEM(sz) FEM(sx) Experiment(sz) Experiment(sx)
Fig. 10 Variation of the longitudinal and transverse residual Fig. 11 Variation of the longitudinal and transverse residual stresses at the bottom surface for the V-butt welded specimen stresses at the top surface for the T-plate welded specimen
0 10 20 30 40 50 60 70
-300 -200 -100 0 100 200 300 400 500 600 700 R e s idual S tres s ( M Pa)
Distance from weld centerline (mm) FEM(s
z)
FEM(sx) Experiment(s
z)
Experiment(sx)
0 10 20 30 40 50 60 70
-300 -200 -100 0 100 200 300 400 500 600 700 R e sid ua l S tre ss (M P a)
Distance from weld centerline (mm) FEM(s
z)
FEM(sx) Experiment(sz) Experiment(sx)
Fig. 12 Variation of the longitudinal and transverse residual Fig. 13 Variation of the longitudinal and transverse residual stresses at the middle surface for the T-plate welded specimen stresses at the bottom surface for the T-plate welded specimen
CONCLUSION
The residual stress distributions for two types of modified 9Cr-1Mo steel welded specimens such as a V-butt and T-plate weld were measured by a neutron diffraction technique. Finite element simulation was carried out by using combined thermal and mechanical analyses. The experimental results were compared with the analysis results and the following results were obtained.
1. For the V-butt welded specimen, the high tensile longitudinal residual stress of 678MPa was predicted at the heat affected zone at the middle surface, which is about 14 % greater than the yield strength of the base metal in the condition of a under- matched weld. As a whole, the transverse residual stresses were predicted as smaller than the longitudinal residual stresses.
2. For the T-plate welded specimen, the distribution of the longitudinal and transverse residual stresses were predicted as lower than those of the V-butt welded specimen. The maximum longitudinal and transverse residual stresses were measured and predicted near the weld toe through the thickness direction.
Acknowledgement
This study was supported by the Korean Ministry of Science and Technology through its National Nuclear Technology program.
REFERENCES
1. Shiue, R. K., lan, K. C., Chen C. Chen, “ Toughness and austenite stability of modified 9Cr-1Mo welds after tempering”, Materials science & Engineering, A287, 2000, pp10-16.
2. Kim, S. H. and Moon, M. K, et al., “Neutron diffraction measurement and finite element analysis of stress distribution in welded 316L stainless pipe”, Key Engineering Materials, Vols. 270-273, 2004, PP.1310-1315.
3. Wang, D. Q., Hubbard, C. R. and Spooner, S., “Residual stress determination for a ferritic steel weld plate”, ORNL/TM- 1999/141, 1999.
4. Hibbit, Karlsson and Sorensen Ltd. ABAQUS, version 6.5., 2006
5. Yaghi, A. H. and Hyde, T. H., et al., “Residual stress simulation in welded sections of P91 pipes ”, Materials Processing Technology 167, 2005, pp480-487.