ABSTRACT
LI, YUEQING. Evaluation of Collaborative Brain-Computer Interface (C-BCI) for People with Motor Disabilities. (Under the direction of Dr. Chang S. Nam.)
Brain-computer interfaces (BCIs) are new technologies that allow users to communicate with the outside world or control external equipment without the use of “normal” pathways of peripheral nerves and muscles. For people with motor disabilities, BCIs provide a degree of communication and control that can help make simple tasks more convenient and ultimately reduce the burden placed on caregivers at times. Meanwhile, BCIs could also be used to study brain structure and function in the context of human cognition and behavior. SSVEP BCIs are non- invasive BCIs that use SSVEP brain signals to communicate or control. Without initial training needed, users can use SSVEP BCIs by only focusing on the visual stimuli.
However, current efforts in the area of BCI technology still present significant gaps. Most existing BCIs serve only single users. Few studies have explored the integration of BCIs in “normal” life, especially to support interactive work and collaboration with other people. There is a general lack of understanding rega rding how BCIs should support collaborative work between users with motor disabilities and between users with and without motor disabilities under various task conditions.
The research described in this paper derived from two separate studies. Study 1 was a fundamental investigation of SSVEPs in which user sensitivity to specific visual stimuli was assessed through the manipulation of LED light frequency and color. The study employed three types of dependent variables: (a) task performance (response rate), (b) brain activity (spectral power) and (c) user evaluations (subjective ratings of fatigue and preference toward light frequency and color). Study 2 recruited the same group of participants as Study 1 and examined the effects of the collaboration modes under user-specific stimuli configurations determined in Study 1.
Besides an individual mode where a single user performs a task, two collaboration modes were presented: (a) Sequential mode: a pair of users takes turns to perform a task, (b) Simultaneous mode: a pair of users performs a task at the same time (i.e., brain signals from both users are used to control the BCI). Moreover, the effect of luminance contrast was investigated to validate the applicability of the SSVEP-based BCI. Study 2 employed three types of dependent measures, including: (a) task performance (accuracy, task completion time, and information transfer rate (ITR)), (b) brain activity (spectral power), and (c) user subjective evaluations. Participants with motor disabilities were recruited from the ALS association and local community. Age- matched able-bodied participants were recruited from the local community to investigate the effect of motor disability on C-BCI performance.
Evaluation of Collaborative Brain-Computer Interface (C-BCI) for People with Motor Disabilities
by Yueqing Li
A dissertation submitted to the Graduate Faculty of North Carolina State University
in partial fulfillment of the requirements for the degree of
Doctor of Philosophy
Industrial Engineering
Raleigh, North Carolina 2014
APPROVED BY:
________________________________ ______________________________
Chang S. Nam David B. Kaber Committee Chair
DEDICATION
BIOGRAPHY
ACKNOWLEDGMENTS
I would like to extend my sincere appreciation and gratitude to my advisor, Dr. Chang S. Nam, who led me to the world of human factors and ergonomics, taught me how to conduct research. Dr. Nam inspired me to choose meaningful research questions and taught me how to be a thorough and responsible researcher.
I would like to extend my gratitude to my committee members, Dr. David Kaber and Dr. Michael Lewek, who provided numerous insightful suggestions rega rding the research questions and data analysis. I want give a special thanks to Dr. David Dickey, who spent his rare time to serve as my committee member and gave me lots of suggestions on data analysis. I also want to thank Dr. Bojko Bakalov, who agreed to serve as GRS in my dissertation defense. I would like to thank Lisa Hoskins, Jim “Catfish” Hunter Chapters, ALS association and all the ALS participants. Without their help, there is no way I can finish my experiments. I hope my research can bring you some help in the future. I love all of you!
I would like to thank my research fellows: JungNyun, C.K., Ja Young and K yle. Without their help, the system will not work. I want to thank Shijing, who helped me a lot in conducting the experiment. I also want to give my thanks to Yaoyu, Shuohao, Janet, Rosa, Michael and Jason for their participation in the pilot test.
TABLE OF CONTENTS
LIST OF TABLES ... ix
LIST OF FIGURES ...x
1. INTRODUCTION ... 1
1.1 HOW DOES SSVEP-BASED BCIWORK?... 6
1.1.1 What Is SSVEP? ... 6
1.1.2 SSVEP-Based BCIs ... 10
1.1.3 Other BCI Applications ... 22
1.2 LIMITATIONS OF CURRENT BCIRESEARCH ... 24
1.3 RESEARCH OF COLLABORATIVE BCI... 26
2. LITERATURE REVIEW ... 28
2.1 SSVEPSTIMULI ... 28
2.1.1 Stimulus Device ... 28
2.1.2 Frequency of Visual Stimuli ... 30
2.1.3 Color of Visual Stimuli ... 33
2.1.4 Luminance Contrast ... 34
2.2 MOTOR DISABILITY... 35
2.3 SSVEP-BASED COLLABORATIVE BCIS... 37
2.3.1 Group versus Individual... 37
2.3.2 Collaborative BCIs... 41
2.3.4 Collaboration Mode ... 46
2.4 LIMITATION OF PREVIOUS RESEARCH ... 49
2.5 RESEARCH HYPOTHESES ... 51
2.5.1 Study 1 ... 51
2.5.2 Study 2 ... 52
3. STUDY 1: IDENTIFICATION OF USER-SPECIFIC VISUAL STIMULUS FREQUENCY AND COLOR ... 55
3.1 OBJECTIVE... 55
3.2 METHODS ... 55
3.2.1 Participants... 55
3.2.2 Apparatus ... 56
3.2.3 Independent Variables (LED parameters)... 58
3.2.4 Dependent Variables ... 59
3.2.5 Data Acquisition and Signal Processing ... 60
3.2.6 Experimental Task ... 62
3.2.7 Procedure ... 64
3.2.8 Data Analysis: Selection of User-Specific Visual Stimuli ... 65
3.3 RESULTS AND DISCUSSION ... 69
3.3.1 Results ... 69
3.3.2 Discussion ... 70
4. STUDY 2: EVALUATION OF COLLABO RTIVE BCI... 73
4.2 METHODS ... 73
4.2.1 Participants... 73
4.2.2 Apparatus ... 73
4.2.3 Independent Variables... 75
4.2.4 Dependent Variables ... 77
4.2.5 Data Acquisition and Signal Processing ... 80
4.2.6 Experimental Task ... 82
4.2.7 Procedure ... 83
4.2.8 Experiment Design & Statistical Analysis... 84
4.3 RESULTS ... 88
4.3.1 Task Performance ... 88
4.3.2 Brain Activity... 97
4.3.3 User Evaluations ... 100
4.4 DISCUSSION ... 103
4.4.1 Effects of Collaboration Mode... 104
4.4.2 Effects of Luminance Contrast ... 108
4.4.3 Effects of Motor Disability ... 110
5. GEN ERAL DISCUSSION ... 113
5.1 COLLABORATION PATTERNS ... 113
5.2 INDIVIDUAL PERFORMANCE ... 114
5.2.1 Accuracy (%) ... 116
5.2.3 Spectral Power ( ) ... 118
5.2.4 Summary ... 119
5.3 PERFORMANCE MODELING FOR ALS PARTICIPANTS ... 120
5.3.1 Model Fitting ... 121
5.3.2 Summary ... 124
6. CONCLUSION ... 126
6.1 SUMMARY OF RESULTS ... 126
6.2 CONTRIBUTIONS TO BCIRESEARCH... 127
6.3 RESEARCH IMPLICATIONS IN HUMAN FACTOR AND ERGONOMICS (HFE) ... 127
6.4 RESEARCH LIMITATION AND FUTURE WORK ... 129
REFERENCES ... 131
APPENDIX ... 157
APPENDIX A.INFORMED CONSENT FORM ... 158
APPENDIX B.SCREENING QUESTIONNAIRE ... 161
APPENDIX C.DEMOGRAPHICS QUESTIONNAIRE FOR ABLIE-BODIED PARTICIPANTS ... 162
APPENDIX D.DEMOGRAPHICS QUESTIONNAIRE FOR PARTICIPANTS WITH MOTOR DISABILITIES ... 163
APPENDIX E.QUESTIONNAIRE OF STUDY 1 ... 165
APPENDIX F.QUESTIONNAIRE OF STUDY 2 ... 167
LIST OF TABLES
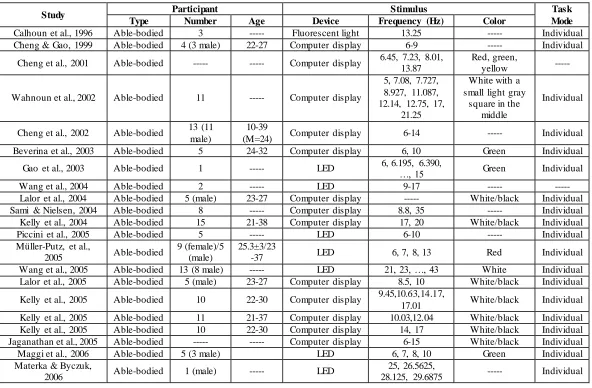
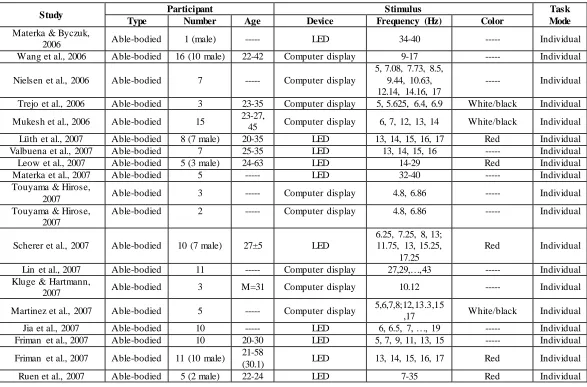
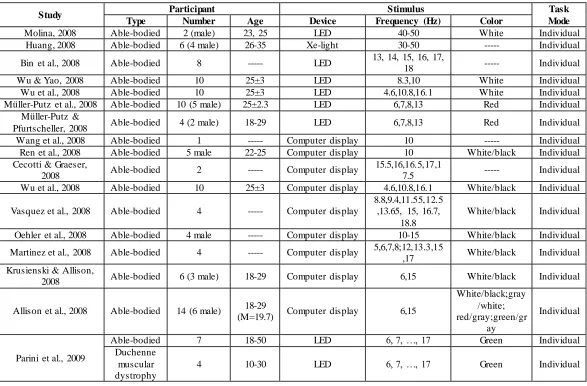
Table 1.1 Summary of SSVEP-based BCI research in chronological order... 14
Table 1.2 Summary of EEG-based BCIs ... 23
Table 2.1 Summary of viewpoints of “Group vs. Individual” ... 37
Table 3.1 Apparatus of Study 1 ... 56
Table 3.2 Experiment design of Study 1... 63
Table 3.3 ALS participants’ user-specific visual stimuli configurations... 69
Table 3.4 Able-bodied participants’ user-specific visual stimuli configurations ... 70
Table 3.5 User preference of visual stimuli ... 71
Table 4.1 Experiment design of Study 2... 85
Table 4.2 Summary of F test error terms ... 86
Table 4.3 Normality and homoscedasticity test ... 87
Table 4.4 Significance effects for task performance ... 88
Table 4.5 Significant effects for brain activity ... 97
Table 4.6 Two-way contingency table of user preference for ALS participants ... 100
Table 4.7 Two-way contingency table of user preference for ALS participants ... 101
Table 4.8 Frequency table of user evaluation of C-BCI system ... 102
Table 4.9 Frequency table of user evaluation of workload ... 102
Table 4.10 Frequency table of user evaluation of LED lights ... 103
Table 5.1 Collaboration patterns in simultaneous mode ... 114
LIST OF FIGURES
Figure 1.1 Research framework ... 4
Figure 1.2 Example of ERP components ... 7
Figure 1.3 Examples of EEG frequency bands ... 8
Figure 1.4 7.5 Hz and its harmonic SSVEPs ... 9
Figure 1.5 Timeline of noninvasive BCI for humans ... 11
Figure 1.6 SSVEP BCI framework ... 12
Figure 1.7 SSVEP BCI spelling system... 19
Figure 1.8 SSVEP BCI navigation system ... 20
Figure 1.9 SSVEP BCI hand orthosis system ... 21
Figure 2.1 Effect of visual stimulation frequency on the SSVEP amplitude ... 31
Figure 2.2 Study 1 framework ... 51
Figure 2.3 Study 2 framework ... 52
Figure 3.1 Frequency detection software ... 58
Figure 3.2 LED lights (red, green and blue from left to right) ... 59
Figure 3.3 Electrode montage (used in Study 1 & 2) ... 61
Figure 3.4 Signal process in Study 1 ... 62
Figure 3.5 Study 1 task sequence... 62
Figure 3.6 Visual stimulus setup and EEG measurement ... 64
Figure 3.7 Study 1 procedure ... 65
Figure 4.1 SSVEP-based robot control system ... 74
Figure 4.2 Signal processing in Study 2 ... 80
Figure 4.3 Study 2 task sequence... 82
Figure 4.4 Study 2 procedure ... 84
Figure 4.5 Main effect of collaboration mode on accuracy ... 89
Figure 4.6 Main effect of luminance contrast on accuracy... 90
Figure 4.7 Average accuracy of ALS and able-bodied participants ... 91
Figure 4.8 Main effect of collaboration mode on completion time ... 92
Figure 4.9 Main effect of luminance contrast on completion time ... 93
Figure 4.10 Average completion time of ALS and able-bodied participants ... 94
Figure 4.11 Main effect of collaboration mode on ITR ... 95
Figure 4.12 Main effect of luminance contrast on ITR ... 96
Figure 4.13 Average ITR of ALS and able-bodied participants ... 97
Figure 4.14 Main effect of collaboration mode on spectral power ... 98
Figure 4.15 Main effect of luminance contrast on spectral power ... 99
Figure 4.16 Average spectral power of ALS and able-bodied participants ... 100
Figure 4.17 STFT plot... 107
Figure 5.1 Main effect of collaboration mode on individual accuracy ... 117
Figure 5.2 Main effect of collaboration mode on individual average completion time ... 118
Figure 5.3 Main effect of collaboration mode on individual spectral power... 119
Figure 5.4 Scatterplot of completion time and user demographics ... 122
LIST OF ACRONYMS
ALS Amyotrophic Lateral Sclerosis
ANOVA Analysis of Variance
BCI Brain-Computer Interface
C-BCI Collaborative Brain-Computer Interface
CP Cerebral Palsy
CRT Cathode Ray Tube
CSP Common Spatial Pattern
DOE Degrees of Freedom
ECG Electrocardiography
EEG Electroencephalography
EMG Electromyography
EOG Electrooculography
ERD/ERS Event Related Desynchronization and Synchronization
ERP Event-Related Potential
FFT Fast Fourier Transform
fMRI Functional Magnetic Resonance Imaging
HCI Human-Computer Interaction
LCD Liquid Crystal Display
ITR Information Transfer Rate
LED Light Emitting Diode
MEG Magnetoencephalography
MI Motor Imagery
PET Positron Emission Tomography
RVS Repetitive Visual Stimulus
SCP Slow Cortical Potential
SNR Signal-to-Noise Ratio
SSVEP Steady-State Visual Evoked Potential STFT Short-Time Fourier Transform VDC Volts of Direct Current
1.INTRODUCTION
systems with accuracy levels acceptable for both communication and device control (Allison & Pineda, 2003; Volosyak et al., 2009; Mugler, Ruf, Halder, Bensch & Kübler, 2010).
SSVEP-based BCI, which uses steady-state visual evoked potentials (SSVEPs) as a control signal, is one example of a non-invasive BCI system. Since no initial training is required to use an SSVEP based BCI system, this option provides great advantages over most other BCI systems, such as P300-based BCIs and motor imagery-based BCIs. Currently, the SSVEP based-BCI can provide the fastest and most reliable communication as a non-invasive BCI (Volosyak, 2011; Wang, Gao, Hong, Jia & Gao, 2008; Zhu, Bieger, & Aarts, 2010).
support collaborative work between users with motor disabilities and between users with and without motor disabilities under various task conditions. However, collaborative BCIs (C-BCI) were shown to bring greater benefits to those with motor disabilities (e.g., Poli, 2013). More studies regarding C-BCIs will help to determine how the applications could be extended to real-life situations.
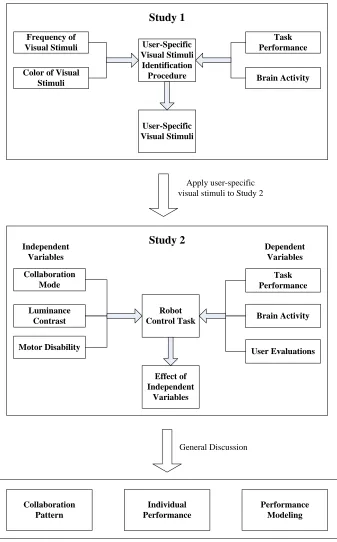
Collaboration Pattern Individual Performance Performance Modeling Apply user-specific
visual stimuli to Study 2
General Discussion Study 2 Independent Variables Dependent Variables Collaboration Mode Luminance Contrast Motor Disability Task Performance Brain Activity User Evaluations Robot Control Task Effect of Independent Variables Study 1 Frequency of Visual Stimuli Color of Visual
Stimuli Brain Activity
Task Performance User-Specific Visual Stimuli Identification Procedure User-Specific Visual Stimuli
The research presented includes two studies (see Fig. 1.1). Study 1 is a fundamental study of SSVEP, in which the user-specific visual stimuli was identified with respect to LED light frequency and color. This study employed two types of dependent variables: (a) task performance (number of detections), and (b) brain activity (i.e., spectral power). Study 2 recruited the same group of participants as in Study 1 and examined the effect of the collaboration mode under the user- specific stimuli condition determined in Study 1. Besides the individual mode, where the participant performed the task by herself/himself, two collaborative modes were provided: (a) Sequential mode: a pair of users took turns performing the task, and (b) Simultaneous mode: a pair of users performed the task at the same time (i.e., brain signals from both users were used to control the BCI). Moreover, the effect of luminance contrast was investigated to validate the real applicability of SSVEP-based BCIs. This study employed several dependent measures, which can be categorized into three types of variables: (a) task performance (accuracy, task completion time, and information transfer rate), (b) brain activity (spectral power) and (c) user subjective evaluations (subjective ratings based on user satisfaction, user fatigue and user preference). Participants with motor disabilities were recruited from the local associations (e.g. North Carolina ALS Association) and community. Age- matched healthy participants were recruited from the local community to investigate the effect of motor disability on BCI performance.
BCI will make it more applicable to real life and more user friendly to those with motor disabilities.
1.1 How Does SSVEP-Based BCI Work? 1.1.1 What Is SSVEP?
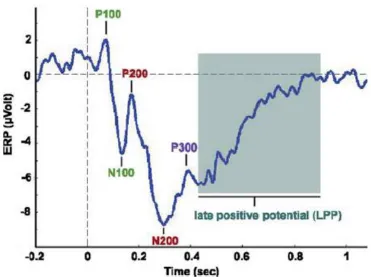
Figure 1.2 Example of ERP components
Figure 1.3 Examples of EEG frequency bands
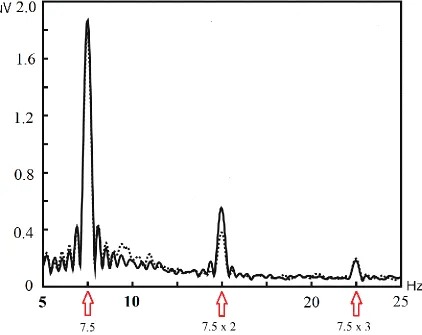
of 7.5 Hz. The peak values appeared in the fundamental frequency (f1 = 7.5 Hz), the second
harmonic (f2 =15 Hz = 7.5 x 2) and the third harmonic (f3 =22.5 Hz = 7.5 x 3).
Figure 1.4 7.5 Hz and its harmonic SSVEPs
1.1.2 SSVEP-Based BCIs
BCIs have been developed utilizing a variety of EEG features. For example, P300 brain waves have been used in spelling tasks (Farewell & Donchin, 1988; Li, Nam, Shadden & Johnson, 2011; Nam, Li & Johnson, 2010) and robot control (Pires, N unes, & Castelo-Branco, 2008). Motor imagery brain waves have been used in wheelchair control and robot control (Xia, Li, Yang, Xiao, Velez & Yang, 2011). SSVEP brain waves have also been used in spelling tasks (Friman, Lüth, Volosyak, & Gräser, 2007) and wheelchair control (Muller, Bastor & Filho, 2013).
Figure 1.5 Timeline of noninvasive BCI for humans
The 1980s and 1990s presented new BCI milestones: the P300 Speller by Farewell and Donchin (1988), an SCP-based BCI by Birbaumer and colleagues (Birbaumer, Ghanayim, Hinterberger, Iversen & Kotchoubey, 1999), an SMR-based BCI by Wolpaw and colleagues (Wolpaw, McFarland & Vaughan, 2000), an ERD/ERS-based BCI by Pfurtscheller and colleagues (Pfurtscheller, Flotzinger & Kalcher, 1993), an SSVEP -based BCI by Calhoun and McMillan (1996), as well as many other devices.
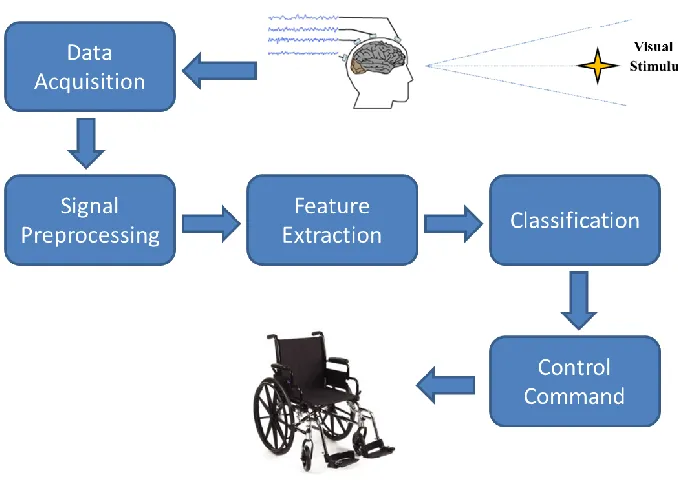
A typical SSVEP BCI system is composed of certain components (see Fig. 1.6): data acquisition, signal preprocessing, feature extraction, classification and control command translation.
Figure 1.6 SSVEP BCI framework
Table 1.1 Summary of SSVEP-based BCI research in chronological order
Study Participant Stimulus Task
Mode
Type Number Age Device Frequency (Hz) Color
Calhoun et al., 1996 Able-bodied 3 --- Fluorescent light 13.25 --- Individual
Cheng & Gao, 1999 Able-bodied 4 (3 male) 22-27 Computer display 6-9 --- Individual Cheng et al., 2001 Able-bodied --- --- Computer display 6.45, 7.23, 8.01,
13.87
Red, green,
yellow ---
Wahnoun et al., 2002 Able-bodied 11 --- Computer display
5, 7.08, 7.727, 8.927, 11.087, 12.14, 12.75, 17,
21.25
White with a small light gray
square in the middle
Individual
Cheng et al., 2002 Able-bodied 13 (11 male)
10-39
(M=24) Computer display 6-14 --- Individual
Beverina et al., 2003 Able-bodied 5 24-32 Computer display 6, 10 Green Individual
Gao et al., 2003 Able-bodied 1 --- LED 6, 6.195, 6.390, …, 15 Green Individual
Wang et al., 2004 Able-bodied 2 --- LED 9-17 --- ---
Lalor et al., 2004 Able-bodied 5 (male) 23-27 Computer display --- White/black Individual Sami & Nielsen, 2004 Able-bodied 8 --- Computer display 8.8, 35 --- Individual Kelly et al., 2004 Able-bodied 15 21-38 Computer display 17, 20 White/black Individual
Piccini et al., 2005 Able-bodied 5 --- LED 6-10 --- Individual
Müller-Putz, et al.,
2005 Able-bodied
9 (female)/5 (male)
25.3±3/23
-37 LED 6, 7, 8, 13 Red Individual
Wang et al., 2005 Able-bodied 13 (8 male) --- LED 21, 23, …, 43 White Individual Lalor et al., 2005 Able-bodied 5 (male) 23-27 Computer display 8.5, 10 White/black Individual Kelly et al., 2005 Able-bodied 10 22-30 Computer display 9.45,10.63,14.17,
17.01 White/black Individual Kelly et al., 2005 Able-bodied 11 21-37 Computer display 10.03,12.04 White/black Individual Kelly et al., 2005 Able-bodied 10 22-30 Computer display 14, 17 White/black Individual Jaganathan et al., 2005 Able-bodied --- --- Computer display 6-15 White/black Individual
Maggi et al., 2006 Able-bodied 5 (3 male) LED 6, 7, 8, 10 Green Individual
Materka & Byczuk,
2006 Able-bodied 1 (male) --- LED
25, 26.5625,
Table 1.1 Continued
Study Participant Stimulus Task
Mode
Type Number Age Device Frequency (Hz) Color
Materka & Byczuk,
2006 Able-bodied 1 (male) --- LED 34-40 --- Individual
Wang et al., 2006 Able-bodied 16 (10 male) 22-42 Computer display 9-17 --- Individual Nielsen et al., 2006 Able-bodied 7 --- Computer display
5, 7.08, 7.73, 8.5, 9.44, 10.63, 12.14, 14.16, 17
--- Individual Trejo et al., 2006 Able-bodied 3 23-35 Computer display 5, 5.625, 6.4, 6.9 White/black Individual Mukesh et al., 2006 Able-bodied 15 23-27,
45 Computer display 6, 7, 12, 13, 14 White/black Individual Lüth et al., 2007 Able-bodied 8 (7 male) 20-35 LED 13, 14, 15, 16, 17 Red Individual
Valbuena et al., 2007 Able-bodied 7 25-35 LED 13, 14, 15, 16 --- Individual
Leow et al., 2007 Able-bodied 5 (3 male) 24-63 LED 14-29 Red Individual
Materka et al., 2007 Able-bodied 5 --- LED 32-40 --- Individual
Touyama & Hirose,
2007 Able-bodied 3 --- Computer display 4.8, 6.86 --- Individual
Touyama & Hirose, 2007
Able-bodied 2 --- Computer display 4.8, 6.86 --- Individual
Scherer et al., 2007 Able-bodied 10 (7 male) 27±5 LED
6.25, 7.25, 8, 13; 11.75, 13, 15.25,
17.25
Red Individual
Lin et al., 2007 Able-bodied 11 --- Computer display 27,29,…,43 --- Individual
Kluge & Hartmann,
2007 Able-bodied 3 M=31 Computer display 10.12 --- Individual
Martinez et al., 2007 Able-bodied 5 --- Computer display 5,6,7,8;12,13.3,15,17 White/black Individual
Jia et al., 2007 Able-bodied 10 --- LED 6, 6.5, 7, …, 19 --- Individual
Friman et al., 2007 Able-bodied 10 20-30 LED 5, 7, 9, 11, 13, 15 --- Individual
Friman et al., 2007 Able-bodied 11 (10 male) 21-58
Table 1.1 Continued
Study Participant Stimulus Task
Mode
Type Number Age Device Frequency (Hz) Color
Molina, 2008 Able-bodied 2 (male) 23, 25 LED 40-50 White Individual
Huang, 2008 Able-bodied 6 (4 male) 26-35 Xe-light 30-50 --- Individual
Bin et al., 2008 Able-bodied 8 --- LED 13, 14, 15, 16, 17,
18 --- Individual
Wu & Yao, 2008 Able-bodied 10 25±3 LED 8.3,10 White Individual
Wu et al., 2008 Able-bodied 10 25±3 LED 4.6,10.8,16.1 White Individual
Müller-Putz et al., 2008 Able-bodied 10 (5 male) 25±2.3 LED 6,7,8,13 Red Individual
Müller-Putz &
Pfurtscheller, 2008 Able-bodied 4 (2 male) 18-29 LED 6,7,8,13 Red Individual
Wang et al., 2008 Able-bodied 1 --- Computer display 10 --- Individual
Ren et al., 2008 Able-bodied 5 male 22-25 Computer display 10 White/black Individual Cecotti & Graeser,
2008 Able-bodied 2 --- Computer display
15.5,16,16.5,17,1
7.5 --- Individual
Wu et al., 2008 Able-bodied 10 25±3 Computer display 4.6,10.8,16.1 White/black Individual Vasquez et al., 2008 Able-bodied 4 --- Computer display
8.8,9.4,11.55,12.5 ,13.65, 15, 16.7,
18.8
White/black Individual Oehler et al., 2008 Able-bodied 4 male --- Computer display 10-15 White/black Individual Martinez et al., 2008 Able-bodied 4 --- Computer display 5,6,7,8;12,13.3,15
,17 White/black Individual
Krusienski & Allison,
2008 Able-bodied 6 (3 male) 18-29 Computer display 6,15 White/black Individual
Allison et al., 2008 Able-bodied 14 (6 male) 18-29
(M=19.7) Computer display 6,15
White/black;gray /white; red/gray;green/gr
ay
Individual
Parini et al., 2009
Able-bodied 7 18-50 LED 6, 7, …, 17 Green Individual
Duchenne muscular dystrophy
Table 1.1 Continued
Study Participant Stimulus Task
Mode
Type Number Age Device Frequency (Hz) Color
Bin et al ., 2009
Able-bodied 12 (10 male) --- Computer display 6.5, 7.5, 8.6, 10,
12, 15 White/black Individual Pfurtscheller et al.,
2010 Able-bodied 6 26.1±2.9 LED 8, 13 --- Individual
Shyu et al., 2010 Able-bodied 7 23-32 LED 21 White Individual
Cecotti et al., 2010 Able-bodied 10 M=27.2 LED 6.66, 7.5, 8.57,
10, 12 --- Individual
Shyu et al., 2010 Able-bodied 7 23-32 LED 21 White Individual
Wang et al., 2010 Able-bodied 5 M=25 LED 9, 11, 13, 15, 17 Blue Individual
Ortner et al., 2011 Able-bodied 7 25±3.4 LED 8, 13 --- Individual
Horki et al., 2011 Able-bodied 7 (4 male) --- LED 8, 13 Red Individual
Allison et al., 2012 Able-bodied 10 --- LED 8, 13 Red Individual
Hwang et al., 2012 Able-bodied 10 --- LED 5, 5.1, 5.2., …,
9.9 --- Individual
Resalat & Setarehdan,
2012 Able-bodied 8 (male) 25±2 LED 15, 20 White Individual
Fermandez-Vargas et
al., 2013 Able-bodied 18 (12 male) 18-59 LED 27, 28, 29, 30 Green Individual
Lim et al., 2013 Able-bodied 11 (9 male) 24-29 LED 7-17 --- Individual
ALS 1 24-29 LED 7-17 --- Individual
Resalat & Setarehdan,
Out of the 73 reviewed papers, for visual stimulation, 32 used computer displays, 39 used LEDs, 1 used a fluorescent light and 1 used an Xe- light. There were two interesting discoveries. Most of the reviewed papers used able-bodied people in the experiments. In fact, there were only two papers that used participants with motor disabilities. It is also important to note that all of the BCIs used in these papers supported only single-user usage and no collaborative BCI paradigms were investigated.
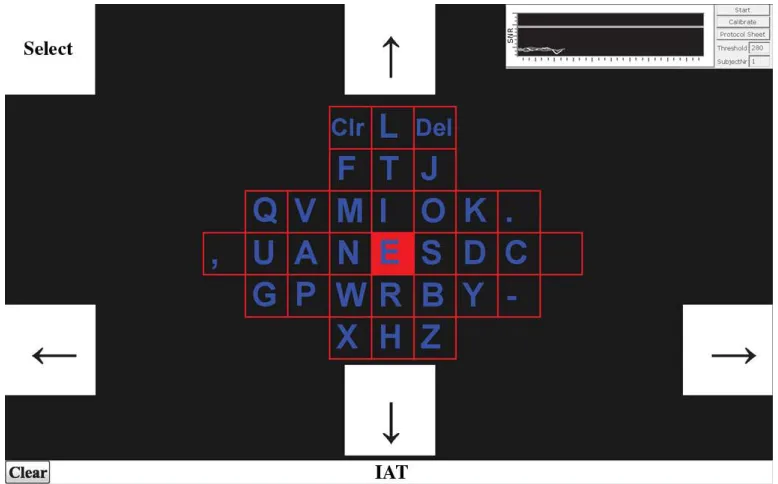
Many SSVEP-based BCI applications have been developed since the 1990s. Applications can primarily be classified into three categories: spelling systems, navigation systems, and control systems.
Figure 1.7 SSVEP BCI spelling system
Allison et al. (2010) investigated the applicability of SSVEP-based BCI with 106 participants in a spelling task. Their results showed that the SSVEP-based BCI can provide effective communication for most participants.
Navigation Systems: Fig.1.8 is an example of an SSVEP BCI (Volosyak, Valbuena,
Figure 1.8 SSVEP BCI navigation system
Control Systems: Fig.1.9 is an example of a SSVEP BCI hand orthosis system in
Figure 1.9 SSVEP BCI hand orthosis system
(2010) developed a binary SSVEP-BCI in which able-bodied participants could achieve average 89% accuracy without gazing. Lim et al. (2013) developed an ‘eyes-closed’ SSVEP-based BCI in which one ALS patient achieved 80% classification accuracy with his eyes closed.
1.1.3 Other BCI Applications
Based on specific EEG features, BCIs can be classified into two categories: BCIs using ERPs (Event-related Potentials) features (i.e., SSVEP, P300 and SCP) and BCIs using cortical oscillations features (i.e., sensorimotor rhythms (SMR) and ERD/ERS) (Wolpaw & Boulay, 2010). Based on the mental strategies used in BCIs, Graimann, Allison & Pfurtscheller (2010) proposed alternative classifications: BCIs based on selective attention and BCIs based on motor imagery. Mental strategy is the experimental strategy the BCI systems use and determines the BCI patterns (EEG features). Therefore, the two classifications are equivalent. In fact, BCIs based on selective attention have almost the same range as BCIs using ERPs, and BCIs based on motor imagery (MI) have the same range as BCIs that utilize cortical oscillations.
Table 1.2 Summary of EEG-base d BCIs
Category Mental Strategy
EEG
Feature Advantage Disadvantage Examples
ERPs based BCI
Selective Attention
P300 1. Reliable across users and sessions;
2. No training;
3. Support fast communication
1. May require users to shift gaze; 2. External stimuli may be annoying to some users
P300 Speller (Farewell & Donchin, 1988)
SSVEP Bremen BCI (Allison et
al., 2010)
MI based BCI
Motor Imagery
SMR
1. Don’t rely on external stimuli
1. Training needed
Cursor control (Wolpaw, McFarland, Neat & Forneris, 1991) ERD/
ERS
Cursor control (Pfurtscheller, Neuper,
Guger, Harkam & Ramoser, 2000)
possible that user performance is dependent upon the type and severity of their motor disabilities.
When users look at a stimulus flickering at a fixed frequency, whether it is an LED light or graphical interface, a visually evoked potential will appear and have the same frequency as the visual stimulus. Due to its simplicity and stability, SSVEP brain waves could be retrieved and used as a control signal in different applications. When multiple stimuli are available, users can control more than one target and therefore accomplish even more complex tasks.
1.2 Limitations of Current BCI Research
Despite these advances, BCI development is still in its infancy stage and more research is needed in order to bring tangible, significant benefits to the world (Ebrahimi, Vesin, & Garcia, 2003; Graimann, Allison & Pfurtscheller, 2010; Lebedeve & N icolelis, 2006; McFarland & Wolpaw, 2011; Wolpaw et al., 2002).
1999). As mentioned in Table 1.2, visual stimuli in SSVEP BCI may annoy users; therefore, optimal visual stimuli should be identified. In parallel, future research should explore human factors in SSVEP BCIs in the context of HCI.
Most researchers typically used able-bodied people as a substitute for people with motor disabilities for experimentation and trials. Sometimes participants with motor disabilities were used but many times they were very limited in number (see Table 1.1). For example, Lim, Hwang, Han, Jung & Im (2013) employed 11 healthy participants and 1 ALS participant to evaluate their “eyes-closed” SSVEP-based BCI – one of the very few SSVEP BCI research studies to employ participants with motor disabilities. Due to the limited participant pool, the conclusions from that study may not be applicable to a larger audience of people with motor disabilities. To effectively develop BCI applications for a broad user-base, an equal sample of participants with motor disabilities, as compared to able-bodied participants, should be employed in the future research.
Additionally, most BCI research has been conducted in unrealistic, quiet environments (Boord, Barriskill, Craig, & Nguyen, 2004; Wolpaw et al., 2002). As a result, these conclusions may not be applicable to real life applications. For example, Nam et al. (2010) showed that users had better performance with certain level of sound than in a quiet condition, because the sound could keep them in a higher level of vigilance. Therefore, a wider array of environmental factors should be considered for future research.
prove to be more beneficial to persons with motor disabilities since C-BCIs can provide an environment closer to real life.
1.3 Research of Collaborative BCI
Very recently, some initial research showed the possibility and potential to develop collaborative BCIs (Eckstein et al., 2012; Poli, Cinel, Matran-Fernandez, Sepulveda, & Stoica, 2013a; Poli, Cinel, Sepulveda, & Stoica, 2013b). Eckstein et al. (2012) has examined the possibility of integrating the brain activity of group members in the decision making process. Their result showed that the aggregated neural activities across brains could increase decision accuracy and take less time than the combined observers’ opinions. Additionally, research by Poli et al. (2013a) showed that collaborative BCIs can produce better task performance than single-user BCIs in decision making tasks and space navigation. However, it should be noted that none of the above research recruited participants w ith motor disabilities. Meanwhile, previous research generally used much simpler tasks (Poli et al., 2013a).
More importantly, the research should provide precious empirical data for future applications. BCI applications developed on the basis of empirical evidence can provide a greatly improved quality of life for people with motor disabilities.
2.LITERATURE REVIEW 2.1 SSVEP Stimuli
There are many determinants that can affect the property of SSVEP stimuli, such as stimulation device, frequency, color, size, shape, luminance contrast, environment, noise, etc.
2.1.1 Stimulus Device
To elicit SSVEPs, a stimulus device, or hardware that emits light, is needed to provide a RVS (repetitive visual stimulus) for users to focus on. Commonly, a stimulus device is either a light source (e.g. LED or Light Emitting Diode, Xe- light, Fluorescent light, etc) or a computer display running a software application. LEDs are commonly utilized because they can be easily manipulated. Software applications have the advantage of ubiquity and flexibility; however, the software applications do require a layer of application programming. An LED stimulus device was used in this study. In particular, frequencies and colors of LEDs were manipulated by a program developed by the BCI Lab at NCSU.
An LED consists of a p-n junction semiconductor diode that emits light when current is applied. An LED is essentially a solid-state device that controls current without heated filaments. When applying 3.6 VDC, an LED can produce 100 milliwatts of power and 30 milliamps of current. Since the entire LED unit is completely embedded in epoxy, there are no loose parts, resulting in a very reliable piece of hardware (The LED Light Inc., 2013).
Bieger, Molina and Aarts (2010) have researched the stimulation methods used in SSVEP-based BCIs. They have reviewed 58 research papers prior to June 2009 and found that 55% of the experiments used computer displays, 41% used LEDs, and the remaining 4% used fluorescent light or Xe- light. Since 2009, a review of 63 research papers yielded that 49% used computer displays, 49% used LEDs, and the remaining 2% used Hexagon light.
Light sources, particularly LEDs, have advantages over computer displays. At first, computer-based stimuli have restrictions in the frequencies that can be achieved due to monitor refresh rates. Technically, only sub-harmonics of the screen refresh rate can be used to create visual evoked potentials (Wahnoun et al., 2002) and frequencies cannot exceed half of the refresh rate of the monitor (Arakawa et al., 1999). Due to the fact that most computer monitors operate at a frequency less than 100 Hz, these restrictions greatly limit the available number of frequencies that can be displayed on a computer monitor. Some new approaches have been proposed to help alleviate these restrictio ns. For example, Zhang and the colleagues (2012) have proposed using sequences of differing frequencies for each target. However, those methods are not mature and require more testing before they become reliable.
Bakardjian, Vallverdu, & Cichocki, 2008), and a system using rectangle stimuli achieved 58 bits per minute with 6 choices (Bin, Gao, Yan, Hong, & Gao, 2009). The median ITR for the SSVEP-based BCIs using LEDs, checkerboards, and squares were 42 bits per minute, 26 bits per minute, and 35.075 bits per minute respectively.
Finally, research indicated that LED flicker evoked significantly larger fundamental frequency amplitude in the SSVEP-based BCIs compared to CRT (cathode-ray tube) and LCD (liquid-crystal display) flickers (Wu, Lai, Xia, Wu, & Yao, 2008). These results suggest that, LED-based SSVEP BCI systems not only result in a higher system performance and greater SSVEP amplitude, but also facilitate the use of significantly more frequencies. Meanwhile, LED lights have relatively low cost than computer displays (Nam, Moore, Choi, Li, & Lee, 2014). For these empirically-proved reasons, this study used LED lights as visual stimuli of the SSVEP BCI.
2.1.2 Frequency of Visual Stimuli
Frequency is one of the most important characteristics of SSVEP stimuli. According to Herrman (2001), stimuli between 1 Hz and 100 Hz can elicit SSVEP responses, but strength of the response may vary at different frequencies with different subjects (Bieger & Garcia-Molina, 2010). Frequency is usually divided into 3 bands: 5-12 Hz (low), 12-25 Hz (medium), and 25-30 Hz (high) based on Regan’s division (Regan, 1989). Regan’s division will be used in this study because of its wide acceptance.
instance, Pastor et al. (2003) studied the SSVEP response at 14 different frequencies (5-60 Hz) and found that the amplitude of the response peaked at 15 Hz and decreased at higher stimulation frequencies (see Fig. 2.1).
Figure 2.1 Effect of visual stimulation frequency on the SSVEP amplitude
long-term SSVEP response was highly non-stationary and frequency-dependent. Volosyak et al. (2011) examined the Bremen-BCI interface and found a significant increase in information transfer rate (ITR) and accuracy when us ing a medium frequency band (13-15 Hz) compared to a high frequency band (34-40 Hz). Moreover, about 97.7% of users were able to use the medium- frequency system while only 65.1% of users could use the high-frequency system. Succinctly, as stimuli high-frequency increases beyond 15 Hz, BCI illiteracy increases.
On the other hand, research has shown that the high frequency band can be beneficial. While Bieger and Garcia-Molina (2010) concluded that high frequency based responses are weaker than the low and medium frequency bands, higher frequency bands are less likely to produce adverse effects, such as epileptic seizures. In their experiment, Wang et al. (2005) concluded that there is no significant difference in the signal-to- noise ratio (SNR) for a high-frequency SSVEP BCI and a low- high-frequency SSVEP BCI. However, the opposite is reported by Volosyak et al. (2011): the SNR for high frequencies is much lower tha n that for medium frequencies. Both experiments indeed support Bieger and Garcia-Molina in that users prefer high- frequency SSVEP BCIs. In addition, Diez et al. (2011) reported high performance for users controlling a moving object with blinking sources of 37, 38, 39, and 40 Hz, all of which are in the high frequency band.
2.1.3 Color of Visual Stimuli
Color can affect user mood and SSVEP response (Gerard, 1957; Regan, 1966). Regan (1989) showed that the human eye is less sensitive to lights from the red and blue spectrum and is optimally sensitive to the green spectrum at 510 nm (Regan, 1989). Studies do suggest that white color stimuli produce the best performance, followed closely by green colors, and then red and blue (Bieger & Garcia-Molina, 2010). However, user preference indicates blue over red, red over green, and green over white.
It has been proven that colors do vary in their strength o f response and user preference at differing frequencies (Regan, 1966). Additionally, colors interact with the pattern and spatial frequency of the stimulus (Komatsu & Ideura, 1993; Regan, 1989). One study found that a green stimulus results in the strongest SSVEP between 20-40 Hz whereas a red stimulus evokes the strongest potential between 30-50 Hz (Byczuk et al., 2010). While the ranges differ, there is no significant difference in the strength of the signal. Zhu et al.’s (2010) review reports that green, red, gray, black, and white have been used in SSVEP BCIs, yet no single color is rated “better” than another. It may be a parameter that depends solely on user preference.
In summary, supporting research exists in regards to color with able-bodied participants. However, little research has been conducted with people with motor disabilities. Moreover, the interactions of color with other factors have not been well investigated.
2.1.4 Luminance Contrast
Luminance measures the amount of light emitted from a light source. Luminance contrast describes the relative brightness of the light source in comparison to another light source. Luminance contrast is an extremely important aspect of SSVEP-based BCI design. Research shows that both ambient luminance and contrast can affect the visual acuity of older adults (Elton, Johnson, N icolle & Clift, 2013). Research shows that the amplitude of the evoked potentials is positively correlated to the logarithm of contrast (Campbell & Maffei, 1970). Spekreijse (1966) found that brightness and modulation depth can increase SSVEP amplitudes.
Nam, Li, & Johnson (2010) have shown a significant effect for interface color contrast on most P300 measures for able-bodied participants. In the study, intensification and text color contrast are controlled. Participants had significantly higher accuracy, larger information transfer rate (ITR), larger amplitude, and shorter latency in high interface color contrast as compared to low interface color contrast.
the results differed from Zemon & Gordon’s findings in that bright stimuli elicited larger responses over dark stimuli. It should be noted that both studies used computer monitors to display the visual stimulus rather than LED lights.
In conclusion, insufficient research has been conducted regarding the effect of luminance contrast on user performance within SSVEP-based BCIs, particularly with the use of LED lights as visual stimuli. This study investigated the effect of luminance contrast on user performance in an SSVEP-based collaborative BCI system. This study expected that participants would have better performance in high luminance contrast than low luminance contrast.
2.2 Motor Disability
They concluded that there was almost no difference betwe en the disabled and healthy subjects.
Münβinger et al. (2010) examined the P300-Brain Painting with 3 ALS patients and 10 healthy participants. Their result showed that healthy participants had higher accuracy than ALS patients in both copy-spelling (91.81% vs. 78.95%) and copy-painting (80.53% vs. 70.18%). Moreover, healthy participants also had greater ITR than ALS patients in both copy-spelling (8.57 bits/min vs. 5.89 bits/min) and copy-painting (6.03 bits/min vs. 4.41 bits/min). Li and his colleagues (2011) have examined the effects of interface type and screen size of a P300 Speller with 10 participants with severe motor disabilities and 10 able-bodies participants as control group. Their results showed that the control group had significantly higher accuracy (79.7%) than those with motor disabilities (28.7%). The control group also had significantly greater ITR (1.281bits/min) than those with motor disabilities (0.326 bits/min).
Based on the literature review, this study expected that healthy participants would have better performance than ALS patients.
2.3 SSVEP-Based Collaborative BCIs 2.3.1 Group versus Individual
According to Kozlowski & Bell (2003), teams and groups: (a) are composed of two or more individuals, (b) exist to perform organizationally relevant tasks, (c) share one or more common goals, (d) interact socially, (e) exhibit task interdependencies (i.e., workflow, goals, outcomes), (f) maintain and manage boundaries, and (g) are embedded in an organizational context that sets boundaries, constrains the team, and influences exchanges with other units in the broader entity. The comparison between group and individual is a fundamental and enduring issue (Laughlin et al., 2002). A large amount of research has been conducted to compare the group performance and individual performance (Brown, 2000; Davis, 1973; Davis, 1992; Hill, 1982). Based on the conclusions, they can be classified into 3 different views (see Table 2.1).
Table 2.1 Summary of viewpoi nts of “Group vs. Indivi dual”
Viewpoint Content Interpretation
1
Group outperforms
individuals
Benefit from pooling information and opportunities from group members.
Groups recognize and reject errors, accept correct responses by individual members.
Errors could be cancelled statistically.
2
Individuals outperform groups.
Groups make more errors than individuals in decision tasks.
Bias at the individual level could be exacerbated at the group level.
3 It depends.
(1) Groups outperform individuals.
Most studies support the idea that groups perform better than the average individual on a range of problem-solving tasks (Baron, Kerr, & Miller, 1992; Brown, 2000; Davis, 1992; Forsyth, 1999; Hill, 1982; Hinsz, Tindale, & Vollrath, 1997; Laughlin, VanderStoep, & Hollingshead, 1991; Levine & Moreland, 1998; Stasser & Dietz-Uhler, 2001; Wutchy, Jones, & Uzzi, 2007). Hill (1982) found that group performance was often quantitatively superior to the performance of individuals and groups were often qualitatively superior in complex problem solving. Hastie (1986) found that groups had significantly better performance than individuals in problem solving. Laughlin et al. (1991) compared groups with an equivalent number of individuals and found that group performance increased over individual performance with the demonstrability of the problem solutions. For example, groups perform at the level of the best group member on highly demonstrable mathematical, insight, and information-rich rule induction problems. On the other hand, groups perform at the level of the average group member on weakly demonstrable estimations of quantities.
collaborative BCIs also supports this idea (Eckstein et al., 2012; Poli et al., 2013a; Poli et al., 2013b; Stoica, 2012; Wang, Jung & 2011; Yuan et al., 2012).
There are many explanations to support the claim that groups outperform individuals. Traditional theoretical explanations emphasized processes by which groups recognize and reject errors and processes by which groups recognize and accept correct responses proposed by one or more members (Laughlin, 2002). Group s could benefit from the pooling of information and opportunities from one group member to correct another member’s errors. Meanwhile, the errors could be cancelled statistically in the computation of average member performance (Hill, 1982). Hinsz et al. (1997) emphasized groups as collective information processors who can effectively process more information than the average individual, especially on complex problems. Examples in real life include juries, multiple-judge courts, and boards of directors and committees, which all rely on collective judgment rather than individual judgment.
(2) Individuals outperform groups.
which cognitive heuristics or inappropriate decision strategies were common at individual level. Kerr & Tindale (2011) argued that collective judgment could be inferior to individual judgment, because “too many cooks spoil the broth sometimes”. They thought that “biases at the individual level could be exacerbated at the group level without any of the members being aware of the problem”. One possible reason could be that the shared belief systems that help groups to resolve conflicts are not optimal (Tindale, 1993).
However, after examining the previously mentioned studies one will find that above papers only found some conditions, in which individuals performed better than groups. In most other conditions, groups still performed better than individuals. For example, when the witness accuracy was lower than 80% (e.g., 50%, 40%, and 20%), groups performed better than individuals (Tindale, 1993). Moreover, most research in favor of this idea is based on decision making task.
(3) It depends.
Some studies support the idea that there is no simple answer. Kerr et al. (1996) reviewed the relevant empirical literatures and argued that there is no clear or general pattern and there is no simple answer to the question. They found that the relative magnitude of individual and group bias depends on several factors, such as group size, magnitude of individual bias, initial individual judgment, and group-judgment process. However, their conclusion is based on decision making tasks.
Jundt, 2005). Meanwhile, groups differ on a number of attributes, such as group size, group composition, and group structure (Wildman, Thayer, Rosen, Salas, Mathieu, & Rayne, 2012). Research has shown these differences could be moderators of group performance (Horwitz, 2005). For instance, task type could moderate group performances. Stewart & Barrick (2000) found significant group performance differences between conceptual and behavioral tasks.
In summary, the most prevalent idea is that groups outperform individuals. However, groups might perform worse than individuals in some cases when individual bias is exacerbated at the group level. This happens most often in decision making tasks. The author in this research agreed with the first viewpoint (Groups outperforms ind ividuals), because it has more solid theoretical and empirical support and the interpretation is more reasonable.
Although many studies have been conducted to compare group s and individuals, very few are in the background of brain-computer interaction and almost no research employed participants with motor disabilities. To better understand the group work of those with motor disabilities when using BCI together, more research is needed to build the theoretical framework and get empirical data to evaluate the process.
2.3.2 Collaborative BCIs
explored the integration of BCI in normal life (Wang et al., 2011; Wolpaw et al., 2002), especially to support interactive work such as information exchange and collaboration with other people. New BCI applications have recently been validated, such as control of a robotic arm (Chapin, Moxon, Markowitz, N icolelis, 1999), neural prosthesis (Muller-Putz & Pfurtscheller, 2008; Schwartz, Cui, Weber & Moran, 2006), mobile humanoid robot (Bell, Shenoy, Chalodhorn, Rao et al., 2008), and smart home (Edlinger, Holzner, Guger, Groenegress & Slater, 2009). While there is a wealth of BCI research and development related to and supporting single- user tasks, little emphasis is given to the value of BCI-supported collaborative work of people who have a motor disability. Moreover, most existing BCIs are still single-user applications (or individual BCIs), which do not meet the needs of users with motor disabilities who want to work together (see Table 1.1).
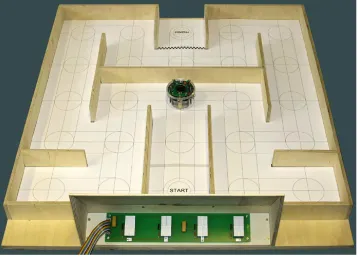
To empirically examine these new research questions, we developed a C-BCI for control – Brainbot, which allows participants to jointly move a ball.
Compared to individual BCIs, collaborative BCI system design and evaluation is more complex and requires multiple components to be integrated. Challenges exist in locating and recruiting multiple users with motor disabilities to evaluate collaborative BCIs. It is intrinsic that collaborative BCIs, compared to individual BCIs, can provide greater benefit to those with motor disabilities.
Working together and collaboration is common and natural for people and can lead to faster task completion, improved work quality, and shared insight, perspective, and expertise especially for a complex task (Heer, Ham, Carpendale, Weaver, & Isenberg, 2008). Collaboration can foster the sharing of knowledge, ideas, and skills, and plays an important role in areas of art, academia, business, and scientific research (Isenberg, 2007; Isenberg & Carpendale, 2007). Research has also indicated that group decisions are superior to individual decisions in many different aspects (Davis, 1973; Ker r, MaCcoun, & Kramer, 1996; Kerr & Tindale, 2004; Laughlin, Bonner & Miner, 2002). Davis (1973) argued that, “In very general terms, the usual finding is that groups are indeed superior on most criteria when directly compared with individuals”.
Based on the review in part 2.3.1, this study expected that participants would have better performance in collaborative BCI than in individual BCI.
2.3.3 Necessity of Research in Collaborative BCI
able to perform tasks with other people as a team using only their brain activity. However, there has been a general lack of understanding regarding how BCIs should support collaborative work between users with motor disability and between users with and without motor disabilities under various task conditions. Simply placing people in groups and assigning them tasks in a BCI system does not guarantee engagement in effective collaborative work.
Research has shown that BCI can help people with severe motor disabilities to accomplish control and communication by using only brain waves (Wolpaw et al., 2002). A variety of BCI-based applications have been developed, such as spelling devices (Farewell & Donchin, 1988), wheelchair control (Muller et al., 2011), and smart home control (Edlinger et al., 2009), etc. Research has also shown that both able-bodied users and people with severe motor disabilities can use BCI systems with accuracy levels acceptable for communication and control (Allison & Pineda, 2003). BCI systems have been commercialized since the 1980s. For example, Neural Signals was founded in 1987 by Philip Kennedy to develop BICs that allow paralyzed patients to communicate with the outside world and control external devices (http://www.neuralsignals.com/nsidnn/). Another company, g.tec even introduced the first commercially available BCI system (intendiX) in 2012 for home use which can be used to control computer games and apps (http://www.intendix.com/). There are also other BCI products on the market from Sony, NeuroSky, OCZ Technology, etc.
it is time to move into the collaborative BCIs, in which multiple users are connected to a BCI system and help each other in carrying out a task (Poli, 2013). Some initial research has also been conducted showing the possibility and potential to develop co llaborative BCIs (Eckstein et al., 2012; Poli et al., 2013a; Poli et al., 2013b; Stoica, 2012; Wang, Jung & 2011; Yuan et al., 2012). Wang & Jung (2011) have examined the collaborative BCI performance in a task of movement planning. In their system, an individual BCI system solves the classification task first, and then a classifier would integrate the individual result. Their result showed that collaborative BCI setups could result in better overall performance than the single user BCI system. Eckstein et al. (2012) has examined the possibility of integrating the brain activity of group members in the decision making process. Their results showed that the combined neural activities could lead to decisions as accurate as the combined behavioral activities in less time. Additionally, research by Poli et al. (2013b) showed that collaborative BCIs can produce better task performance than single-user BCIs in a visual matching task. In another study, Poli and his colleagues (2013a) investigated the collaborative BCI in space navigation task. They found that collaborative BCIs produced significantly superior trajectories than single user BCI in a space navigation task. However, it should be noted that all of the aforementioned studies employed able-bodied participants. Also, previous research generally used much simpler tasks and users were not directly controlling any external equipment (Poli et al., 2013a). Therefore, further research is needed to investigate the collaborative behavior of people with motor disabilities in more complex tasks (e.g., robot control).
systems (Guger et al., 2012). Secondly, research has shown that SSVEP-based BCI can provide the fastest and most reliable communication as a non- invasive BCI (Volosyak, 2011). For example, SSVEP-based BCI can reach a higher information transfer rate (ITR) than other BCIs (Bin, 2009; Volosyak, 2011). ITR is used to assess the performance of BCI and was reported in the majority of BCI studies (Volosyak, 2011). Finally, general design solutions exist for SSVEP. For example, LED is preferred to provide visual stimuli and low to medium frequency is generally used (Zhu et al., 2010). Therefore, SSVEP-based BCI is a good test bed for research relating to collaborative BCI.
This study investigated collaboration of people with motor disabilities as a team within a collaborative BCI. This research is of great significance due to its potential to yield fundamental knowledge of BCI-supported cooperative work, understanding of the support needed for interaction in BCI technology supported group activities, and design considerations for collaborative BCIs.
2.3.4 Collaboration Mode
Collaboration mode defines how group members work together to perform the task. In this study, participants focused on their user-specific visual stimuli and controlled the robot either alone or as a group. More specifically, collaboration mode defines the operation sequence of the task between the two participants. It is very similar to the Task Interdependence in the literatures (Bell & Kozlowski, 2002; Cohen & Bailey, 1997;
dependencies and interconnections between group members and is regarded as one of the core team characteristics (Wildman et al., 2012).
According to Saavedra et al., (1993), “task interdependence is the degree to which group members must rely on one another to perform their tasks effectively”. The task interdependence could be classified into four levels: pooled, seq uential, reciprocal and intensive (or team). In pooled interdependence, each member makes his/her contribution to the group output without the need for any direct interaction with any other group member(s). Each group member has a similar role and completes the whole task. It is an independent work flow. In sequential interdependence, work is completed like an assembly line: one group member must act before another can act. Good group performance requires that each step should be performed successfully and in the prescribed order. It is a one-way work flow. In reciprocal interdependence, group members perform different parts of the task in a flexible order. One group member’s output is another group member’s input and vice versa. It is a two-way work flow. In intense (or team) interdependence, the group members work jointly to complete the group task. It is a simultaneous workflow (Saavedra et al., 1993; Wildman et al., 2012). As task interdependence increases from pooled to intense, more collaborations are needed to link the group members.
interdependence moderated the relationship between collective efficacy and group performance. The relationship between collective efficacy and group performance was stronger in groups with higher interdependence. Horwitz (2005) also suggested that task interdependence moderated the relationship between team diversity and team performance. The relationship is stronger for teams working on high interdependent tasks than teams working on low interdependent tasks.
idea was employed in the current research. A comparison between each participant’s output and the target would be conducted each time so that the best output could be chosen.
Although some studies have been conducted on task interdependence, which is similar to the collaboration mode in this study, very few are in the background of brain-computer interaction (BCI) and no participants with motor disabilities have been recruited. As such, more research is needed to investigate the task performance and user behavior of collaborative BCI in various collaboration modes. These efforts could ultimately improve the usability of collaborative BCI and meet the requirement of group work for those with motor disabilities.
2.4 Limitation of Previous Research
Several challenges exist in establishing a sufficient sample of people with motor disabilities. Primarily, it is often times difficult to locate participants with motor disabilities. Generally, people with motor disabilities may not live independently and utilize caretakers for their general wellbeing; therefore, the process of contacting such individuals is very t ime consuming and inefficient. Moreover, it is difficult for people with motor disabilities to travel to a place of research, regardless of the special access available. For the researcher, it can be challenging to conduct an experiment with participants with motor disabilities. For example, EEG gel is required in a BCI experiment to acquire high quality brain signals. However, this is highly inconvenient for participants with motor disabilities because the participants are unable to wash their hair by themselves after the experiment. Moreover, some people with motor disabilities cannot control their muscle movement very well and have difficulty visually focusing on objects for long periods of time – a critical requirement for BCI application participation. In a typical BCI experiment, participants are asked to focus on the visual stimuli and move as little as possible in order to reduce the noise and interference.
prove to be more beneficial to persons with motor disabilities since C-BCIs can provide an environment closer to real life.
This research attempted to employ those with motor disabilities who can get better benefits from use of BCI and evaluate their collaborative behavior. The study should provide significant insight for future BCI research.
2.5 Research Hypotheses 2.5.1 Study 1
Study 1 was a fundamental study of SSVEP, in which user-specific visual stimuli were identified in regards to the LED light frequency and color based on task performance and brain activity. For example, if participant A’s user-specific visual stimulus was 10 Hz and in white color, then 10 Hz white LED light would be used in Study 2 for participant A.
Study 1
Frequency of Visual Stimuli
Color of Visual
Stimuli Brain Activity
Task Performance User-Specific
Visual Stimuli Identification
Procedure
User-Specific Visual Stimuli
2.5.2 Study 2
Under the user-specific visual stimuli determined in Study 1 and with the same group of participants, Study 2 answered the following questions:
What is the effect of collaboration mode on task performance and brain activity?
What is the effect of luminance contrast on task performance and brain activity?
What is the effect of motor disability on task performance and brain activity?
Study 2
Independent Variables
Dependent Variables
Collaboration Mode
Luminance Contrast
Motor Disability
Task Performance
Brain Activity
User Evaluations Robot
Control Task
Effect of Independent
Variables
Figure 2.3 Study 2 framework
Based on the literature review and the uniqueness of collaborative BCI, the following hypotheses were made.
Hypotheses:
H1a. Group accuracy will not be significantly different from the average individual.
H1b. Group completion time will not be significantly different from the average individual.
H1c. Group ITR will not be significantly different from the average individual.
H2: SSVEP response (spectral power) in collaborative modes will not be significantly different from individual mode.
H3: Task performance in high luminance contrast will not be significantly different from low luminance contrast.
H3a. Accuracy in high luminance contrast will not be significantly different from low luminance contrast.
H3b. ITR in high luminance contrast will not be significantly different from low luminance contrast.
H3c. Completion time in high luminance contrast will not be significantly different from low luminance contrast.
H4: SSVEP response (spectral power) in high luminance contrast will not be significantly different from low luminance contrast.
H5: Task performance (accuracy, completion time, ITR) will not be significantly different between ALS participants and able-bodied participants.
H5a. Accuracy will not be significantly different between ALS participants and able-bodied participants.
H5c. ITR will not be significantly different between ALS participants and able-bodied participants.