Exploring the Energy-Time Tradeoff in High-Performance Computing
Feng Pan Vincent W. Freeh Daniel M. Smith
Department of Computer Science, North Carolina
State University, Raleigh, NC 27695–7534
{
fpan2,vwfreeh,dmsmith2
}
@unity.ncsu.edu
Abstract
High-performance computing is and has always been perfor-mance oriented. However, a consequence of the push towards maximum performance is increased energy consumption, es-pecially at supercomputing centers. Moreover, as peak per-formance is rarely attained, some of this energy consumption results in little or no performance gain. In addition, large en-ergy consumption costs the government a significant amount of money and wastes natural resources.
This paper investigates the tradeoff between energy and performance. Through the use of processors that support fre-quency and voltage scaling, we measured the performance and energy consumption of programs from three popular bench-mark sets. We took multiple measurements for each program using different frequency and voltage settings. Results show that for many programs, a significant decrease in energy is possible with a small increase in time. We believe that this justifies further investigation into parallel HPC (e.g., MPI) ap-plications.
1 Introduction
High-performance computing (HPC) tends to push perfor-mance at all costs. Unfortunately, the “last drop” of per-formance tends to be the most expensive. For example, the last 10% increase in performance requires a disproportionally large amount of resources. The current policy at most of the nation’s supercomputing centers, which are dedicated to the execution of large-scale scientific applications, appears to be “performance at all costs.” Unfortunately, these centers sume a large amount of energy. This unchecked energy con-sumption costs the government a significant amount of money and wastes natural resources. Moreover, it is unlikely that su-percomputing centers can continue limitless consumption of resources. In particular, energy consumption—and the resul-tant heat dissipation—is becoming an imporresul-tant limiting fac-tor.
Large energy consumption at supercomputing centers might be acceptable ifallenergy were used profitably. How-ever, architectural trends are such that achieving peak per-formance is becoming more difficult. While modern proces-sors can issue multiple instructions in a single cycle, the av-erage number issued is much lower than the the maximum. For example, on a 3-issue Pentium 4 with Hyper-Threading
Technology, the average number of operations retired on the SPEC CPU2000 benchmarks is less than one [RF04, TT03]. In general, sustained performance is much less than peak per-formance. This is despite the large effort aimed at improv-ing performance on high-performance architectures, includimprov-ing techniques such as instruction scheduling, memory access re-ordering, prefetching, and simultaneous multithreading.
This paper examines potential energy savings in HPC ap-plications. We observe that if processor efficiency is poor, then processors, while running at peak speed and consuming max-imum energy, must not be the bottleneck resource. For exam-ple, if the memory subsystem cannot supply data fast enough, the processor will be throttled by it. In such a case, a slower processor may achieve similar performance, which means that the extra energy consumed by a faster processor is wasted. Consequently, energy can be saved without a significant per-formance degradation.
Our eventual goal is to save energy in parallel HPC pro-grams. As a first step, this paper determines the tradeoff be-tween energy and time in sequential HPC programs. It also motivates the energy saving potential in parallel HPC applica-tions.
1.1 Low-Energy Supercomputing
Energy-aware computing has flourished over the last decade in many areas, especially mobile devices. However, as ex-plained above, the HPC community has vastly different goals. Because computational scientists are using HPC to gain max-imum performance, many will likely resist any mechanism that decreases performance (i.e., increases time to comple-tion). However, we believe there are two primary reasons why HPC programmers will reduce performance to save energy. First, we believe that supercomputing centers are not immune to economic pressures. Therefore, the large and growing en-ergy consumption of current clusters will eventually come to bear on its users. This may manifest itself in programmers utilizing lower-energy machines such as BlueGene/L [Adi02] or Green Destiny [WWF02] (which is a cluster of Transmeta processors). Such machines have better performance per unit energy than a conventional machine. However, they also offer significantly lower performance.
that a slight performance degradation to save a good percent-age of energy is possible—and may be acceptable to compu-tational scientists. In particular, in some applications it is pos-sible to save energy with virtually no performance loss (e.g.,
mcf andfacerecfrom the SPEC benchmark set).
1.2 Our Approach
This paper investigates the tradeoff between energy and per-formance (execution time). Processors are now available that support frequency and voltage scaling, providing multiple op-erating points. These operating points offer different levels of performance and energy consumption. Processor perfor-mance is roughly proportional to clock speed or frequency,i.e.,
performance ∝f. On the other hand, power consumption is
roughly proportional to frequency times voltage squared,i.e.,
power ∝f V2. Therefore,energy efficiency, (i.e.,instructions
per joule) increases as frequencyandvoltage decrease. Us-ing a processor with both frequency and voltage scalUs-ing, we evaluate the tradeoff between energy and time by executing a program at several different operating points, each with a dif-ferent energy efficiency.
Towards this goal, we analyzed the NAS and SPEC suites to determine the relationship between voltage and frequency settings and execution time. Our results show that
approx-imately 94% of our tests have what we call anenergy-time
tradeoff, meaning that a decrease in energy is possible but it comes at the cost of increased time. In the other programs, the highest operating point consumes the least energy and ex-ecutes in the fastest time. Not every energy-time tradeoff is desirable, as some offer little energy savings and large time penalties. However, approximately half of these tests show a savings that is equal to or better than the penalty (e.g., 10% less energy and 10% more time), and some are much better than that.
Because the case for power savings in desktop and clus-ter compuclus-ters has not been made, scalable microprocessors are essentially available only in portable computers. Conse-quently, our test machines are laptop computers. However, this paper presents the first part of a case for power savings in high-performance computing centers. We expect that fre-quency and voltage scaling soon will become common in desk-top machines.
The rest of this paper is organized as follows. Section 2 describes related work, and Section 3 provides details on our experimental methodology. Next, Section 4 gives results of performance measurements. Finally, Section 5 summarizes and describes future work.
2 Related Work
There has been a voluminous amount of research performed in the general area of energy management. In this section we describe some of the closely related research. We divide the related work into two categories: approaches for whole sys-tems and for specific devices.
2.1 Whole System Approaches
Many have worked on saving energy in the entire system. This subsection details some of these projects.
Operating System Related ECOSystem [ZELV03] at-tempts to implement a power management system without the need to rewrite application software. The goal is to achieve a user specified battery lifetime. An energy accounting model
is implemented, called thecurrentcy model. The currentcy
model attempts to attribute energy usage to individual applica-tions, as well as to specific components of the machine. Each application is allocated a certain amount of currentcy, which corresponds to the total energy it is allowed to consume in each epoch. The case for a closer relationship between the operating system system and power management is further explored by Vahdat et al. [VLE00, Ell99]. This includes a case for treating energy as a first class resource in operating systems. Perhaps the best endorsement of operating system controlled power consumption comes from the ACPI (Advanced Configuration and Power Interface) standard [CCC+00]. It is an evolution of
several existing methods including BIOS power management, the APM (Advanced Power Management) API, and a smart battery interface.
In general, the goal of the OS is to conserve energy for the entire set of processes. Our approach differs in that we are concerned with saving energy in asingleparallel program.
Performance Counters There has also been significant ef-fort put into software architectures that facilitate power man-agement. The Observer architecture implements a monitor-ing and kernel instrumentation package as an extension to Linux [BBM98]. The main idea here is to design a system that collects information that is relevant to making power manage-ment decisions. Another project uses the hardware counters of the microprocessor to do energy accounting on individual processes [Bel00]. The Castle project uses hardware counters to estimate power consumption [JM01]. Finally, one can use program counter techniques to determine when to transition the disk to a lower energy level [GHL04].
Work on performance counter approaches are complemen-tary to our approach. In particular, we may be able to use per-formance counters to determine where to transition to lower energy modes.
Application Related Flinn and Satyanarayanan [FS99b, FS99a] show that a collaborative relationship between the op-erating system and applications can yield significant power savings. They attempt to extend the lifetime of the battery to some user-specified goal. The basis for this work is a tool called PowerScope, which maps energy consumption to spe-cific components. It analyzes spespe-cific processes and functions and uses statistical sampling to expose which components are consuming energy. This information is then used to direct pro-gram activity towards reaching an energy consumption goal by extending the Odyssey platform [NSN+97] to support energy
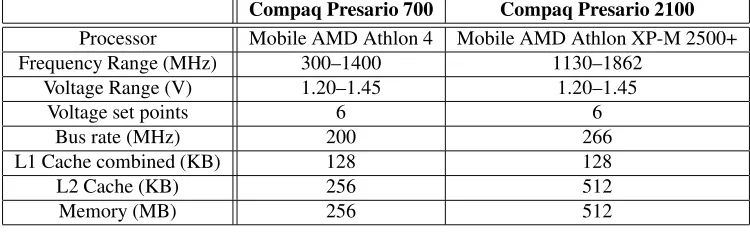
Compaq Presario 700 Compaq Presario 2100
Processor Mobile AMD Athlon 4 Mobile AMD Athlon XP-M 2500+
Frequency Range (MHz) 300–1400 1130–1862
Voltage Range (V) 1.20–1.45 1.20–1.45
Voltage set points 6 6
Bus rate (MHz) 200 266
L1 Cache combined (KB) 128 128
L2 Cache (KB) 256 512
Memory (MB) 256 512
Table 1: Configuration of test machines.
Like performance counter approaches, application-related approaches are complementary to our approach. In the future, we will likely allow the application to explicitly transition be-tween different energy modes.
Architecture Related There are a few high-performance computing clusters that are designed with energy in mind. One is BlueGene/L [Adi02], which uses a “system on a chip” to re-duce energy. Another is Green Destiny [WWF02], which uses low-power Transmeta nodes.
This approach is sacrifices performance in order to save energy by using less powerful machines. The approach we advocate is to start with powerful machines and find regions in programs to reduce energy.
Compiler Directed Hsu et al. [HK03] propose a compiler-directed algorithm to determine the appropriate operating points for memory-bound portions of the program. Like our approach, this uses physical power measurements are used in-stead of simulation.
2.2 Specific Device Approaches
Many have worked on saving energy in different devices. This subsection details some of these projects.
Processor Many modern processor architectures allow dif-ferent frequency/voltage settings. This work developed into dynamic voltage scaling (DVS) [FRM01, Gru01, PBB98, PLS01, IKH01], which has come to mean the simultaneous changing of clock speed and voltage to reduce power con-sumption. DVS takes advantage of the fact that peak pro-cessing power is not always necessary to adequately service
the average system load. Typically, DVS optimizes the
en-ergy×delay product. This creates a system that more effi-ciently uses energy, but is still powerful and responsive.
In this paper, we investigate the relationship between fre-quency/voltage and execution time. DVS techniques are com-plementary, and in fact we will likely utilize them in our future work.
Disk Disks consume large amounts of energy on some
ar-chitectures. Many have studied disk spindown to save energy
(e.g., [HLS96, DKB95, Wil92, BAD+92, LKHA94]). In
gen-eral, the idea is to determine when there is a large time period in which there are no disk requests and transition to a lower energy level. There has also been work in creating burstiness to save energy consumed by disks [PS03].
Memory and Network In some architectures, individual
memory banks can be powered down [DSK+02, LFZE00].
The idea is to potentially place data intelligently in banks so that some banks will not be accessed. In some devices the network card has multiple energy states. One way to save energy is to use the energy-saving mechanisms defined by 802.11b [Com99]. One improvement to 802.11b is the Bounded Slowdown Protocol [KB02], which uses minimal en-ergy given a desired maximum increase in round trip time. In addition, Yan et al. [YKW+04] leverage TCP to save energy
in large file downloads. Finally, Kravets investigated power-aware mechanisms for end-to-end communication in wireless networks [KSC99].
Energy consumed by memory banks and network cards is important primarily in mobile devices. In desktop or cluster processors, memory energy consumption is relatively small. Hence, this work is orthogonal to ours.
3 Methodology
This section describes the experimental methodology. It first describes the details of the test machines, and then explains the techniques used to collect data. Tests were conducted on two Compaq Presario laptop computers equipped with AMD Mo-bile Athlon processors, which support frequency and voltage scaling. Table 1 displays some details of the test machines; we refer to the slower one as “old” and the faster one as “new.” There are many more frequency settings than voltage settings. Frequency scaling alone scales performance and energy equiv-alently. Consequently, there is an increase in energy efficiency (e.g., instructions per joule) only when both frequency and voltage are scaled. Therefore, for the purposes of testing, the interesting operating points are those where both frequency and voltage change. When there are several frequencies pos-sible for each voltage setting, tests use the highest frequency because it provides the greatest performance.
dif-fer in the memory subsystem. The old laptop bus operates at 200 MHz, whereas the new laptop operates at 266 MHz and uses double data rate (DDR) memory. The consequence of this is that the old laptop has a maximum memory bandwidth of approximately 430 MB/s, established by thestream bench-mark [McC]. The new laptop achieves 40% greater throughput of 600 MB/s. We tested the memory bandwidth at each oper-ating point and there is not a significant difference—less than 5% from highest to lowest.
The machines were configured with Linux 2.6. The ad-vanced configuration and power interface (ACPI) was config-ured and used extensively. In particular, ACPI provides in-formation about the battery state. Most useful for these ex-periments is information about the remaining battery capacity. Additionally, thecpufreqkernel module provides an interface to control the frequency-voltage setting. To set the operating point, one writes a string representation of the desired fre-quency in MHz to a file in thesysfilesystem. For example, the following command sets the operating point to 1000 MHz:
echo "1000" >
/sys/devices/system/cpu/cpu0/cpufreq
Although there may be several frequencies for a particular voltage setting, there is only one voltage for any frequency.
All the tests were run using battery power in order to use the power consumption information provided through the ACPI interface (which is not available when operating on A/C power). All tests were begun with a fully-charged battery to eliminate any discrepancies that may be caused by a non-linear battery discharge rate. The ACPI implementation in the old laptop reports the battery capacity in milliwatt-hours. The new laptop reports two values, one in millivolts and the other in milliamp-hours; we converted these into energy. ACPI mea-surements are relatively coarse-grain. Tests lasting less than two minutes have highly varying results. Therefore, most tests run for at least 10 minutes and usually more.
Both laptops uses lithium-ion (LiOn) batteries. Such bat-teries have extremely strict specific power delivery and charg-ing characteristics, such that these phases must be closely monitored and tightly controlled [Pana]. For example, LiOn cells exhibit a flat voltage decay, followed by a steep drop at the end of the discharge cycle; cells allowed to “fall off” this drop can be damaged. Each multi-cell battery pack contains a controller IC, responsible for monitoring charge rates, voltage levels, and cell temperatures [Panb]. In an ACPI-compatible battery pack, this IC maintains a serial communication chan-nel to the system board in order to transmit the aforementioned values.
Testing must be done while drawing power from the bat-tery, and we wish to begin every test with a full battery. There-fore, we must recharge the battery after every test. In order to automate this testing, we built asoftpower switch. The laptop power supply plug is inserted into the switch and the lead from the switch goes to the laptop. The switch is connected to the parallel or serial port of the laptop. A write to the port will turn the power on or off.
The backlight for the screen was turned off and there was minimal background processing during testing. Tests were
conducted according to the following script. First, the appro-priate frequency and voltage setting is made. Second, the AC power is disconnected. Next several initial values are saved. In particular, wall clock time was obtained usinggettimeofday, cycle count was obtained using therdtsc instruction, and en-ergy in the battery was obtained through ACPI. Additionally, hardware performance counters are set to measure memory ac-cesses in order to compute memory bandwidth. Fourth, the program is executed. After the program completes, final val-ues are collected and differences are calculated. Finally, the AC power is reconnected and the script waits until the battery is recharged before starting the next test.
We experimented with three different benchmark sets: NAS, SPEC integer, and SPEC floating point. The NAS suite is a popular high-performance computing benchmark, consist-ing of 8 scientific benchmarks includconsist-ing application areas such as sorting, spectral transforms, and fluid dynamics. In contrast, the 12 SPEC integer benchmarks are non-scientific applica-tions that are CPU and/or memory intensive. The 14 SPEC floating part benchmarks are a mixture of both scientific and
non-scientific programs For example, mesa and facerec are
non-scientific, graphics programs, whereas swimand mgrid
are well-known scientific benchmarks.
4 Experimental Results
The primary goal of this paper is to examine the energy-time tradeoff for high-performance applications. Space constraints do not permit the presentation of all the results. For more in-formation, including full results, please see our accompany-ing technical report [PF04]. Unless specifically noted, results are from the new laptop. While the energy-time tradeoff dif-fers between machines, our results show that both laptops save a significant amount of energy on a substantial subset of the programs tested. We believe that this provides evidence, albeit not conclusive, that the results from our experiments will be typical among machines with multiple operating points.
As described in Section 3, we conducted tests over the three different sets of benchmark programs on each of the two laptops described above. Also, each program was run at every operating point. For each test, we measured the time and en-ergy consumed. Additionally, using performance counters, we measured the number of cycles, micro-operations retired, and memory accesses.
Below we discuss the overall results. Then, we look at a few representative applications in detail. Lastly, we show that these results we have observed on a single machine are likely to be seen in parallel configurations.
4.1 Overall Results
0.9 0.95 1 1.05 1.1 1.15 1.2 1.25 1.3 1.35
1100 1200 1300 1400 1500 1600 1700 1800 1900
Speed (MHz) NAS
time Energy
(a) All
0.85 0.9 0.95 1 1.05 1.1 1.15 1.2 1.25 1.3
1100 1200 1300 1400 1500 1600 1700 1800 1900
Speed (MHz) NAS (top third)
time Energy
(b) Top third
Figure 1: Normalized, aggregate plots of NAS set.
the increase in time, a lower operating point uses less energy. This is the case in most of the programs we tested, where one of the lower operating points results in the least energy con-sumed.1However, for a handful of programs, the time increase exceeds the power decrease, so the highest operating point also consumes the least energy.
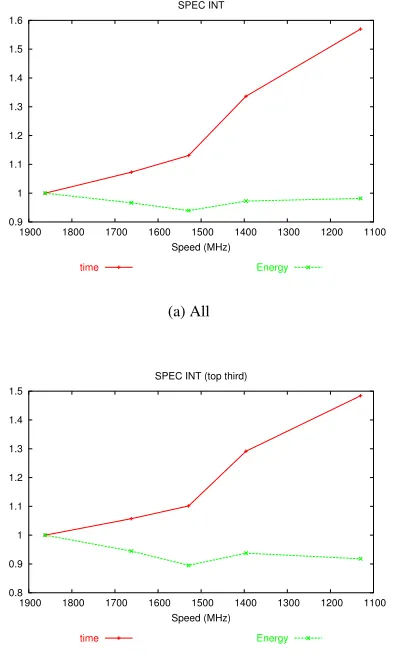
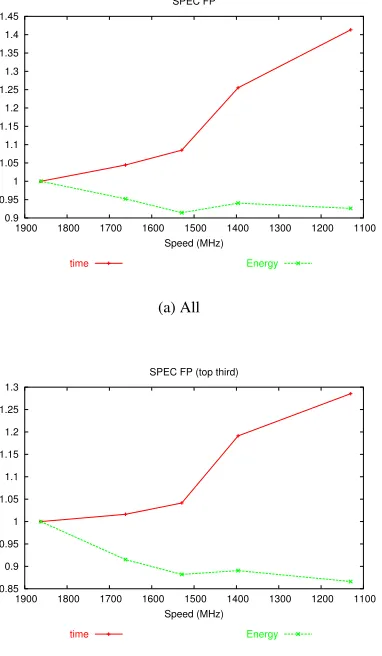
Figures 1(a), 2(a), and 3(a) plot the normalized aggregate results for each program set on the new laptop. The x-axis plots the operating point in terms of frequency from highest to lowest. There are two lines; the increasing line is elapsed time and the initially decreasing line is energy consumed. All values are normalized to those of the highest operating point; thus, all lines begin at 1 on the left-hand side. For the NAS pro-grams, the time and energy diverge from 1 about equally. This means the energy savings is approximately equal to the time delay. For example, at the third operating point, the energy used and time taken are 91% and 112% of full, respectively. The SPEC sets also show an increase in time, but show little decrease in energy. This is because there is a high variance in the energy-time tradeoff among programs. The SPEC sets contain a few programs for which there is little energy savings
1Which operating point resulted in the lowest energy varies between pro-grams.
0.9 1 1.1 1.2 1.3 1.4 1.5 1.6
1100 1200 1300 1400 1500 1600 1700 1800 1900
Speed (MHz) SPEC INT
time Energy
(a) All
0.8 0.9 1 1.1 1.2 1.3 1.4 1.5
1100 1200 1300 1400 1500 1600 1700 1800 1900
Speed (MHz) SPEC INT (top third)
time Energy
(b) Top third
Figure 2: Normalized, aggregate plots of SPEC INT set.
because the highest operating point uses the least energy or close to it. Overall, the aggregate plots suggest that one needs to be selective about which programs to try to save energy.
To investigate further, we plot for each set the programs that rank in the top 1/3 of energy-time tradeoff. Figures 1(b), 2(b), and 3(b) show the results. The NAS subset looks best, with 15% average energy savings for a time delay of less than 5% at the third operating point. The SPEC FP subset is similar, with 12% savings for 4% delay. Finally, the SPEC INT subset provides a 10% savings for a 10% delay, similar to the tradeoff provided by the full NAS set.
The slowest two operating points do not generally offer an energy savings. While the power is decreased, the time delay is so great that the energy savings is small if any. Only two of the 34 programs do not have an energy-time tradeoff:craftyfrom
SPEC INT andsixtrackfrom SPEC FP. The complete results
are shown in [PF04]. The next section evaluates individual programs in detail.
4.2 Detailed Results
0 5000 10000 15000 20000 25000 30000
0 500 1000 1500 2000 2500 3000
Energy (mWh)
Time (secs) sp
(a)sp
0 5000 10000 15000 20000 25000 30000 35000
0 500 1000 1500 2000 2500 3000 3500
Energy (mWh)
Time (secs) mcf
(b)mcf
0 2000 4000 6000 8000 10000 12000 14000 16000
0 200 400 600 800 1000 1200 1400 1600
Energy (mWh)
Time (secs) facerec
(c)facerec
Figure 4: Best energy-time tradeoff in each set.
0 10000 20000 30000 40000 50000 60000
0 1000 2000 3000 4000 5000 6000 7000
Energy (mWh)
Time (secs) ep
(a)ep
0 2000 4000 6000 8000 10000 12000
0 200 400 600 800 1000 1200
Energy (mWh)
Time (secs) perlbmk
(b)perlbmk
0 2000 4000 6000 8000 10000 12000 14000 16000
0 200 400 600 800 1000 1200 1400 1600 1800
Energy (mWh)
Time (secs) sixtrack
(c)sixtrack
Figure 5: Worst energy-time tradeoff in each set.
is plotted on the x-axis. We find this plot presents the tradeoff most vividly. The higher of two points uses more energy and the rightmost takes more time. Therefore, a near vertical slope indicates an energy savings with little time delay, and a hori-zontal slope indicates a time penalty and no energy savings.
The programs shown in Figure 4 have the best energy-time tradeoff in each sets: NAS (sp), SPEC INT (mcf), and SPEC FP (swim). In these “vertical” applications, the execution time advantage of the highest operating point is small. However, the energypenaltyfor this ultimate performance is large. Consider for example thespbenchmark, in Figure 4(a). Using the third operating point (1529 MHz) yields about a 6% increase in exe-cution time compared to the highest operating point, while the corresponding decrease in energy consumption is nearly 20%. Next, we examine how a vertical energy-time shape oc-curs. Our results show that programs use the essentially same number (within 1%) of micro-operations regardless of the op-erating point. However, the number of cycles that an execution takes can change, especially in the vertical applications. For example, consider themcf application at the two highest oper-ating points (1862 and 1662 MHz), in which the performance gain is less than 1%. Using the lower operating point with a clock rate that is 89% of the highest, the execution has 90% as many cycles (approximately 5.0 to 4.5 trillion). Because the number of micro-operations does not change, the
perfor-mance, in micro-operations per cycle (UPC), increases as the frequency decreases. The additional cycles in the higher op-erating point do not perform useful work. This indicates that the CPU is not the performance bottleneck. Below we exam-ine this and, not surprisingly, determexam-ine that memory is the bottleneck.
On the other hand, Figure 5 shows the programs that do not exhibit an energy penalty for the ultimate performance. In-stead, in these programs, the highest operating point results in nearly the lowest energy consumed. We call these “horizontal” programs.
0.9 0.95 1 1.05 1.1 1.15 1.2 1.25 1.3 1.35 1.4 1.45
1100 1200 1300 1400 1500 1600 1700 1800 1900
Speed (MHz) SPEC FP
time Energy
(a) All
0.85 0.9 0.95 1 1.05 1.1 1.15 1.2 1.25 1.3
1100 1200 1300 1400 1500 1600 1700 1800 1900
Speed (MHz) SPEC FP (top third)
time Energy
(b) Top third
Figure 3: Normalized, aggregate plots of SPEC FP set.
cal applications before the highest operating point, which cor-responds to the curve becoming vertical. The higher operating point does not result in higher performance—the energy-time tradeoff suggests using the lower point because the memory is the bottleneck.
In addition to memory bandwidth, we evaluated the pro-cessor efficiency in terms of micro-operations per cycle. The Athlon processors decode x86 instructions into one or more micro-operations that are executed by the RISC core of the processor. Therefore, UPC (micro-operations per cycle) is a better indicator of performance than IPC (instructions per cy-cle). Figure 7 shows UPC normalized to the highest operating point. The vertical applications have an increase in UPC at lower operating points, which is consistent with other observa-tions above. The horizontal applicaobserva-tions achieve the same pro-cessor efficiency for the three highest operating points. Thus, the overall performance is directly proportional to frequency in these applications.
Figure 8 plots the energy efficiency of our targeted
pro-grams in work per unit energy, e.g., micro-operations per
Joule. The plot is normalized to the efficiency of the high-est operating point. The plot shows that for vertical programs, which have a good tradeoff, the energy efficiency increases as
0 0.2 0.4 0.6 0.8 1
1100 1200 1300 1400 1500 1600 1700 1800 1900
Speed (MHz)
’sp’ ’ep’
’mcf’
’perlbmk’ ’facerec’ ’sixtrack’
’freq’
Figure 6: Memory bandwidth.
0.9 0.95 1 1.05 1.1 1.15 1.2 1.25 1.3 1.35 1.4 1.45
1100 1200 1300 1400 1500 1600 1700 1800 1900
Speed (MHz)
’sp’
’ep’ ’perlbmk’’mcf’ ’sixtrack’’facerec’
Figure 7: Micro-operations per cycle.
the performance decreases and vice versa for horizontal pro-grams that have a poor energy tradeoff. The vertical propro-grams are less efficient than their companion horizontal programs,
e.g., in the NAS setspis less efficient thanep. This is not a surprise because a lack of an energy tradeoff means that the program is using its energy well. Again, these results illustrate how an energy tradeoff comes about.
We also conducted tests on the old laptop. The new ma-chine is much faster and has more memory resources than the old machine. As stated above, the new laptop has a 33% faster bus, 100% faster memory, and twice the L2 cache and mem-ory. Therefore, some programs run much better on the new machine than the old, which makes the results quite different.
For example, theepprogram from the NAS set overwhelms
the memory subsystem on the old laptop. Theepprogram is a horizontal program on the new laptop. The program’s memory bandwidth scale with processor speed indicating that the pro-gram is processor-bound. On the other hand,epis a pure ver-tical program on the old laptop—the time and memory band-width are essentially the same for all operating points while energy decreases. Consequently, the behavior of these pro-grams could hardly be more dissimilar. Therefore, given the resources of each laptop, the programs should not be consid-ered the same program for the purposes of analysis.
0.85 0.9 0.95 1 1.05 1.1 1.15 1.2 1.25 1.3
1100 1200 1300 1400 1500 1600 1700 1800 1900
Speed (MHz)
’sp’
’ep’ ’perlbmk’’mcf’ ’sixtrack’’facerec’
Figure 8: Micro-operations per Joule.
0.7 0.75 0.8 0.85 0.9 0.95 1 1.05 1.1 1.15 1.2
800 1000 1200 1400 1600 1800
Speed (MHz)
time new
energy new energy oldtime old
Figure 9: NASspon old and new laptop.
larger thansp.A. The curves are similar; this similarity oc-curs because the bottlenecks are comparable. In the case of
sp, the memory bandwidth for the top three operating points is roughly the same on both laptops. In general, the old laptop tends to have more vertical programs because it has a slower bus and less memory. Even though the processor is also slower in the old laptop, the balance between the processor and mem-ory is different.
4.3 Parallel Tests
While this paper focuses on sequential HPC applications, our eventual goal is to support parallel HPC applications, as this is where much of the total energy at supercomputer centers
is consumed. In general, there should bemore opportunity
to save energy in parallel HPC applications. This is be-cause not only is there the possibility that the CPU is not the bottleneck—which means that an individual processor can be scaled— but also that a given node is not the bottleneck— which means that it can be executed at a lower operating point without any performance penalty.
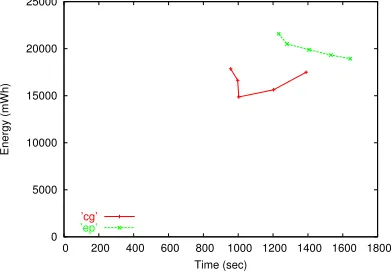
Figure 10 shows the energy-time tradeoff for two dis-tributed 2-node MPI programs,cgandep. Because a cluster of identical machines is not available to us, the two nodes are the new laptop and a desktop machine. These two machines
have different CPU speeds, memory speeds, etc. However,
0 5000 10000 15000 20000 25000
0 200 400 600 800 1000 1200 1400 1600 1800
Energy (mWh)
Time (sec)
’cg’
’ep’
Figure 10: Scatter plot of energy-time for MPI versions of
NAS programscgandep.
only the laptop has multiple operating points. It is important to note that the laptop is much slower, and so there is no energy savings possible due to another node being the bottleneck, be-cause the laptop is in fact the bottleneck node. Keep in mind that if either node could be scaled, then the faster machine could be scaled with little or no performance penalty.
The figure shows that, as expected, there is an energy-time tradeoff in MPI programs. The energy-time tradeoff is in fact greater than that of their sequential counterparts. While we have only tested a handful of programs, and therefore is by no means a comprehensive study, the results convince us that a full-scale study of energy consumption in MPI applications is warranted. This study is currently underway.
5 Summary and Future Work
This paper has investigated the tradeoff between energy and performance. We analyzed the NAS and SPEC suites to deter-mine the relationship between frequency and voltage settings and execution time. By executing each program at multiple operating points, we determined that most (94%) of the pro-grams in these suites can consume less energy when they are run at a lower operating point. In other words, they have what we term anenergy-time tradeoff. While computational scien-tists typically want high performance at all costs, we believe that economic pressures will eventually force users to consider energy as a limiting factor.
However, our work is only a first step—only a subset of the benchmarks consume significantly less energy with a small increase in time, which is the desired case—and more work is needed to selectively apply frequency and voltage scaling. Computational scientists will be much more willing to con-sider energy-saving techniques if they result in a relatively small increase in execution time. Indeed, we found that bench-marks such asmcfandfacerechave, at some operating points, virtually no increase in time but a significant reduction in en-ergy.
we believe that in fact there ismoreopportunity to save energy in parallel programs. Our next step is to undertake an investi-gation of the energy-time tradeoff in parallel programs.
References
[Adi02] N.D. Adiga et al. An overview of the BlueGene/L supercom-puter. InSupercomputing 2002, November 2002.
[BAD+92] M. Baker, S. Asami, E. Deprit, J. Ousterhout, and M. Seltzer. Non-volatile memory for fast, reliable file systems. In Proceed-ings of the 5th ASPLOS, 1992.
[BBM98] L. Benini, A. Bogliolo, and G. De Micheli. Monitoring system activity of OS-directed dynamic power management. In Pro-ceedings of the International Symposium on Low-Power Elec-tronics and Design ISPLED ’98, 1998.
[Bel00] F. Bellosa. The benefits of event-driven energy accounting in power-sensitive systems. InProceedings of the 9th ACM SIGOPS European Workshop, September 2000.
[CCC+00] Compaq Computer Corporation, Intel Corporation, Microsoft Corporation, Phoenix Technologies Ltd., and Toshiba Corpora-tion. Advanced configuration and power interface specification, revision 2.0. July 2000.
[Com99] IEEE Computer Society LAN/MAN Standards Committee.
IEEE Std 802.11: Wireless LAN medium access control and physical layer specification. Technical report, August 1999. [DKB95] F. Douglis, P. Krishnan, and B. Bershad. Adaptive disk
spin-down policies for mobile computers. InProc. 2nd USENIX Symp. on Mobile and Location-Independent Computing, 1995. [DSK+02] V. Delaluz, A. Sivasubramanian, M. Kandemir, N.
Vijaykrish-nan, and M. J. Irwin. Scheduler-based DRAM energy manage-ment. InProc. Design Automation Conf. (DAC ’02), Jun 2002. [Ell99] C.S. Ellis. The case for higher-level power management. In
Proceedings of the 7th Workshop on Hot Topics in Operating Systems, March 1999.
[FRM01] K. Flautner, S. Reinhardt, and T. Mudge. Automatic
performance-setting for dynamic voltage scaling. In Proceed-ings of the 7th Conference on Mobile Computing and Network-ing MOBICOM ’01, July 2001.
[FS99a] J. Flinn and M. Satyanarayanan. Energy-aware adaptation for mobile applications. InSymposium on Operating Systems Prin-ciples, pages 48–63, 1999.
[FS99b] J. Flinn and M. Satyanarayanan. Powerscope: A tool for profil-ing the energy usage of mobile applications. InProceedings of the Second IEEE Workshop on Mobile Computing Systems and Applications, February 1999.
[GHL04] Chris Gniady, Y Charlie Hu, and Yung-Hsiang Lu. Program
counter based techniques for dynamic power management. In
Proceedings of the 10th International Symposium on High-Performance Computer Architecture, February 2004.
[Gru01] F. Gruian. Hard real-time scheduling for low-energy using stochastic data and DVS processors. InProceedings of the In-ternational Symposium on Low-Power Electronics and Design ISPLED ’01, August 2001.
[HK03] C-H. Hsu and U. Kremer. The design, implementation, and eval-uation of a compiler algorithm for cpu energy reduction. In Pro-ceedings of ACM SIGPLAN Conference on Programming Lan-guages, Design, and Implementation, June 2003.
[HLS96] D. P. Helmbold, D. D. E. Long, and B. Sherrod. A dynamic disk spin-down technique for mobile computing. InMobile Comput-ing and NetworkComput-ing, pages 130–142, 1996.
[IKH01] C. Im, H. Kim, and S. Ha. Dynamic voltage scheduling tech-nique for low-power multimedia applications using buffers. In
Proceedings of the International Symposium on Low-Power Electronics and Design ISPLED ’01, August 2001.
[JM01] R. Joseph and M. Martonosi. Run-time power estimation in
high performance microprocessors. InProceedings of the In-ternational Symposium on Low-Power Electronics and Design ISPLED ’01, August 2001.
[KB02] Ronny Krashinsky and Hari Balakrishnan. Minimizing energy
for wireless web access with bounded slowdown. InMobicom 2002, Atlanta, GA, September 2002.
[KSC99] R. Kravets, K. Schwan, and K. Calvert. Power-aware commu-nication for mobile computers. InProc. 6th International Work-shop on Mobile Multimedia Communications, Nov 1999. [LFZE00] A. R. Lebeck, X. Fan, H. Zeng, and C. S. Ellis. Power aware
page allocation. InArchitectural Support for Programming Lan-guages and Operating Systems, pages 105–116, 2000. [LKHA94] K. Li, R. Kumpf, P. Horton, and T. E. Anderson. A quantitative
analysis of disk drive power management in portable computers. InUSENIX Winter, pages 279–291, 1994.
[McC] John D. McCalpin. Stream: Sustainable
mem-ory bandwidth in high performance computers.
http://www.cs.virginia.edu/stream/.
[NSN+97] B. D. Noble, M. Satyanarayanan, D. Narayanan, J. E. Tilton, J. Flinn, and K. R. Walker. Application-aware adaptation for mobility. InProceedings of the 16th ACM Symposium on Oper-ating Systems and Principles, pages 276–287, October 1997. [Pana] Pansonic. Lithum ion batteries: Individual data sheet. [Panb] Pansonic. Overcharge/overdischarge/overcurrent safety circuits. [PBB98] T. Pering, T. Burd, and R. Brodersen. The simulation and eval-uation of dynamic voltage scaling algorithms. InProceedings of the International Symposium on Low-Power Electronics and Design ISPLED ’98, pages 76–81, August 1998.
[PF04] Feng Pan and Vincent W. Freeh. Energy-time tradeoff on laptop computers. Technical Report TBA, North Carolina State Uni-versity, Department of Computer Science, February 2004.
[PLS01] J. Pouwelse, K. LangenDoen, and H. Sips. Energy priority
scheduling for variable voltage processors. InProceedings of the International Symposium on Low-Power Electronics and Design ISPLED ’01, August 2001.
[PS03] Athanasios E. Papathanasiou and Michael L. Scott. Energy effi-ciency through burstiness. InWMCSA, October 2003.
[RF04] Michael C. Rosier and Vincent W. Freeh. An evaluation of
hyper-threading technology. Technical Report TBA, North Car-olina State University, Department of Computer Science, Febru-ary 2004.
[TT03] Nathan Tuck and Dean M. Tullsen. Initial observations of the simultaneous multithreading Pentium 4 processor. InTwelfth International Conference on Parallel Architectures and Compi-lation Techniques, pages 26–35, 2003.
[VLE00] A. Vahdat, A. Lebeck, and C. Ellis. Every joule is precious: The case for revisiting operating system design for energy efficiency.
SIGOPS European Workshop, 2000.
[Wil92] John Wilkes. Predictive power consumption. Technical Report HPL-CSP-92-5, Hewlett-Packard Labs, Feb 1992.
[WWF02] M. Warren, E. Weigle, and W. Feng. High-density computing: A 240-node beowulf in one cubic meter. InSupercomputing 2002, November 2002.
[YKW+04] Haijin Yan, Rupa Krishnan, Scott A. Watterson, David K. Lowenthal, and Kang Li. A theoretical and experimental study of energy-saving mechanisms for TCP downloads. Technical report, University of Georgia, February 2004.
[ZELV03] Heng Zeng, Carla S. Ellis, Alvin R. Lebeck, and Amin Vah-dat. Currentcy: Unifying policies for resource management. In