Extreme Programming Evaluation Framework for Object-Oriented Languages
Version 1.4
Laurie Williams
1, Lucas Layman
1, William Krebs
21
North Carolina State University, Department of Computer Science
{lawilli3, lmlayma2}@ncsu.edu
2
IBM Corporation
[email protected]
Abstract
The Extreme Programming (XP) software development methodology appears appropriate for some teams or projects. Anecdotal stories from developers who have adopted XP are often favorable. However, there is little empirical evidence to support or refute claims regarding XP. The Extreme Programming Evaluation Framework (XP-EF) provides a benchmark measurement framework for researchers and practitioners to assess concretely the extent to which an organization has adopted XP practices and the result of this adoption. Through a series of case studies that utilize the structure of the XP-EF, the community can build an experience factory of empirical findings on XP; the results of these case studies can be integrated and combined. This paper describes the elements of the XP-EF and provides examples of using it to measure a software project.
1. Introduction
As a relatively young methodology in software engineering, Extreme Programming (XP) [3] and its development practices are becoming increasingly popular, but its value is still confounded by hype and implicit, yet-to-be validated knowledge. Anecdotes of industrial teams experiencing success with partial or full implementations of XP practices are abundant [18, 19, 28]. However, organizations need a framework that empirically assesses XP’s efficacy.
Sim et al. challenged the software engineering community to create benchmarks – a set of tests used to compare the performance of alternative techniques [26]. Much fine work has been done on metrics for software development. The amount of literature on the subject and the process of gathering a significant set of metrics can be overwhelming to a small, informal team. Boehm and Turner [5] suggest that an informal team culture is appropriate agile methods, but this may mean that team members are less likely to be enthusiastic about formal metrics. Additionally, XP teams are often less likely to have metrics specialists on their staff due to size constraints and an avoidance of what is generally considered to be a formal, heavyweight aspect of software development. Thus, it is important to create a framework that is both informative and lightweight.
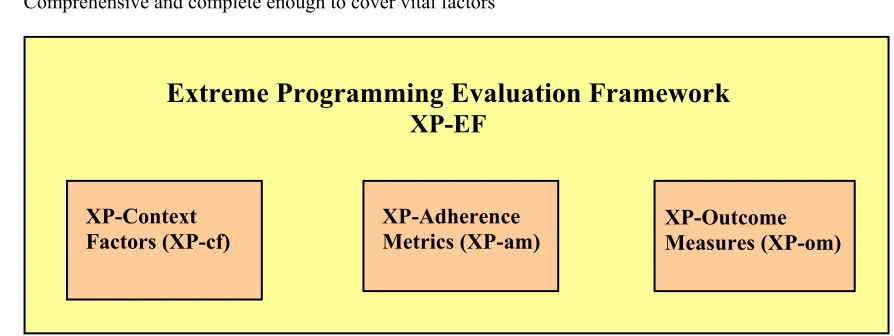
In this paper, we provide the details of a benchmark for assessing the extent to which an organization has adopted XP practices and the result of this adoption. The benchmark, called the XP Evaluation Framework (XP-EF), has three parts: XP Context Factors (XP-cf), XP Adherence Metrics (XP-am) and XP Outcome Metrics (XP-om), as shown in Figure 1. The framework was designed for use throughout development by agile teams. The metrics are focused, concise, and can be collected by a small team without a dedicated metrics specialist. Two published case studies, one at IBM [32] and one at Sabre Airline Solutions [17], have already been completed with XP-EF v1.2 [30] and v1.3 [31]. However, as additional case studies are completed, it is expected that the specific set of metrics which comprise the XP-EF for object-oriented languages will evolve over time. Through replication of case studies which utilize the structure of the XP-EF, the community can build an experience factory of empirical findings on XP; the results of these case studies can be integrated and combined.
The metric suite was developed using the Goal-Question-Metrics (GQM) technique [1], as will be discussed as the metrics are presented. Additionally, we had some overriding goals for the metrics suite. We desired for the metrics to be:
• Concrete and unambiguous
• Comprehensive and complete enough to cover vital factors
Figure 1: Extreme Programming Evaluation Framework
This report gives instructions on how small informal teams can concretely and consistently measure XP using the XP-EF so that different teams can repeat similar studies.
The XP-EF is a compilation of validated and proposed metrics. The validation of metric relevance requires convincing demonstration that (1) the metric measures what it purports to measure and (2) the metric is associated with an important external metric, such as field reliability, maintainability, or fault-proneness [9]. Several of the XP-am metrics require validation via repeated use of the XP-EF, and will be expanded to provide a more comprehensive, objective assessment of adherence to XP practices. In empirical studies, comparisons are informative. For example, a new project’s measures can be compared against a prior project’s measures within the same organization. Alternatively, comparisons can be made to industry standards and/or benchmarks. Jones has compiled data from many software organizations and provides benchmarks, best practices, and statistics for a range of software development topics [12].
Section 2 of this report explains the motivation and details behind the XP-Context Factors (XP-cf). Section 3 and 4 do the same for the Adherence Metrics (am) and Outcome Measures (om), respectively. A subject XP-Adherence survey, a customer satisfaction survey, and a programmer interview template are found in the appendix. Those who desire to see a completed XP-EF template and corresponding analysis are directed to the IBM case study [32] and the Sabre Airline Solutions case study [17]. Examples from these case studies are provided throughout this paper.
2. The XP-Context Factors
Drawing general conclusions from empirical studies in software engineering is difficult because the results of any process largely depend upon the specifics of the study and relevant context factors. We cannot assume a priori that a study’s results generalize beyond the specific environment in which it was conducted [2]. Therefore, recording an experiment’s context factors is essential for comparison purposes and for fully understanding the similarities and differences between the case study and one’s own environment.
Under the guidelines of the GQM, we consider our goal for the defining the context factors:
GOAL: To be able to understand in what ways a particular XP case study is similar or different from another XP case study or to understand in what ways a particular (XP) project is similar or different from a new (XP) project.
QUESTION: In what ways can software projects differ?
Extreme Programming Evaluation Framework
XP-EF
XP-Context Factors (XP-cf)
XP-Adherence
Jones [12] states that software projects can be influenced by as many as 250 different factors, but that most projects are affected by 10-20 major issues. He organizes key factors to be accounted for in every assessment into six categories: software classification, sociological, project-specific, ergonomic, technological, and international. The XP-EF framework templates are correspondingly organized into these six categories, though we modify the last factor (international) to geographical. We also include developmental factors that use a risk-driven approach for determining whether a project would be most successful using an agile or plan-driven approach.
2.1 Software classification
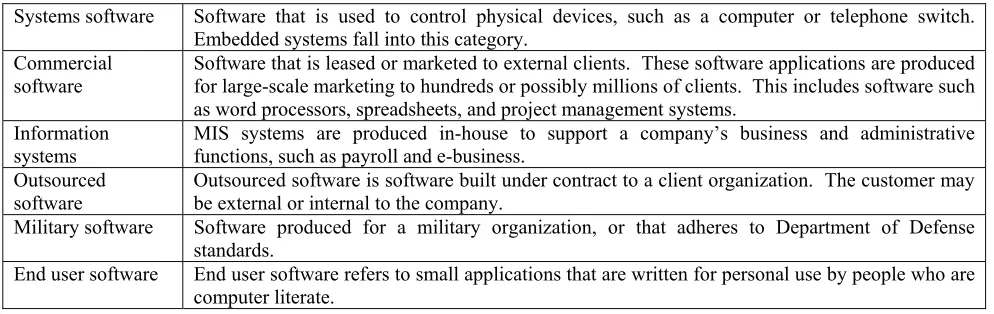
Different types of software are often associated with different risk factors and differing characteristics. For instance, military systems, in general, may be developed in a more formally controlled manner with strong requirements for reliability and security. On the other hand, developing MIS software may be subject to a less formal process with focus on usability and understandability, but not necessarily meet such high reliability and security standards. Consequently, it is important to record the type of software under development to provide general context for the project under study. We provide six classifications to choose from, as prescribed by Jones [12] and described in Table 1. The IBM team developed software under contract for another IBM organization that ultimately marketed the product to external customers. We thus classify this project as outsourced software.
Table 1: Software classification
Systems software Software that is used to control physical devices, such as a computer or telephone switch. Embedded systems fall into this category.
Commercial
software Software that is leased or marketed to external clients. These software applications are produced for large-scale marketing to hundreds or possibly millions of clients. This includes software such as word processors, spreadsheets, and project management systems.
Information
systems MIS systems are produced in-house to support a company’s business and administrative functions, such as payroll and e-business. Outsourced
software Outsourced software is software built under contract to a client organization. The customer may be external or internal to the company. Military software Software produced for a military organization, or that adheres to Department of Defense
standards.
End user software End user software refers to small applications that are written for personal use by people who are computer literate.
2.2 Sociological factors
Summary: The XP-cf’s sociological factors are designed to record the personnel characteristics of the project. Personnel and team makeup are documented as top risk factors in software development [4]. Consequently, factors such as team size, experience, and turnover can substantially affect the outcome of a project.
Team size and make up can potentially affect project outcome. The complexity of team management grows as team size increases, and communication between team members and the integration of concurrently developed software becomes more difficult for large teams [7]. It has been suggested that XP is not appropriate for large teams due to XP’s reliance on team intra-communication [22]. The presence of specialized personnel on the team can help speed up the development process by focusing on specific tasks that may be unfamiliar to other developers, such as GUI design. Other specialists, such as security specialists, can help catch flaws during development and improve deliverable quality.
in a new problem domain or with a new programming language. The familiarity of the project manager with the managerial role can influence the productivity of a team by drawing upon scheduling, cost estimation, and conflict resolution experience.
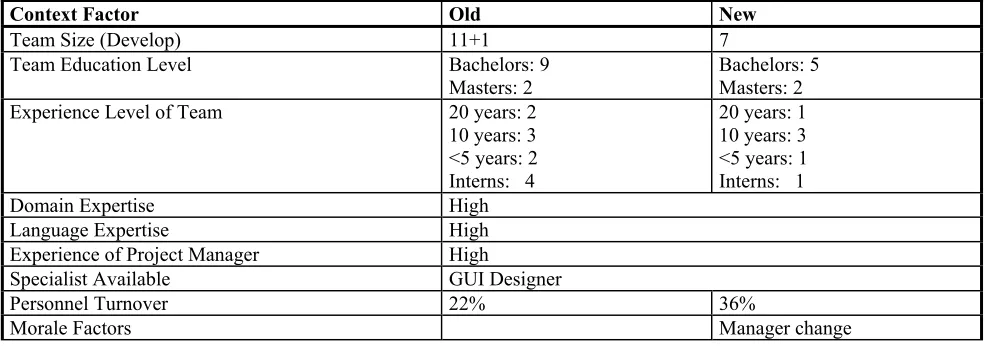
Another important sociological factor is personnel turnover. Since XP is averse to heavy documentation, most of the project knowledge remains tacit (internalized) rather than documented (externalized). Having knowledge dispersed across the team increases project safety since the system is not dependent upon the availability of a specific person or persons. XP seeks to alleviate the problems of personnel turnover through extensive communication between team members through the practices of pair programming and metaphor. However, XP may make it harder to cope with personnel turnover because there is less formal documentation. The success or failure of a project is dependent largely on the performance of the development team. When a team suffers from low morale (a possible side effect of extremely long hours), code quality may slip. Similarly, a morale boost may result in a more productive team and/or higher quality code. The IBM team’s sociological factors are provided as an example in Table 2.
Table 2: Example sociological factors
Context Factor Old New
Team Size (Develop) 11+1 7
Team Education Level Bachelors: 9
Masters: 2
Bachelors: 5 Masters: 2
Experience Level of Team 20 years: 2
10 years: 3 <5 years: 2 Interns: 4
20 years: 1 10 years: 3 <5 years: 1 Interns: 1
Domain Expertise High
Language Expertise High
Experience of Project Manager High
Specialist Available GUI Designer
Personnel Turnover 22% 36%
Morale Factors Manager change
1) Team Size: The complexity of team management grows as team size increases. It has been suggested that XP is not appropriate for large teams [22]. Communication between team members and the integration of concurrently developed software becomes more difficult for large teams [7].
2) Team Education Level: Education level may be considered another measure of experience or domain expertise.
Record Ask team members their level of post-secondary education (Associate, Bachelors, Masters, Ph.D.)
Exclude Do not count degrees which have been partially completed.
3) Experience Level of Team: Developer experience is a critical factor that influences code development. The more experienced the programmer, the more likely he or she is to be able to identify recurring problems during development and draw upon personal knowledge to resolve the issue in an expedient manner. The presence of experienced programmers on a development team can also help less experienced developers gain practical
Count Do count full time developers and full time testers dedicated to the XP project under study.
Exclude Do not count specialists who aid the team part time (such as performance, user interface design, management, project management, or localization specialists, technical writers). These will be recorded in another section.
Count The number of years spent developing software professionally by each full-time team member. Also record the number of interns and/or co-ops.
Exclude Do not count years spent developing software for personal use or in an academic setting.
4) Domain Expertise: A team familiar with the domain of their project may not be subject to the learning curve associated with development that must address an unfamiliar problem. For instance, a team developing web applications may have difficulty adjusting to developing embedded systems, but can produce software efficiently in their own domain.
Record Estimate or ask about the team’s experience with technical factors of the project other than the programming language and including the industry. Examples would be familiarity with database systems, communications, web programming, banking, retail system, agents.
Use a scale of Low, Moderate, High to denote the average domain expertise of the team.
Exclude Programming Language expertise (covered below)
5) Language Expertise: Similar to domain expertise, the team may incur significant learning costs when using an unfamiliar programming language. While it may be possible to switch between languages of a similar type (such as object-oriented languages) with a relatively small learning curve, adjusting from the object-oriented paradigm to functional languages may prove more difficult and thus slow development.
Record Estimate or ask about the team’s proficiency with the programming languages used on the project.
The scale is Low, Moderate, High to denote the average language expertise of the team.
6) Experience of the Project Manager: The familiarity of the project manager with the managerial role can influence the productivity of a team by drawing upon scheduling, cost estimation, and conflict resolution experience. Also, a project manager familiar with the development team may be able to draw upon personal knowledge of the individuals on the team to optimize development by assigning tasks to team members appropriate to their strengths and weaknesses.
Record Estimate the level of experience of the project manager in that role. Do not consider years of experience in general development unless he/she also served as project manager during that time.
The scale is Low, Moderate, High.
7) Specialist Available: Specialists can help speed up the development process by focusing on specific tasks that may be unfamiliar to other developers, such as GUI design. Other specialists, such as security specialists, can help catch flaws during development and improve deliverable quality.
Count Include any person not on the core team that helps with the project. Examples would include performance, localization, install, build, team building, database, security, privacy, reliability, usability.
Exclude Do not count anyone who has already been counted as a full time developer or tester on the team.
truck number and project safety. With XP, difficulties in transition may be lessened because knowledge is transferred through the team via pair programming, collective code ownership, and metaphor. Conversely, XP may make it more difficult to withstand turnover because there is less formal documentation.
Turnover for a given period of time is measured by counting how many people joined or left the team compared with the team size. This assumes an interval of time under study, such as one release. Interns and part time personnel are counted because they may have specific knowledge that is lost when they leave. Also, they may require training when joining the team, even though they may only be part time personnel.
Count When counting the number of people on the team, consider only those individuals considered full time members of the team. We use a the development period of a release as an example.
Ending_Total: Count the number of people on the team at the end of the release.
Added: Count the number of people added to the team just prior to or during the release.
Left: Count the number of people who left the team just prior to or during the release.
Turnover = (Added + Left) / Ending Total
Example At the end of the release under study, the team has 11 people. At the beginning of the release, two people move to another project. In the middle of the release, one more person leaves and one other joins the team. At the end of the measurement interval, the team has nine people.
Turnover = (1+(2+1)) / 11 = 36%
9) Morale Factors: The success or failure of a project is dependent largely on the performance of the development team. When a team suffers from low morale (a possible side effect of extremely long hours), code quality may slip. Similarly, a morale boost may result in a more productive team and/or higher quality code.
Record Record any factors “outside” of software development that may have affected the team’s performance during development, such as abnormal stress levels, cutbacks, holidays, manager change, or personnel transfers.
2.3 Project-specific factors
Summary: The XP-cf’s project-specific factors are designed to help quantify projects in terms of size, cost, and schedule. Gauging the size of the project can be done in many ways. One measure of the size of an XP project is the number of new and changed user stories. User stories correspond to system features and take the place of traditional requirements in an XP project. A more traditional representation of project size is lines of code. By themselves, neither lines of code nor counts of user stories can adequately represent the size of the system. The number of user stories and the amount of work captured by each story may vary greatly between organizations and projects, and the accuracy of counting lines of code varies with each tool. By combining lines of code and new and changed user stories, we hope to offset the disadvantages of each.
Domain is also an important consideration. Different risks are associated with different software domains. Web applications may be concerned with supporting thousands, or possibly millions, of concurrent users supporting a variety of different languages. Yet, the primary concerns of a database project may be scalability and response time. The medical domain also has unique security and/or privacy concerns. Similarly, effort will be focused in different project areas, such as quality assurance or requirement satisfaction, depending upon the nature of a software project. An enhancement project may focus on a specific piece of the product, thus narrowing the project’s scope and possibly simplifying the overall process. A maintenance project is concerned with correcting bugs, but must also prevent further defect injection while fixing the system. The presence of constraints significantly increases the amount of risk
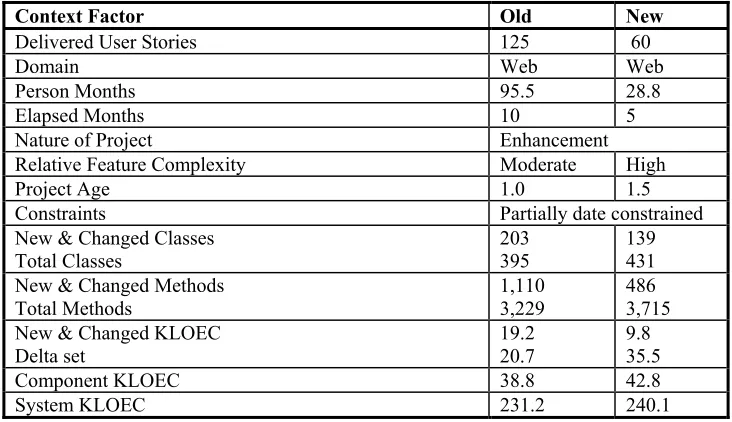
Tracking the amount of effort spent on a project is difficult but is necessary for comparisons to be drawn about quality and productivity. Both person months and elapsed months are recorded because some people work part time on other projects, thus necessitating a time-independent metric. Additionally, both of these measures are used to calibrate productivity in the XP-om. Recording the amount of new and changed classes, methods, and lines of code can help understand the effort expended on a project. Documenting changed classes and methods aids in understanding how quality can potentially be impacted during development. While a change to correct a defect may impact only a few lines of code, if these lines are distributed over multiple objects, this implies the chance of defect propagation amongst the altered classes and necessitates further testing efforts. The IBM team’s project-specific factors are described in Table 3.
Table 3: Example project-specific factors
Context Factor Old New
Delivered User Stories 125 60
Domain Web Web
Person Months 95.5 28.8
Elapsed Months 10 5
Nature of Project Enhancement
Relative Feature Complexity Moderate High
Project Age 1.0 1.5
Constraints Partially date constrained
New & Changed Classes
Total Classes 203 395 139 431
New & Changed Methods Total Methods
1,110 3,229
486 3,715 New & Changed KLOEC
Delta set 19.2 20.7 9.8 35.5
Component KLOEC 38.8 42.8
System KLOEC 231.2 240.1
1) Delivered User Stories: One measure of the size of a project is the number of user stories that are delivered in a release. By themselves, neither lines of code nor counts of user stories can adequately represent the whole picture. The number of new (not previously-completed) user stories and the amount of work captured by each story may vary greatly between organizations and projects. By combining lines of code and new and changed user stories, we hope to offset the disadvantages of each.
Count Count each user story or requirement completed during this release. Any user stories from a previous release that are re-opened to modification in the current release should be considered new user stories
Exclude Defects and deleted user stories.
2) Domain: Different risks are associated with different software domains. Web applications may be concerned with sustaining thousands, or possibly millions, of concurrent users supporting a variety of different languages. Whereas the primary concerns of a database project may be scalability and response time. The medical domain has unique security and/or privacy concerns.
Record Record the domain in which the application will be used. Potential choices include web application, intranet service, plug-in, developer toolkit, database development, and industry-specific technology.
Count Do count the number of person months spent by each person on the project, including partial months and part-time work.
4) Elapsed Months: This metric provides basic documentation of the overall schedule of the project in terms of calendar days.
Count Do count calendar days from when the initial requirements are selected for the release (in XP terms, after the release planning game meeting). During agile development, requirements may be added during the release, but only time elapsed from the initial requirements selection should be counted. Include design time, unit test time, and time for test phases until the product is considered final and ready for release.
Exclude Do not count time to manufacture media after code is final (time for pressing CDs, for example).
5) Nature of the Project: Effort will be focused in different areas depending upon the nature of a software project. An enhancement project may focus on a specific piece of the product, thus narrowing the project’s scope and possibly simplifying the overall process. A maintenance project is concerned with correcting bugs, but must also prevent further defect injection while fixing the system. We also include migration to mark a conversion to a new platform, which may involve understand a significant amount of new technology. Finally, we use reengineering to denote the reimplementation of a legacy system, for instance, converting a 16-bit system to a 32-bit application.
Record Whether the project is an enhancement of a previous release, a new product, a maintenance effort, a migration, or a reengineering effort.
6) Relative Feature Complexity: Assess the relative complexity of the features (user requirements) of this project compared to past similar team projects. More complex features may have schedule and quality implications.
Record Estimate the overall complexity of the features in this project compared to past similar team projects.
The scale is Low, Moderate, High to denote the overall feature complexity.
7) Product Age: Product age relates to both the availability of product knowledge as well as product refinement. An older product might be considered more stable with fewer defects, but there may be a lack of personnel or technology to support the system. Furthermore, making significant changes to a legacy system may be an
extremely complex and laborious task. Working with a newer product may involve instituting complex elements of architectural design that may influence subsequent development, and may be prone to more defects since the product has not received extensive field use.
Record Record the age of the product in years.
8) Constraints: The presence of constraints significantly increases the amount of risk associated with a project. This factor describes if the project is time boxed, or if the list of requirements is fixed and the date moves to accommodate the content. A fixed-delivery date may force a product out the door before it has been thoroughly tested. Conversely, severe reliability constraints may influence the amount of new functionality that can be introduced into the system. XP’s Planning Game practice states release dates are firm and features are added, adjusted, or removed the release date, so many classic XP projects would generally be “date constrained.”
9) Project Size: These next three factors document the relative size of the project in terms of lines of code, number of methods, and number of classes. Differencing tools such as Beyond Compare1 can help in counting these
measurements.
10.1) New and Changed Classes:
Count Count the number of new, changed, and deleted classes. Count the total number of classes. If possible, include details of the number of inner classes as well as the number of regular classes. We consider a changed class to be any class whose functionality is changed by the additional, removal, or modification of code. This does not include formatting or the addition or removal of comments. Also, we count deleted classes as representative of refactored work. Do not count empty classes – classes that contain no functionality. Changes to abstract, inherited, or interface classes should be counted as one changed class.
10.2) New & Changed Methods
Count Count new, changed, and deleted number of methods. Count the total number of methods.
10.3) New and Changed Lines of Code: The Delta set is defined as the total lines of code for all classes in which any lines of code were added, changed, or deleted. The Delta set serves as a basis for performing calculations related to quality and productivity in the XP-om section.
Count Count new, changed, and deleted lines of code. Count total lines of code for all classes in which any lines of code were added, changed, or deleted; this is called the Delta set.
11) Component KLOEC2: If the project/release is a component or set of components of a larger project, document
the total size of the component. This metric provides information on how much other code the developers need to intimately understand. It also relates to the complexity of the project.
Count Count total number of non-blank, non-comment lines of the component or components.
Include All the lines of code in the component or set of components, not just the new and changed lines of code.
12) System KLOEC: Record the size of the system the component or set of components is a part of. This metric provides information on how much other code the developers may need to understand. It also relates to the complexity of the project.
Count Count total number of non-blank, non-comments lines of the system.
Include All the lines of code in the system, not just the new and changed lines of code.
2.4 Ergonomic factors
Summary: Office environment plays an important role in communication among developers and customers. XP is purported to work best in an open space office environment. If a team currently operates in a cubicle or private office environment, it may be difficult for a team to obtain such a workspace without dedicated support from upper
management. Furthermore, physical layouts, such as whether a team works in private offices or in cubicles, or whether there are white-noise generators present, may influence the team’s ability to adopt collaborative techniques such as pair programming. Conversely, too much verbal interaction between the developers may become a noisy distraction.
1 http://www.scootersoftware.com/
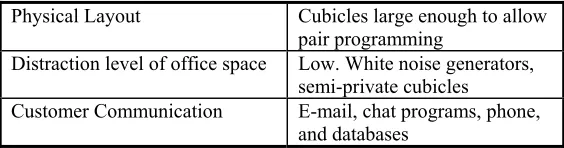
One of the XP practices, on-site customer, states that a customer should be collocated with the team in order to answer questions from the developers and resolve requirement ambiguities, as well as provide feedback into development. However, having a customer on-site is often not an option because it requires a client organization to dedicate personnel resources to the software project instead of focusing on other tasks. Also, if the customer is international or overseas, geographic and governmental constraints may prevent the presence of an actual customer on-site. Consequently, it may become necessary to settle for a proxy solution, such as frequent communication with the customer or customer representative via phone, e-mail, or other means. Documenting how communication occurs with the customer can help understand the varying levels of feedback the customer provides during the project. The IBM team’s ergonomic factors are displayed in Table 4. Since there was no change in these factors between the old and the new release, no
comparison is made.
Table 4: Example ergonomic factors
Physical Layout Cubicles large enough to allow pair programming
Distraction level of office space Low. White noise generators, semi-private cubicles
Customer Communication E-mail, chat programs, phone, and databases
1) Physical Layout: This factor records the setting in which the development team works. XP is purported to work best in an open space office environment. However, organizations that employ XP may not have this particular setup which might help explain differences in the success of the team. Recording this factor will help determine if office layout plays a role in the ability to effectively adopt XP. The presence of distributed teams is recorded later.
Record Describe if the team members are located in private offices with doors, in cubicles, in open space, or in some other arrangement. Describe if they are in the same aisle, building, or site. Note if the facilities are conducive to pair programming and easy communication with team members. It may also be useful to list if a team meeting room or a team recreation room is available.
2) Distraction Level of Office Space: Note distractions the team must deal with during development. An abnormal level of distraction in the working environment can have negative effects on productivity. Distraction reduces concentration, which may result in design or implementation flaws going unnoticed. However, extreme isolation can have negative morale implications.
Record Describe any distractions the team might suffer due to a crowded workspace, proximity to a busy conference room, construction, etc. Also note any factors that lessen the amount of distraction, such as white noise generators, working in a sound-proof lab, or private offices. Rate the overall level of distraction on a simple scale such as “Low, Moderate, or High.”
3) Customer Communication: This item describes how closely the team works and communicates with its customers. One of XP's practices calls for on-site customer, however, this is often not an option. Consequently, it may become necessary to settle for a proxy solution, such as frequent communication with the customer or customer
representative.
Record Describe how often and what means are used to communicate with customers. Note if customer dialog/problem databases, e-mail, phone, chat programs, video conferencing, etc, are used. Also, document if the customer is on-site, or if the primary interaction with the customer is through a representative in the development company.
Different teams use different methodologies and tools when working on their software projects. Factors such as rigorous project management and a large repository of reusable materials may significantly influence planning accuracy and coding efficiency. While this is an XP-oriented framework, some case studies may compare with pre-XP projects and/or releases. Thus, it is important to record the development methodology of the baseline project. Also, recording this factor may provide insight as to whether hybrid methodologies (using both plan-driven and agile practices) are viable options in software development. Furthermore, different methodologies are associated with different means of project management. For example, users of the waterfall process may use use-cases for feature specification and Gantt charts for scheduling. Alternatively, XP utilizes an iterative planning session to both elicit requirements and assign tasks. Recording the techniques used may provide insight into their effectiveness at estimating schedule and cost.
Some traditional defect-prevention practices, such as design reviews and code inspections, have been shown to improve the quality of a software product [11, 21, 27]. XP replaces these traditional practices in favor of practices such as pair programming and test-first design, which are also believed to maintain or increase software quality [29, 33]. It is important to document which defect prevention practices are used in order to frame the quality results gathered by the XP-EF in the proper context. One purported benefit of XP is the generation of an automated unit testing suite that can conveniently be reused by developers to validate changes to their code. Reusable materials can greatly speed up the development process by eliminating the need to reproduce the same artifacts over and over. However, artifacts may become obsolete over time and require effort to maintain.
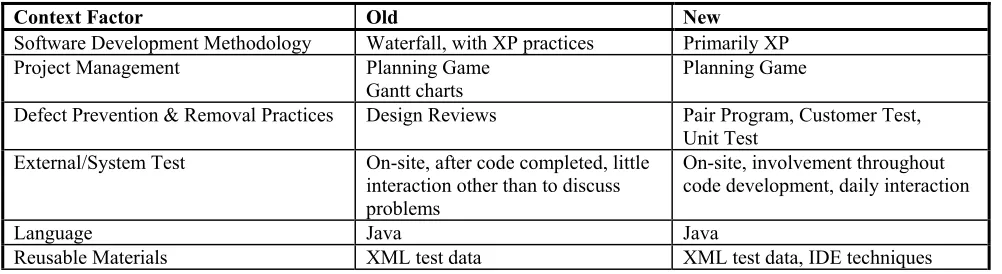
Finally, documenting which programming languages a team uses is important since each language has different characteristics. A strongly-typed language may eliminate certain types of bugs while an object-oriented language emphasizes reusability. Also, the particular programming language can drastically affect code volume. Certain metrics may not be available depending on the type of language used in the project as well. The IBM team’s technological factors are displayed in Table 5.
Table 5: Example technological factors
Context Factor Old New
Software Development Methodology Waterfall, with XP practices Primarily XP
Project Management Planning Game
Gantt charts Planning Game
Defect Prevention & Removal Practices Design Reviews Pair Program, Customer Test, Unit Test
External/System Test On-site, after code completed, little interaction other than to discuss problems
On-site, involvement throughout code development, daily interaction
Language Java Java
Reusable Materials XML test data XML test data, IDE techniques
1) Software Development Methodology: While this is an XP framework, case studies can compare with pre-XP project and/or pre-XP release. As a result, it is important to record the development methodology of the baseline project. Also, recording this factor may provide insight as to whether hybrid methodologies (using both plan-driven and agile practices) are viable options in software development.
Record Record the development paradigm employed during the project, e.g. waterfall, spiral, XP, RAD, etc. If you are using a hybrid or customized process, outline what aspects are used from the different paradigms.
2) Project Management: A variety of project management (PM) tools and techniques may be used create a PM suite tailored to individual organizations. Recording the techniques used may provide insight into their effectiveness at estimating schedule and cost.
3) Defect Prevention and Removal Practices: Traditional practices, such as design reviews and code inspections, have been shown to improve the quality of a software product. XP quality assurance practices, such as pair programming and unit testing, are also believed to increase software quality. It is important to document which defect prevention practices are used in order to frame the quality results gathered by the XP-EF in the proper context.
Record Note practices such as design inspections, code reviews, unit testing, and employing external testing groups that are meant to reduce the amount of delivered defects.
4) External/System Test: Often organizations perform software testing with a group other than the original developers before the code is shipped to the field. The location and the amount of interaction between the developers and this testing group can vary.
Record The location of the testing group relative to the developers. The timing of when system test activities started. The degree of interaction between the testers and developers.
5) Language: Different programming languages share different characteristics. A strongly-typed language may eliminate certain types of bugs while an object-oriented language emphasizes reusability. Also, the particular programming language can drastically affect code volume. Certain metrics may not be available depending on the type of language used in the project as well.
Record Record the programming languages used by the team during the release.
6) Reusable Materials: Reusable materials can greatly speed up the development process by eliminating the need to reproduce the same artifacts over and over. Reusable test data (such as unit tests) can also be used by the team to provide rapid feedback on the impact of a change in code. However, artifacts may become obsolete over time and require effort to remain up-to-date.
Record Record any items that your development team repeatedly uses during development. These items may include test suites, documentation templates, code templates, code libraries, third-party libraries, etc.
2.6 Geographic factors
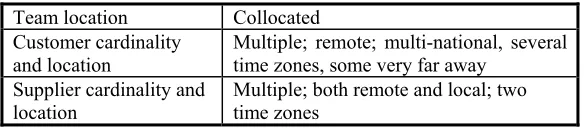
Summary: Distributed development has become more commonplace in industry and may influence XP practices such as pair programming, continuous integration, and collective ownership. Teams that communicate via the Internet may suffer increased communication and feedback times when compared to co-located teams. Also, some teams are “supplied” code by other development teams, and this external code must be integrated into the component(s) or product under development. The presence of a supplier adds to the complexity of the project because the team must understand the interfaces of the supplied code and is constrained by the schedule of the supplier team(s). The presence of an on-site customer can drastically reduce feedback time, and may improve schedule adherence, velocity, and customer satisfaction in the final product. The IBM team’s geographic factors are displayed in Table 6. Since there was no change in these factors between the old and the new release, no comparison is made.
Table 6: Example geographic factors Team location Collocated
Customer cardinality and location
Multiple; remote; multi-national, several time zones, some very far away
Supplier cardinality and
1) Team Location: Distributed teams that communicate via the Internet are becoming more commonplace, and it is possible that team location and accessibility may influence an XP project. A distributed team faces more
challenges than a co-located team during development. Communication and feedback times are typically increased when the team is distributed over many sites.
Record Record whether the team is collocated or distributed. A collocated team is found in the same building and area, such that personal interaction is easily facilitated. If the team is distributed, record whether the distribution is across several buildings, cities, countries, or time zones.
2) Customer Cardinality and Location: Dealing with more than one customer for a given project may result in a conflict of interest. Also, XP advocates the presence of an on-site customer which allows for constant customer feedback to the decision-making that occurs during development. However, customers often cannot commit the resource of an on-site representative.
Record Record the number of customers (or customer representatives) with which the team interacts. Document if the customer is located on-site, in another city, country, or time zone. Also document if the customer is from a different culture or uses a different language.
3) Supplier Cardinality and Location: Some teams are “supplied” code by other development teams which must be integrated into the component(s) or product under development. The presence of a supplier adds to the complexity of the project because the team must understand at least the interfaces of the supplied code and is dependant upon the work of the supplier team(s).
Record Record the number of suppliers with which the team interacts. Document if the customer is located on-site, in another city, country, or time zone. Also document if the customer is from a different culture or uses a different language.
2.7 Developmental factors
Figure 2: Example developmental factors polar chart
1) Dynamism: Dynamism is the amount that requirements change per month. Assuming there is some sort of plan (a release/iteration plan), how much does actual development deviate from that plan at the end of the iteration/release? Are most of the user stories selected for completion replaced by other stories? Are user stories consistently
reprioritized? Are user stories (requirements) volatile due to changing customer requests? It is best to be as quantitative and accurate as possible. However, formally tracking requirements changes can be difficult and a subjective measure will be required. Retroactively, obtain the value to plot from Requirements Dynamism (Table 7, Adherence Metrics). However, the objective of the polar chart is to project the values for the five axes to aid in the choice of an appropriate methodology.
2) Criticality: Criticality is the impact due to software failure. What is the worst thing that can happen if the software fails? Is it possible that many people will lose their lives, that the company will lose critical funds, or that it will simply be a loss of comfort? A failure in an air traffic control system could be catastrophic, whereas a failure occurring in an information kiosk may simply be an inconvenience. The company may also lose very important monies, or a small amount.
3) Personnel: Record the percentage of personnel on the development team at the various Cockburn personnel levels [8] described in Table 7.
Table 7: Cockburn personnel levels Level Team member characteristics
3 Able to revise a method, breaking its rules to fit an unprecedented new situation. 2 Able to tailor a method to fit a precedented new situation.
1A With training, able to perform discretionary method steps such as sizing stories to fit increments, composing patterns, compound refactoring, or complex COTS integration. With experience, can become Level 2. 1B With training, able to perform procedural method steps such as coding a simple method, simple refactoring,
following coding standards and configuration management procedures, or running tests. With experience, can master some Level 1A skills.
4) Size: The number of full-time people on the team, as recorded in the sociological factors (Table 2).
5) Culture: Culture measures the percentage of the team that prefers chaos versus the percentage that prefers order. Does most of the team thrive in a culture where people feel comfortable and empowered by having their roles defined by clear policies and procedures? If so, they tend toward order. If your team is more comfortable by having many degrees of freedom, then they tend toward chaos.
3. The XP-Adherence Metrics
The second part of the XP-EF is the XP Adherence Metrics (XP-am). Many software development teams do not exercise all the XP practices to their full extent; some employ only a few practices. Moreover, those that do adopt all 12 practices may not strictly apply the practices at all times for a variety of reasons. For example, some team members may be resistant to a particular practice. Similar to the XP-cf, comparisons of XP teams must consider the degree to which each team uses the 12 practices; each XP team is not the same.
Under the guidelines of the GQM, we consider our goal for the defining the adherence metrics:
GOAL: To be able to understand how closely a team actually used the XP practices
QUESTION: How much do the team members follow each of the XP practices?
The XP-am enables one to express concretely and comparatively the extent to which a team follows XP. It also allows researchers to investigate the interactions and dependencies between the XP practices and the extent to which the practices can be separated or eliminated. The XP-am contains subjective and objective measures (described below) as well as qualitative analysis about the team’s use of XP practices to triangulate the extent to which a team uses each of the XP practices. Because many of the XP-am metrics have not been previously established, they must be validated via case studies.
Teams often do not uniformly adopt all XP practices for various reasons [10]. Determining and recording the subset of practices employed by a team is essential for several reasons. First, organizations may be interested the adherence of certain practices. For example some practices, such as pair programming and test-driven development, have been shown to improve quality [29, 33] and may be deemed high-priority practices. Adherence metrics also enable case study comparison, the study of XP practice interaction, and the determination of contextually-based, safe XP practice subsets. The XP-am does not advocate high adherence as a universal benefit for all projects.
3.1 Objective measures
Table 8: Example objective adherence metrics
1) Test Coverage: The objective for this metric is to measure what proportion of the lines of code is executed via automated unit tests.
Count Count the lines of the Delta set (new and changed code) executed during execution of the frequently-run test suite (RUN). Count the total lines of code of the Delta set (TOTAL). Divide RUN by TOTAL. (This is a classical statement coverage test metric.)
2) Test Run Frequency: While a set of test cases may be available, it is the developer’s responsibility to run them. This metric determines how often test suites are run.
Count • Count the number of person days per week.
• Count the number of times each person runs the team’s automated unit test suite (not only their own tests). This number can be collected via automated or manual means.
• Divide number of runs by the number of person days.
Example Example: on a team of 10, one person runs the test suite 3 times per day, 8 people run it once per day, and one person never runs them. Average these numbers. The average for the week is
1 person @ (3 runs / day * 5 days / week) + 8 people @ (1 run / day * 5 days / week) + 1 person @ (0 runs / day * 5 days / week)
= (15 + 40) / (10 people * 5 days / week) = 55 / 50 = 1.1
3) Ratio of Test LOC to Source LOC: Examine the ratio of test lines of code to source lines of code as a relative measure of how much test code is written by the team.
Count • Count the KLOEC of automated test code run frequently written to test the Delta set (TEST LOC). • Count the KLOEC of new and changed production source code (SOURCE LOC).
• Divide the TEST LOC by SOURCE LOC.
4) New and Changed Classes with a Corresponding Test Class: Assessing the amount of test code written via source code ratios or statement coverage can be misleading. When dealing with a legacy system, there may be a
Objective metric Old New
Testing metrics
Test Coverage (quickset) 30% of lines 46% of lines
Test Run Frequency < 0.10 0.11
Test LOC / Source LOC < 0.30 0.42
New & Changed Classes w/ Test
Class 3.6% 57.2%
New Classes w/ Test Class 4.8% 80.0%
Coding metrics
Pairing Frequency 11% 48%
Inspection Frequency 2% 3%
Planning metrics
Release Length 10 months 5 months
Iteration Length Weekly Weekly
Requirements Dynamism N/A 0.23
we measure the number of New and Changed source classes that have a corresponding test class. In accordance with the principles of refactoring, every new and changed piece of code should have a corresponding unit test.
Count • Identify the source classes with new, changed, or deleted code. Count these classes (CHURNED CLASS).
• Identify the unit test classes that test the new and changed classes in the Delta set. Count these unit test classes (TEST).
• Divide TEST by CHURNED CLASS.
5) Percentage of New Classes with a Corresponding Test Class: This metric supplements the Test Classes/New & Changed Classes metric by identifying what percentage of new source classes have a corresponding unit test class.
Count • Count the number of new source classes (NEW CLASS).
• Identify the unit test classes that test these new source classes. Count these unit test classes (TEST CLASS).
• Divide NEW CLASS by TEST CLASS.
6) Pairing Frequency: Use your own method to detect how often code changes were done with pair programming instead of solo. In the IBM case study, a character was added to the change comment in the header of each changed file. This allowed us to search for the character in all files and compare the number of changes done using pair programming to the total number of changes. This technique gives greater weight to changes that affect many files, but this seems appropriate.
Count Count the proportion of changes made by pair programmers. One way to do this is: Mark each change with a one line comment in each file touched. Use a special character to represent if the change was made while pair programming, e.g. a ‘+’ between the author’s initials. Search for the number of change comments in the comment banner. Search for the number of lines with special comments denoting pair programming in the comment banner. Divide the number of pair programming changed by the total number of changes.
Example File 1 header
// Date Authors Description
// 9/15/2003 Bill Fix null pointer exception // 10/11/2003 Bill+Lucas Add support for new widgets
File 2 header
// 10/11/2003 Bill+Lucas Add support for new widgets
Pairing frequency = 2 paired of 3 total changes = 66%
We use //.*03.*\+ as a regular expression to find pairings, and //.*03 to find total changes.
7) Inspection Frequency: Many traditional methodologies advocate code or design inspections. Pair programming may serve as an alternative to this form of peer review. Currently, this measure is anecdotal.
Count Count the percentage of tasks that are evaluated via inspection.
8) Release Length: Measure the release length in order to gauge the extent to which the project adheres to the ‘short release’ XP practice. While there is no defined length for what qualifies a short release, XP advocates a maximum of a three month release period.
Count • Count the number of months/weeks/days in the release from the start of planning game to the release point.
• Count Design, Test, and Code phases. • Count time for Release planning.
Exclude • Do not count business and staffing process time before the requirements are chosen. • Do not count maintenance time after the release is shipped.
9) Iteration Length: Assess if the team is using short iterations. XP employs short iterations to receive continuous feedback on product development from all stakeholders. XP advocates an iteration length of at most three weeks.
Count Count the number of weeks/days between iterations where code is made available to customers.
Exclude Nightly builds that customers may be able to get but are not advertised as being tested.
10) Requirements Dynamism: The number of user stories added and removed based on customer priority/preference change is important because it relates to the degree of flexibility or agility of an XP team. Yet it should show activity resulting from XP’s planning game. While is interesting to know how much user stories change during a release, the added overhead of tracking requirements changes in the midst of a release is not consistent with the XP culture.
Count • User stories added (ADD) or removed (REMOVE) during the release (after the release has officially started).
• The total number of stories delivered at the end of the release (TOTAL). • Divide (ADD + REMOVE) by TOTAL.
3.2 Qualitative information
Qualitative methods can be used to enrich quantitative findings with explanatory information, helping to understand “why” and to handle the complexities of issues involving human behavior. Seaman [25] discusses methods for collecting qualitative data for software engineering studies. One such method is interviewing. Interviews are used to collect historical data from the memories of interviewees, to collect opinions or impressions, or to explain terminology that is used in a particular setting. Interviews can be structured, unstructured, or semi-structured [25]. Semi-structured interviews are a mixture of open-ended and specific questions designed to elicit unexpected types of information. The XP-EF uses semi-structured interviews to gather qualitative data to aid in understanding the XP-am’s quantitative metrics. In our case studies, we have asked interview questions specifically to investigate the difficulties of adopting some practices (as indicated by low survey responses or objective adherence metrics). Interviews are preferably conducted in person [13], and interview data should be anonymous. No identifying information is collected from the interviewee, though we solicit developer experience to help understand the background of the interviewees. The information obtained from the interviews is used to explain the phenomenon displayed in the above XP-cf and XP-am tables and the overall project results (XP-om). An example team member interview is found in Appendix C.
3.3 Subjective measures
questions gauging the extent to which each individual uses XP practices. The survey is taken by the developers only, not by any of the support personnel (such as tester, security specialists, etc.). A survey respondent reports the extent to which he/she uses each practice on a scale from 0% (never) to 100% (always). The results of the survey can be used by team leaders to see how much a practice is used, the variation of use between team members and trends of use over time. In the IBM case study, the survey was administered to the team every two months. Tracking Shodan survey results for a team is useful. However, since the Shodan survey is subjective, it is not advisable to compare survey results across teams.
In addition to the benefit of serving as a cross check to other adherence metrics, the survey has other benefits. If the survey is administered throughout development, early indication of failing to follow a critical XP practice allows the course correction before the release is over. The survey can also help encourage the use of XP practices by serving as a reminder of what the XP practices are. Also, these subjective measurements are oftentimes the only ones available since it is sometimes extremely difficult to determine an objective metric for evaluating a practice. For example, the XP practice of sustainable pace cannot be measured objectively unless the teams sign in/out of work, an uncommon practice among professionals. While one developer may consider 40 hours per week to be sustainable, others may comfortably work 50 hours per week. Table 9 documents the IBM team’s subjective adherence metrics.
Table 9: Example subjective metrics
Subjective metric (Shodan) Old mean (std dev) New mean (std dev) Testing metrics
Test First Design 17% (11.2) 55% (22.2)
Automated Unit Tests 43% (16.4) 67% (22.1)
Customer Acceptance Tests 63% (25.6) 78% (6.9)
Planning metrics
Stand up meetings 72% (16.4) 90% (14.1)
Short Releases 78% (27.3) 77% (9.4)
Customer Access / Onsite Customer 60% (28.1) 87% (4.7)
Planning Game 75% (21.2) 85% (10.0)
Coding metrics
Pair Programming 32% (15.0) 68% (14.6)
Refactoring 38% (11.6) 57% (14.9)
Simple Design 75% (10.5) 78% (6.9)
Collective Ownership 58% (14.0) 83% (7.5)
Continuous Integration 58% (18.8) 78% (13.4)
Coding Standards 87% (7.0) 82% (3.7)
Sustainable Pace 57% (12.5) 77% (9.4)
Metaphor 32% (30.7) 43% (18.9)
4. The XP-Outcome Measures
Part three of the XP-EF is the XP Outcome Measures (XP-om), which are business-oriented metrics that enable one to assess and report how successful or unsuccessful a team is when using a full or partial set of XP practices. Proponents of XP claim that it not only produces a product more satisfying to the customer, but also improves code quality [3]. Investigating the truth to these claims is of utmost importance to decision makers deciding whether or not to adopt XP for their organization.
Under the guidelines of the GQM, we consider our goal for the defining the results metrics:
GOAL: To build theories about whether the business-related results of a team change when XP practices are used.
QUESTION 1: Does the pre-release quality improve when a team uses XP practices? QUESTION 2: Does the post-release quality improve when a team uses XP practices? QUESTION 3: Does programmer productivity improve when a team uses XP practices? QUESTION 4: Does customer satisfaction improve when a team uses XP practices? QUESTION 5: Does team morale improve when a team uses XP practices?
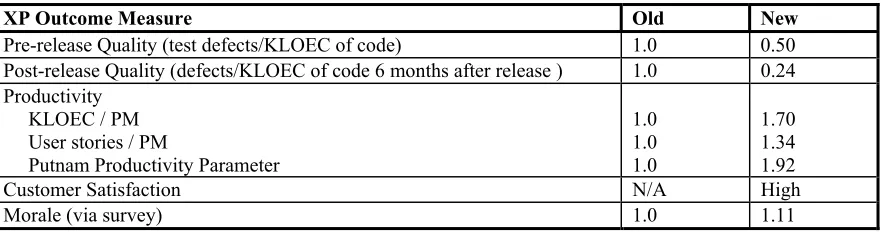
The XP-om is comprised of quantitative output measurements of productivity and quality, as well as qualitative information gathered from team member interviews, as discussed above. Interviews are also used to obtain customer feedback on the process. The XP-om metrics can be reported on a relative scale to protect proprietary information as needed. The IBM team’s outcome measures are documented in Table 10. Description of the outcome measures follow:
Table 10: Example outcome measures
1) Pre-release Quality (test defects/KLOEC): This metric reflects quality exposed during test before it is release to a customer such as is done by an external testing group within an organization. The metric is a surrogate measure of quality [14]; it is also a measure of testing efficiency.
Count • Count the number of defects found in the new and changed code. These defects are found during final system-level testing before the product is released to a customer. This testing can be done by the development team or by an external testing team in the development organization.
• Count the lines of code of the Delta set (see Table 3).
Exclude • Do not count defects discovered or reported during the release but not in the new or changed lines of code.
• Do not count those defects found by the developers during unit testing.
• Do not count bugs in reused binary code libraries from other teams not a part of the study. • Do not count bugs that were reported but were duplicates or irreproducible.
• Do not count bugs in test or sample code not shipped to customers. • Do not count bugs found by the compiler or during pairing or inspections.
• Do not count bugs injected after the release (those belong in Post-release Quality).
Additional Include information on the severity of the defects found as an indication of whether defects were critical or minor. Also, it is advisable to include information about the testing effort exhibited by the testing team. Testing effort can be measured in terms of person-months, number of scenarios tested, etc. Also document when during development external testing takes place, e.g. throughout development, just prior to release, etc. This information is very important for comparing pre-release defect density. A lower pre-release defect density could be due to improved product quality or a non-thorough testing effort.
2) Post-release Quality (released defects/KLOEC): Perhaps of greater business importance is the post-release quality metric, which documents those defects found by the customer after release.
XP Outcome Measure Old New
Pre-release Quality (test defects/KLOEC of code) 1.0 0.50
Post-release Quality (defects/KLOEC of code 6 months after release ) 1.0 0.24 Productivity
KLOEC / PM User stories / PM
Putnam Productivity Parameter
1.0 1.0 1.0
1.70 1.34 1.92
Customer Satisfaction N/A High
Count • Count the number of defects found in the new and changed code by a customer after release. • Count the lines of code of the Delta set (see Table 3).
Exclude • Do not count defects discovered or reported but not in the new or changed lines of code.
• Do not count bugs that were reported but were designated as something like duplicates, works as designed, or irreproducible.
Additional Include information on the severity of the defects found as an indication of whether defects were critical or minor.
3) Productivity: The objective of these metrics is to measure the team’s volume of useful output during project development for a release. Both user stories per person month and lines of code per person month are measured. Neither metric alone captures all perspectives of productivity. The metrics complement each other’s weaknesses.
4.1) KLOEC/PM: LOC is a precise and easy-to-calculate metric, but does not capture the number of system requirements met of features delivered to the customer. The lines of code per-person-month (PM) metric is gathered for comparison to traditional data and to serve as a cross-check to the user stories per PM metric.
Count • Count the lines of code of the Delta (see Table 3).
• Divide both these measures by total person-months (see Table 3) on the project
4.2) User Stories/PM: Stories per person month attempts to capture the amount of features delivered by the team, however, this number can vary due to differences in what teams actually consider to be a feature. For one team, a feature may be implanting an entire user interface, whereas for another team, it may be as simple as correcting a few defects. A benefit of the user stories/PM metric is it creates no extra work for the team.
Count • Count the number of user stories implemented during the release • Divide both these measures by total person-months on the project
4.3) Putnam Productivity Parameter: To adjust for differences in the size and the duration between projects, the Putnam productivity parameter (PPP) [23, 24] is calculated. This parameter is a macro measure of the total
development environment such that lower parameter values are associated with a lesser degree of tools, skills, method and higher degrees of product complexity. The opposite holds true for higher parameter values [24]. The PPP is calculated via the following equation:
PPP = (SLOC) / [(Effort/B)1/3 * (Time)4/3]
Putnam based this equation on production data from a dozen large software projects [24]. Effort is the staff years of work done on the project. B is a factor that is a function of system size, chosen from a table constructed by Putnam based on the industrial data (Table 11 below). SLOC is source lines of code [the Delta from Table 3], and Time is number elapsed years of the project.
Table 11: Putnam system size factor B [24]
Size (SLOC) B
5) Customer Satisfaction: Proponents of XP profess that customers are more satisfied with the resulting project because the team produced what they actually wanted, rather than what they had originally expressed they wanted [3]. Currently in the XP-EF, interviews are used to qualitatively assess the level of customer satisfaction and an interview instrument is provided in Appendix B. The outcome measure that is reported is the customer’s answer to the question “What is your overall satisfaction with the project?” on a scale from 1-5 (very dissatisfied, dissatisfied, neutral, satisfied, very satisfied). In the event of multiple customers, averaging the answer may be a plausible alternative, or documenting the individual answers. The other questions in the template survey may serve as helpful explanatory information and to help guide process improvement.
Record Document the customer’s satisfaction with the given release of the product, either through interviews or via a customer satisfaction survey. A template customer satisfaction survey has been attached in Appendix B that can be used as a guide for customer interviews.
Exclude Do not record customer satisfaction information unrelated to the product or the development team, e.g. customer service interaction, installation services, documentation, etc.
6) Morale: XP proponents contend that XP developers are happier because of increased team communication and the enforcement of a “sustainable pace.” [3] This metric is subjective and is assessed via a question on the Shodan survey (section 3.3) which asks “How often can you say you are enjoying your work?”
Record Document the results of the Shodan survey question regarding morale.
4. Limitations
The limitations of the case study should be enumerated. We suggest the use of the four criteria for judging the quality of research design set forth by Yin [35]. We provide an example of the use of these criteria based upon the IBM case study:
Construct validity. Construct validity involves establishing measures for the concepts being measured. Our case study had quantitative measures predefined though some of them were not validated. These metrics were backed up by qualitative means. As a result, construct validity was not a limitation of our study.
Internal validity. Experimenter expectation bias could have occurred because one of the researchers tested, coded, and led the IBM team while participating as an action researcher in this study. This intimate knowledge potentially introduces bias into the study. His enthusiasm for XP may have influenced the team’s successful adoption of XP. However, his direct involvement significantly aided the research because his detailed project knowledge provided qualitative details. The team knew the study was occurring so a Hawthorne [20] effect is a concern. However, the team was wholly concerned with completing the project and was unconcerned with the fact that a case study was occurring. Additionally, an external peer team participated in part of the product test, which should help remove some bias.
The difference in size of the two releases is a confounding factor. The new release was approximately half the size of the old release and had a smaller development team. Smaller projects with smaller teams are often considered to be less complex. However, the new release involved understanding and updating the larger code base.
The maturation effect is a concern because the comparison is made between two consecutive releases; however, we aimed to reduce internal validity concerns by studying the same software project with a team comprised largely of the same personnel. There is also a learning curve to be considered. The team members were learning to use some new XP practices, such as test-driven development, and they became more comfortable with these practices in the new release.
External validity. The representativeness of the project is a point of concern. The IBM team in this case study was selected in large part due to the third author, who expressed eagerness to participate in an XP project. Also, the team’s risk factors indicated that they were fairly well suited for using an agile development methodology. Since no formal selection of the case study team took place, it cannot be stated whether this team is representative of other teams in the organization.
The case study provides a complex context which impedes generalization even to all small, co-located teams. Most importantly, the IBM team did not have 100% process adherence to the XP practices.

![Table 11: Putnam system size factor B [24]](https://thumb-us.123doks.com/thumbv2/123dok_us/1448897.1177516/21.612.60.550.82.172/table-putnam-system-size-factor-b.webp)