University of Windsor University of Windsor
Scholarship at UWindsor
Scholarship at UWindsor
Electronic Theses and Dissertations Theses, Dissertations, and Major Papers
2018
Effective Ignition Control in Advanced Combustion Engines
Effective Ignition Control in Advanced Combustion Engines
Kelvin Xie
University of Windsor
Follow this and additional works at: https://scholar.uwindsor.ca/etd
Part of the Engineering Commons
Recommended Citation Recommended Citation
Xie, Kelvin, "Effective Ignition Control in Advanced Combustion Engines" (2018). Electronic Theses and Dissertations. 7486.
https://scholar.uwindsor.ca/etd/7486
This online database contains the full-text of PhD dissertations and Masters’ theses of University of Windsor students from 1954 forward. These documents are made available for personal study and research purposes only, in accordance with the Canadian Copyright Act and the Creative Commons license—CC BY-NC-ND (Attribution, Non-Commercial, No Derivative Works). Under this license, works must always be attributed to the copyright holder (original author), cannot be used for any commercial purposes, and may not be altered. Any other use would require the permission of the copyright holder. Students may inquire about withdrawing their dissertation and/or thesis from this database. For additional inquiries, please contact the repository administrator via email
Effective Ignition Control in Advanced Combustion Engines
by
Kelvin Xie
A Dissertation
Submitted to the Faculty of Graduate Studies
through the Department of Mechanical, Automotive and Materials Engineering in Partial Fulfillment of the Requirements for
the Degree of Doctor of Philosophy at the University of Windsor
Windsor, Ontario, Canada
2018
EFFECTIVE IGNITION CONTROL IN ADVANCED COMBUSTION ENGINES
by
Kelvin Xie
APPROVED BY:
______________________________________________ S. Habibi, External Examiner
McMaster University
______________________________________________ X. Chen
Department of Electrical and Computer Engineering
______________________________________________ J. Tjong
Department of Mechanical, Automotive and Materials Engineering
______________________________________________ G.T. Reader
Department of Mechanical, Automotive and Materials Engineering
______________________________________________ M. Zheng, Advisor
Department of Mechanical, Automotive and Materials Engineering
iii
DECLARATION OF ORIGINALITY
I hereby certify that I am the sole author of this thesis and that no part of this thesis has been published or submitted for publication.
I certify that, to the best of my knowledge, my thesis does not infringe upon anyone’s copyright nor violate any proprietary rights and that any ideas, techniques, quotations, or any other material from the work of other people included in my thesis, published or otherwise, are fully acknowledged in accordance with the standard referencing practices. Furthermore, to the extent that I have included copyrighted material that surpasses the bounds of fair dealing within the meaning of the Canada Copyright Act, I certify that I have obtained a written permission from the copyright owner(s) to include such material(s) in my thesis and have included copies of such copyright clearances to my appendix.
iv
ABSTRACT
The primary objective of the research was to study the limitations of the conventional spark ignition architecture with respect to ultra-lean and dilute combustion and develop ignition technologies and strategies that can facilitate such combustion strategies. A range of strategies using conventional and modified ignition coil systems were used in combustion chamber and engine tests to understand the effectiveness of the energy delivery mechanisms and different energy profiles. At operating conditions where the conventional ignition strategies had difficulties in achieving adequate ignition stability, the use of enhanced energy levels with different energy profiles for the achievement of effective ignition under high dilution ratio engine operating conditions was found to be necessary. A novel multiple-site ignition system was developed. It has been demonstrated to effectively deliver of ignition energy and achieved higher tolerance for lean combustion and high-dilution modes of combustion.
v
DEDICATION
vi
ACKNOWLEDGEMENTS
The work presented in this manuscript was made possible through the combined contributions of many current and former research associates. I would like to thank Dr. Raj Kumar, Dr. Clarence Mulenga, Dr. Usman Asad, Dr. Xiaoye Han, and Yuyu Tan for their previous work on setting up the engine test cells. I would like to thank all my colleagues, Dr. Meiping Wang, Dr. Shui Yu, Dr. Marko Jeftic, Dr. Tongyang Gao, Dr. Prasad Divekar, Dr. Xiao Yu, Shouvik Dev, Qingyuan Tan, and Zhenyi Yang for the many things they have taught me though our insightful discussions.
vii
TABLE OF CONTENTS
DECLARATION OF ORIGINALITY ... iii
ABSTRACT ... iv
DEDICATION...v
ACKNOWLEDGEMENTS ... vi
LIST OF TABLES ...x
LIST OF FIGURES ... xi
NOMENCLATURE ...xv
1. CHAPTER I INTRODUCTION ...1
1.1 The Engine Cycle ...2
1.2 Dilute Combustion for Spark Ignition Engines ...7
1.3 Spark Ignition ...10
1.4 Diesel Low-Temperature Combustion ...14
1.5 Trends of Advanced Combustion Engines ...16
2. CHAPTER II OBJECTIVES ...19
2.1 Research Objective ...19
2.2 Research Motivation ...19
3. CHAPTER III LITERATURE REVIEW ...24
3.1 Advanced Ignition Systems ...24
3.2 Electrical Breakdown ...28
3.3 Transient Plasma Ignition...30
3.4 Radio-Frequency Plasma...30
4. CHAPTER IV METHODOLOGY ...32
4.1 Combustion Vessels ...32
viii
4.3 Spark Control and Diagnostics ...38
4.4 Spark Ignition Components ...38
4.5 Corona Ignition System ...42
4.6 Single-Cylinder Test Engine ...43
5. CHAPTER V EFFECT OF ENERGY AND ENERGY PROFILE ON SPARK IGNITION ...50
5.1 Effect of Discharge Energy ...50
5.1.1 Quiescent Conditions ...50
5.1.2 Flow Conditions ...56
5.1.3 Engine Conditions ...59
5.2 Energy Profile Strategies ...67
5.2.1 Multi-coil Ignition ...67
5.2.2 Capacitor Discharge ...73
5.2.3 Pre-chamber Igniter ...83
6. CHAPTER VI MULTIPLE SITE SPARK IGNITION ...88
6.1 Multi-pole Ignition ...88
6.2 Extension of Dilution Limit ...92
6.2.1 Lean Combustion ...93
6.2.2 EGR Dilution Combustion ...96
7. CHAPTER VII VOLUME IGNITION WITH NON-THERMAL PLASMA DISCHARGE ...101
7.1 Non-thermal Plasma Discharge ...101
7.1.1 Electrical Power Control Characteristics ...101
7.1.2 Physical Discharge Characteristics ...106
7.2 Control of Discharge in Air ...113
ix
7.2.2 Discharge Duration Control ...116
7.3 Non-thermal Plasma Ignition ...117
7.3.1 Flame Kernel Formation Process ...117
7.3.2 Effect of Discharge Voltage...120
7.3.3 Effect of Discharge Duration ...122
7.3.4 Minimum Discharge Durations for Ignition ...125
7.4 Plasma and Flame Interactions ...128
7.4.1 Post-Ignition Flame Kernel Acceleration ...128
8. CHAPTER VIII CONCLUSIONS AND RECOMMENDATIONS ...132
8.1 Effect of Spark Ignition Energy and Energy Profile ...132
8.2 Multiple-Site Spark Ignition ...132
8.3 Non-thermal Plasma Ignition ...133
8.4 Application to Ultra-lean or High Dilution Ignition ...134
8.5 Recommendations for Future Work ...134
REFERENCES ...136
APPENDIX A: GASOLINE HCCI COMBUSTION ...146
APPENDIX B: NUMERICAL SIMULATION OF DIESEL AUTO-IGNITION ...153
B.1 Chemical Description of Ignition ...153
B.2 Sensitivity of Ignition to Physical Parameters ...155
APPENDIX C: NUMERICAL SIMULATION OF LAMINAR FLAME SPEED ..161
APPENDIX D: NOX GENERATION UNDER ELECTRICAL DISCHARGE...163
APPENDIX E: EFFECT OF SPARK GAP SIZE ON KERNEL FORMATION ...166
VITA AUCTORIS ...170
x
LIST OF TABLES
xi
LIST OF FIGURES
Figure 1-1: The Piston-Crank Mechanism and Engine Cycle ... 3
Figure 1-2: Effect of Compression and Specific Heat Ratios on Ideal Cycle Efficiency ... 5
Figure 1-3: P-V Diagram of an Engine Cycle ... 6
Figure 1-4: Heat-Release Analysis of Combustion ... 7
Figure 1-5: Reducing Pumping Work with EGR ... 8
Figure 1-6: Simplified Spark Ignition Circuit ... 10
Figure 1-7: Primary Coil Charging Characteristics ... 12
Figure 1-8: Sample Voltage and Current Profiles for Conventional Spark Ignition ... 13
Figure 1-9: Discharge and Power Profiles for Conventional Spark Ignition ... 14
Figure 2-1: Fundamental Aspects of Combustion and Available Controls ... 20
Figure 2-2: Impact of Dilution of Spark Timing and Flame Development ... 22
Figure 2-3: Comparison of Cycle-to-Cycle Variations ... 23
Figure 3-1: Potential for Brake Thermal Efficiency Gains [4] ... 26
Figure 3-2: Paschen Curve for Air, adapted from [44] ... 29
Figure 4-1: CV1 Small Optical Combustion Vessel ... 33
Figure 4-2: CV2 Intermediate Combustion Vessel ... 33
Figure 4-3: CV3 Large Optical Combustion Vessel ... 34
Figure 4-4: Schematic Diagram of Gas Preparation Systems ... 36
Figure 4-5: Z-type Shadowgraph Optical Setup ... 37
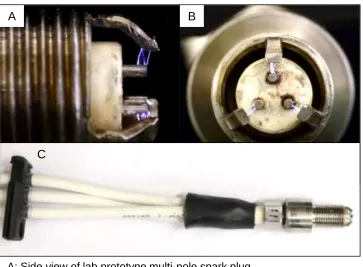
Figure 4-6: Photos of Spark Plugs ... 39
Figure 4-7: Later Generation Manufacturing Prototype Multi-pole Spark Plug ... 40
Figure 4-8: Earlier Generation Lab Prototype Multi-pole Spark Plug ... 41
Figure 4-9: Simplified Schematic of Corona Ignition System... 43
Figure 4-10: Corona Igniter ... 43
Figure 4-11: Engine Igniter Adaption and Combustion Chamber Shape ... 44
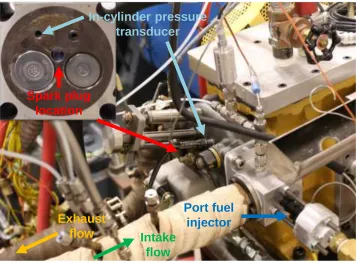
Figure 4-12: Photo of Engine Setup... 45
Figure 4-13: Engine Test Cell Setup ... 47
Figure 5-1: Discharge Characteristics in Conventional System at Different Energies ... 51
Figure 5-2: Discharge Energy Effect under Stoichiometric Conditions ... 52
xii
Figure 5-4: Flame Kernel Growth under Stoichiometric Case ... 54
Figure 5-5: Flame Kernel Growth under Lean Ignition Cases ... 55
Figure 5-6: Effect of Energy on Ignition Success Rate under Quiescent Conditions ... 56
Figure 5-7: Effect of Cross-flow Velocity on Discharge Characteristics ... 57
Figure 5-8: Restrike Behavior Under Air Flow ... 58
Figure 5-9: Spark Breakdown Voltage at Various Spark Timings ... 61
Figure 5-10: Spark Breakdown Voltage as a Function of Gas Density ... 62
Figure 5-11: Calculated In-Cylinder Temperature and Laminar Flame Speed ... 63
Figure 5-12: Effect of Spark Energy on Engine Operation ... 64
Figure 5-13: Comparison of Spark Energy ... 64
Figure 5-14: Effect of Spark Energy at Lean Conditions ... 66
Figure 5-15: Comparison of Spark Energy at Lean Conditions ... 66
Figure 5-16: Effect of Spark Energy up to Lean Limit ... 67
Figure 5-17: Current Enhancement with Multi-coil Discharge ... 68
Figure 5-18: Discharge Parameters of Multi-coil Strategy ... 69
Figure 5-19: Multi-coil Ignition Effect ... 70
Figure 5-20: Single Coil vs Multi-coil Ignition ... 71
Figure 5-21: Combustion Phasing Stability Scatter Plot ... 72
Figure 5-22: Load Stability Scatter Plot ... 72
Figure 5-23: High Energy Capacitor Discharge Configuration ... 74
Figure 5-24: High Power Capacitor Discharge Configuration ... 74
Figure 5-25: Comparison of Capacitor Discharge Power ... 75
Figure 5-26: Capacitor Discharge Effect on Combustion Parameters ... 76
Figure 5-27: Capacitive Discharge Effect on Pressure ... 77
Figure 5-28: Combustion Phasing Stability Scatter Plot at Lambda 1.2 ... 78
Figure 5-29: Load Stability Scatter Plot at Lambda 1.2 ... 78
Figure 5-30: Capacitive Discharge Effect on Combustion Parameters ... 79
Figure 5-31: Combustion Phasing Stability Scatter Plot at Lambda 1.7 ... 81
Figure 5-32: Load Stability Scatter Plot at Lambda 1.7 ... 82
Figure 5-33: Adjacent-cycle Impacts on IMEP ... 83
xiii
Figure 5-35: Pre-chamber Combustion Comparison ... 85
Figure 5-36: Pre-chamber Igniter Pressure Trace ... 85
Figure 5-37: Difference in Spark Timing for Pre-chamber Igniter ... 86
Figure 5-38: Comparison of Pre-chamber Igniter Test Engine Load and Emissions ... 87
Figure 6-1: Location and Orientation of Spark Poles in Multi-pole Configuration ... 89
Figure 6-2: Comparison between Single Pole and Multi-pole Ignition ... 90
Figure 6-3: Combustion Phasing Stability Scatter Plot at Lambda 1.4 ... 91
Figure 6-4: Load Stability Scatter Plot at Lambda 1.4 ... 91
Figure 6-5: Multi-pole Ignition Effect ... 92
Figure 6-6: Lean Extension Using Multi-pole Ignition ... 94
Figure 6-7: Efficiency and Emissions of Lean Combustion ... 95
Figure 6-8: EGR Dilution Limit Extension Using Multi-pole Ignition ... 97
Figure 6-9: Efficiency and Emissions of EGR Combustion ... 98
Figure 6-10: Lean and EGR Dilution Comparison ... 100
Figure 7-1: Voltage Buildup Profile in Corona Igniter ... 102
Figure 7-2: Effect of Primary Voltage on Discharge Voltage and Power ... 104
Figure 7-3: Corona Discharge Power Curve ... 105
Figure 7-4: Discharge Voltage as a Function of Frequency ... 106
Figure 7-5: Image Field and Recording Parameters ... 107
Figure 7-6: High-speed Image Sequence of Corona Discharge... 109
Figure 7-7: High-speed Image Sequence of Corona Transition to Arcing ... 110
Figure 7-8: Formation of Corona Streamer at Higher Pressure ... 111
Figure 7-9: Corona Wind Effect in Air and Combusting Mixture... 113
Figure 7-10: Image Field and Recording Parameters ... 114
Figure 7-11: Pressure and Voltage Effect on Corona Discharge ... 115
Figure 7-12: Examples of Arcing Conditions ... 116
Figure 7-13: Pressure and Duration Effect on Corona Discharge ... 117
Figure 7-14: Image Field and Recording Parameters ... 118
Figure 7-15: Direct Image Overlaid with Shadowgraph of Corona Ignition Event ... 119
Figure 7-16: Shadowgraph Images of Corona Voltage Effect on Ignition ... 121
xiv
Figure 7-18: Shadowgraph Images of Corona Duration Effect on Ignition ... 124
Figure 7-19: Shadowgraph Area of Corona under Different Discharge Durations ... 125
Figure 7-20: Effect of Corona Voltage on Minimum Ignition Energy ... 126
Figure 7-21: Effect of Lambda on Corona Ignition Energy ... 127
Figure 7-22: Influence of Corona Duration on Ignition Success Rate of Lean Mixtures 128 Figure 7-23: Discharge Profile of Post-Ignition Corona Pulse Strategy... 129
Figure 7-24: Shadowgraph Images of Post-Ignition Pulse Effect ... 130
xv
NOMENCLATURE
γ Isentropic ratio
λ Excess air ratio
θ Engine crank position
abs Absolute
ATDC After top dead centre
BDC Bottom dead centre
BMEP Brake mean effective pressure
CA5 Crank angle of 5% heat release
CA50 Crank angle of 50% heat release
CAD Crank angle degree
CR Compression ratio
CRP Common-rail pressure
CV Combustion vessel
CVC Constant volume chamber
DSO Digital storage oscilloscope
E Energy
EGR Exhaust gas recirculation
EVO Exhaust valve opening
FOV Field of view
FID Flame ionization detector
xvi FTIR Fourier transform infrared
g/kW∙h Unit of quantity normalized by engine work output
HC Hydrocarbon
i Current
IGBT Insulated-gate bipolar transistor
IMEP Indicated mean effective pressure
IVO Intake valve opening
ISFC Indicated specific fuel consumption
L Inductance
LNV Least numerical value
m mass
MAF Mass air flow
η Indicated thermal efficiency
NOx Nitrogen oxides
p Pressure
ppb Parts per billion
ppm Parts per million
Q Heat energy
R 1)Resistance 2) ideal gas constant
RPM Revolutions per minute
T Temperature
t Time
xvii THC Total hydrocarbon
V 1)Volume 2) voltage
Vd Displacement volume
WOT Wide open throttle
1
1. CHAPTER I
INTRODUCTION
The continuing need to improve the efficiency and emissions of the internal
combustion engines, which currently power the vast majority of the more than twenty
two million light-duty vehicles and one million heavy-duty vehicles in Canada, is an
important part of the public policy to address the issues of climate change and urban air
quality [1]. Regulations that have been enacted over the last four decades have driven
very significant innovations. Technologies such as variable valve actuation, direct fuel
injection, downsized and turbocharged engines, are being increasingly deployed into
vehicles [2]. The latest fuel economy standards, announced in 2011 by the United States
Environmental Protection Agency, have set annual improvement targets of approximately
5% per year, from the 2016 baseline of 225 g/mile of carbon dioxide emissions to 143
g/mile for 2025 passenger cars [3]. A wide array of technologies, such as improved
aerodynamics, hybridization and electrification, lightweight materials, and more
advanced transmissions will contribute to the targeted goal. The majority of the
improvements, however, are expected to come from internal combustion engines. In
order to achieve the long-term targets, major improvements are necessary in the
combustion systems. For spark-ignition engines, achieving dilute combustion with
cooled exhaust gas recirculation or lean burn combustion is seen as a key pathway to the
enhancement of efficiency [4]. For diesel compression-ignition engines, minimizing
nitrogen oxide and particulate matter emissions without sacrificing thermal efficiency is
2
1.1The Engine Cycle
The combustion volume of a modern engine is formed by the cylinder head on the
top, the piston on the bottom, and the cylinder bore in the radial direction. The piston,
linked to the engine crank-shaft by a connecting rod and crank-arm, sweeps up and down
the cylinder bore as the engine crankshaft rotates. A schematic of the piston and crank
mechanism is shown in Figure 1-1. The cylinder volume with respect to the engine
crank-arm angular position, θ, follows the relation:
𝑉(𝜃) = 𝑉𝑑×
( 1
𝐶𝑅 − 1+ 0.5 ×
(
1 + 𝑙
𝑎− cos(𝜃) − ((
𝑙
𝑎)
2
− 𝑠𝑖𝑛2(𝜃))
1 2
))
(1.1)
where 𝑙 is the connecting rod length, 𝑎 is half the engine stroke length, 𝐶𝑅 is the engine
compression ratio, and 𝑉𝑑 is the cylinder displacement volume. The cylinder
displacement volume is the product of the bore area and the stroke length. The
compression ratio is the ratio of the maximum to minimum cylinder volume.
Conventionally, θ is referenced from the axis formed by the crank-shaft and the piston.
At a θ of zero crank angle degree (CAD), the piston is at its top-most position and the
cylinder volume is at a minimum. This position is known as the piston top-dead centre
(TDC) position. As θ increases to 180° CAD, the piston moves to its bottom-most
position and the cylinder volume is at its maximum. The relevant engine cycle is defined
by four of such strokes over two revolutions of the crank. In the intake stroke, an intake
valve is opened to draw in fresh air charge into the cylinder as the piston moves
downward (θ from 0 to 180° CAD). In the compression stroke (θ from 180 to 360°
3
the expansion stroke (θ from 360 to 540° CAD). Finally, the charge is expelled from the
cylinder by holding open an exhaust valve while the piston moves upward (θ from 540 to
720° CAD).
Figure 1-1: The Piston-Crank Mechanism and Engine Cycle
The compression and expansion of the in-cylinder working fluid, in the absence
of combustion, approximates the relation:
𝑝𝑉𝛾 = 𝑐𝑜𝑛𝑠𝑡𝑎𝑛𝑡 (1.2)
where 𝑝 is the pressure in the cylinder, 𝑉 is cylinder volume, and 𝛾 is the ratio of the heat
capacities 𝐶𝐶𝑝
𝑣. The conditions of one point of an adiabatic process can be used to define subsequent points by the relation:
𝑝0𝑉0𝛾= 𝑝1𝑉1𝛾 (1.3)
0 10 20
0 180 360 540 720
P
res
sure
(
b
ar
)
Combustion Motoring Spark
TDC BDC
TDC BDC TDC
0.0 0.5 1.0
0 180 360 540 720
V
o
lum
e
(L
)
Crank Angle Degree
Compression Expansion Exhaust Intake
IVC EVO IVO
4
The mean gas temperature in the cylinder is approximated by the ideal gas law:
𝑝𝑉 = 𝑚𝑅𝑇 (1.4)
In diesel engines, the compression ratios typically range from 16:1 to 19:1,
resulting in peak compression temperatures of 850 K – 1000 K. This high temperature is
utilized to vaporize and ignite the liquid diesel fuel. In spark-ignition engines lower
compression ratios, typically from 9:1 to 13:1, are used. The compression temperatures
are significantly lower and below the typical ignition temperatures of the fuel. Instead, a
spark discharge initiates a flame front that propagates through the cylinder volume. In
both cases, the heat released by the combustion of the fuel raises the pressure and
temperature of the working fluid. Expansion of the working fluid converts a part of the
combustion thermal energy into work, which is transferred to the engine crank-shaft. The
limit to the thermodynamic efficiency of this process is dependent on the degree of
expansion possible, aside from the inevitable energy losses [5]. Figure 1-2 plots this
efficiency limit for a range of compression ratios and specific heat ratios. In engine
designs that have symmetrical compression and expansion ratios, gains in cycle
efficiency by increasing the expansion ratio have a consequence of higher cylinder
pressures and temperatures. The high in-cylinder pressures may require stronger
mechanical designs, which translate into higher masses and larger bearing surfaces, at the
cost of weight and friction. For diesel engines, the high temperatures shorten the ignition
delay and potentially lead to higher NOx production and smoke production [6-7]. For
spark-ignition engines, the higher pressures and temperatures constrain the engine
5
Figure 1-2: Effect of Compression and Specific Heat Ratios on Ideal Cycle Efficiency
Figure 1-3 shows the pressure trace of an engine cycle plotted against the
instantaneous cylinder volume. The larger loop in the pressure-volume diagram is the
result of the departure of the expansion stroke pressure from the compression stroke
pressure as a result of combustion. The smaller loop arise from the pumping work
performed when throttling the intake to control the engine load and then subsequently
pushing the exhaust out against the atmospheric pressure. The net area of the two loops
is the total cycle indicated work. The term indicated work refers to the p-V work
performed by the working fluid. This is in contrast with brake work, which is work
available at the engine crank-shaft after friction and consumption by auxiliary engine
equipment (such as water pump, fuel pump, oil pump, valve cams, etc.) are subtracted
from the indicated work. A measure of the indicated cycle work normalized to the engine
displacement size is the indicated mean effective pressure (IMEP). The IMEP of an
engine is calculated by the expression:
𝐼𝑀𝐸𝑃 = ∫ 𝑝𝑑𝑉
720° 0°
𝑉𝑑
(1.5) 20%
40% 60% 80%
0 5 10 15 20 25 30
Id
eal
C
y
cle
Ef
fici
en
cy
Compression Ratio
γ = 1.40
γ = 1.25
6
Figure 1-3: P-V Diagram of an Engine Cycle
An analysis of the pressure trace can be performed to identify the changes in the
in-cylinder pressure as a result of the combustion process as opposed to the cyclic
compression and expansion processes. This is the apparent heat-release analysis [9].
Figure 1-4 shows an example heat-release trace. The heat-released rate in this example is
calculated using the expression:
𝑑𝑄
𝑑𝜃 =
1
𝛾 − 1[𝛾𝑝
𝑑𝑉
𝑑𝜃+ 𝑉
𝑑𝑝
𝑑𝜃]
(1.6)
where p is the cylinder pressure, V is the cylinder volume at crank angle θ, and Q is the
apparent heat-release rate. A derivation this expression can be found in the dissertation
of Jeftic [10].
The heat release can be integrated through the combustion process and
normalized to the total heat-release to result in a mass fraction burned function. The 0
5 10 15 20
0.0 0.2 0.4 0.6 0.8 1.0
Cy
lind
er
P
res
sure
(
b
ar
)
Volume (L) Expansion
Compression Intake
Exhaust
7
parameters of CA5, CA50, and CA95 are computed from the heat release to indicate the
crank angles of 5%, 50%, and 95% total heat-release. These parameters serve as
practical quantifiers of the timings of the start of combustion, the midpoint of combustion,
and the end of combustion.
Figure 1-4: Heat-Release Analysis of Combustion
1.2Dilute Combustion for Spark Ignition Engines
The conventional spark ignition engine utilizes air-fuel ratio control near the
stoichiometric ratio throughout most of its operation range (at high-load operation, fuel 0 5 10 15 0 10 20 30
300 330 360 390 420 450
E ff ec tiv e E xpan sion Rat io He a t-re le a s e Ra te (J/C A D)
Crank Angle Degree Heat-release rate Effective expansion ratio Spark timing Coil charging 0.0 0.5 1.0 0.0 0.5 1.0
300 330 360 390 420 450
8
enrichment may be used for charge cooling purposes to control knocking and exhaust
temperatures). At part-load operation, the throttling of the intake air for load control
creates a pumping work penalty in the intake stroke of the engine. The introduction of an
inert diluent such as recirculated exhaust can reduce this pumping work loss while
maintaining the stoichiometric air-fuel ratio requirement. A p-V trace showing the
differences in the pumping loop with exhaust gas recirculation is shown in Figure 1-5. At
the part-load condition shown, approximately 0.5 bar of vacuum is drawn during the
intake stroke. When a portion of the exhaust gases is added back to the air-fuel charge,
the amount of vacuum during the intake stroke reduces and the associated pumping work
penalty is lower.
Figure 1-5: Reducing Pumping Work with EGR 0.0
0.5 1.0 1.5 2.0
0.0 0.2 0.4 0.6 0.8 1.0
Cy
lind
er
P
res
sure
(
b
ar
)
Volume (L)
Expansion
Compression
Intake
Exhaust
0 % EGR
27 % EGR
Reduction in pumping loop
Intake pressure
9
If the requirement of stoichiometric operation is relaxed, additional fresh air can
be used as the diluent. The amount of dilution that can be applied in lean combustion
typically exceeds the amount possible with exhaust gas recirculation. In addition to the
reduction of throttling losses, lower combustion temperatures as a result of the heat sink
action diluent gases result in lower heat-transfer losses to the combustion chamber
surfaces.
It was previously shown in Figure 1-2 that the ideal cycle efficiency is a function
of the specific heat ratio γ. The value γ of air is 1.40 at ambient temperature and
decreases at higher temperatures (for example, 1.34 at 1000 K) [11]. The values of γ for
typical hydrocarbon fuels are lower than that of air, as can be seen in Table 1-1 [12].
Table 1-1: Specific Heat Ratios of Select Gas Species
Substance Name Molecular Formula
Heat Capacity Ratio @ 298 K
Heat Capacity Ratio @ 1000 K
Nitrogen N2 1.400 1.341
Oxygen O2 1.401 1.313
Water H2O 1.329 1.251
Carbon Dioxide CO2 1.289 1.181
Methane CH4 1.335 1.129
Octane C8H18 1.046 1.020
10
Mixtures of fuel and air have a specific heat ratio intermediate of air and the pure
fuel. A higher mixture average γ is achieved with a larger portion of air, which
directionally indicates the leanest possible combustion as being desirable. This effect is
also present with exhaust gas dilution, but the carbon dioxide constituent has a notably
lower specific heat ratio (γ = 1.29) than air.
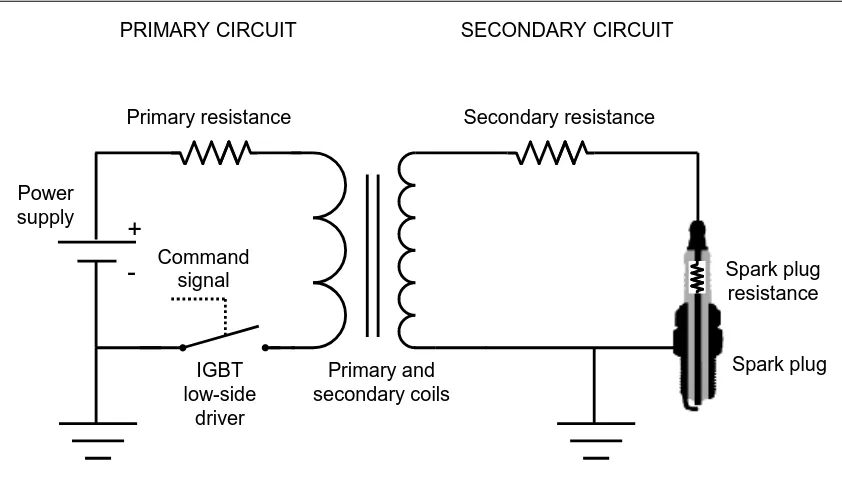
1.3Spark Ignition
A simplified spark ignition circuit representative of an inductive ignition system
is shown in Figure 1-6 [13]. This basic configuration has been widely used in
automobiles since the second half of the twentieth century. The switching that was once
accomplished by distributors and rotary contacts is now performed by electronic
insulated-gate bipolar transistors (IGBT).
Figure 1-6: Simplified Spark Ignition Circuit +
- Command signal
IGBT low-side
driver
Primary and secondary coils
Spark plug Power
supply
Primary resistance Secondary resistance
Spark plug resistance
11
The primary coil circuit can be modelled as a resistance and an inductance in
series [14], with the current, i, expressed by:
𝑖 = (𝑉
𝑅) [1 − 𝑒𝑥𝑝 (−
𝑅𝑡
𝐿)]
(1.6)
where V is the supply voltage, R is the coil resistance, and L is the coil inductance. The
cumulative energy input in the primary circuit can be expressed as the integration of the
product of the current and voltage:
𝐸 = ∫ 𝑖𝑉d𝑡
𝑡
0
(1.7)
The energy stored in the primary coil is expressed by:
𝐸 = 0.5𝐿𝑖2 (1.8)
The energy available in the secondary coil is considerably lower because of
imperfect magnetic coupling and the resistance in the secondary coil winding. The
overall transfer efficiency is in the order of 10 to 50% [14].
The model prediction of the primary coil current and a recorded current trace of
an ignition coil are shown in Figure 1-7, based on the nominal circuit parameters of V =
12.5 V, R = 0.55 Ω, and L = 5.8 mH. The energy supplied to the coil and the energy
stored are also shown. The supplied energy is higher than the stored energy. This is
attributed by Stone to the internal resistance of the coil drive unit, the resistance of the
12
Figure 1-7: Primary Coil Charging Characteristics
The induced voltage buildup in the secondary circuit upon the opening of the
primary circuit and the subsequent discharge is shown in Figure 1-8. The pre-breakdown
phase lasts a number of microseconds, where the voltage increases up to the point of
electrical breakdown in the spark gap. During the pre-breakdown phase, the small
capacitances present in the spark plug and secondary cable serve as local energy storage.
As the electric field strength in the gap increases during the voltage buildup, the gas
begins to ionize. The strong electric field rapidly accelerates free ions and the subsequent
collisions of the electrons generate more ion pairs in an avalanche mechanism [15]. The
breakdown phase is characterized by extremely short durations on the order of ~10 ns, a
high degree of ionization, and high currents on the order of ~200 A [5]. The next phase
of the discharge is the arc phase, which is characterized by a relatively low discharge
voltage, a hot cathode, and a degree of ionization on the order of 1 percent of the gas 0
4 8 12
0 2 4 6 8
P rima ry Cur re nt ( A )
Primary Coil Current
Measurement Model 0 100 200 300 400
0 2 4 6 8
Co il E n er g y ( mJ) Time (ms)
Coil Stored Energy
13
molecules. As the available current decreases over time, the discharge transitions to the
glow phase, where the lower current sustains a more diffuse discharge channel with a low
degree of ionization on the order of 0.01 percent [5].
Figure 1-8: Sample Voltage and Current Profiles for Conventional Spark Ignition
The discharge power and cumulative energy profiles of the example trace are
shown in Figure 1-9. The power during the breakdown phase is not accurately captured
by the electrical recording; the discharge power is on the order of ~100 kW to ~1 MW [5].
The discharge energy during the breakdown phase is low. Most of the discharge energy
is released during the long glow phase at a relatively low power on the order of tens of
watts. 10 100 1000 10000
1 10 100 1000 10000
S
ec
.
V
o
lt
age
(V
) Secondary Voltage
Glow
Pre-breakdown Arc
0 100 200 300
1 10 100 1000 10000
S
ec
.
Cu
rr
ent
(
mA
)
Time (µs)
Secondary Current
Glow
14
Figure 1-9: Discharge and Power Profiles for Conventional Spark Ignition
The discharge energy deposition forms a pool of radical species and an energetic
plasma core. The radical species and thermal energy initiate combustion reactions in the
gas mixture. The general criterion for a successful ignition event is that the heat release
by chemical reaction at the flame kernel surface exceeds the rate of heat loss. Thus the
attainment of a sufficient kernel size is important for successful ignition. The continuing
supply of energy to the flame kernel during the glow phase can aid the kernel growth rate
[15].
1.4Diesel Low-Temperature Combustion
Modern diesel engines employ direct injection of a liquid diesel fuel under high
pressures into the hot cylinder air. Depending on the fuel injection system type, engine
load, and boost level, the injection pressures may range from several hundred bars at low 0
20 40 60 80
0 1 2 3 4 5 6
Disc
h
ar
g
e
E
n
er
g
y
(
mJ)
Time (ms) Discharge Energy 0
20 40 60 80
0 1 2 3 4 5 6
Disc
h
ar
g
e
P
o
w
er
(
W
)
15
load to approximately 2,000 bars at high load for common-rail systems. Higher pressures
in the range of 3,000 bars can be achieved for unit injectors and hydraulically intensified
injection systems. The fuel is delivered through a series of nozzles 0.1 to 0.2 mm in
diameter arranged radially around the injector tip, which protrudes into the combustion
chamber. The spray is shattered by shear forces during the high-pressure injection
process, forming a dense cloud of fuel droplets [16]. The droplets undergo evaporation
under the compression temperatures as heat is transferred from the surrounding gas to the
liquid. The evaporated fuel is in part carried away from the droplet surface by diffusion
and convection, forming mixtures of decreasing richness radiating from the droplet
surface [17]. The fuel vapour when mixed with air undergoes the reaction chemistry
described in more detail in Appendix B. The ignition tends to initiate in zones where the
mixture is near stoichiometric. If ignition starts prior to complete evaporation of the fuel,
a stable flame zone may develop where fuel vapour is continuously transported into the
flame zone from the droplet surface and air is transported into the flame zone from the
surrounding gas mixture. This is referred to as a diffusion or non-premixed flame.
Under these conditions, the local stoichiometry may approach λ = 1 even though the
global stoichiometry may be significantly lean. The impact of near stoichiometric
burning is high flame temperatures leading to high NOx production. For example, while
the mean gas temperature of an engine cycle may not exceed 1500 K and is insufficient
for NOx formation, flame temperatures where λ = 1 are calculated to exceed 2600 K.
Dilution of the flame to λ = 2 reduces the flame temperature to under 2000 K, closer to a
low-NOx condition. Thus delaying the ignition to allow more time for evaporation of the
fuel and mixing with air or recirculated exhaust is a necessary measure to control NOx
16
1.5Trends of Advanced Combustion Engines
In comparison to compression ignition engines, spark ignited engines have lower
efficiencies at both low and high loads. The requirement to operate at stoichiometric
conditions to enable the three-way catalyst to treat exhaust emissions is a limitation to the
achievable efficiency [5]. If the requirement of stoichiometric operation is relaxed,
excess air can be used as the diluent and this would increase efficiency at low and
medium engine loads. The lean limit of conventional gasoline spark ignition and
combustion would however limit the practical dilution level. Alternative combustion
strategies such as homogeneous charge compression ignition or stratified charge
combustion address some aspects of this, however not without their own challenges for
implementation.
One strategy currently being adopted is to reduce the engine displacement and use
a turbocharger to maintain the engine power output. This leads to a shift in the engine
operating range to a higher level of specific power, thereby reducing the effects of the
pumping and frictional losses. A complementary technology is to employ variable
valve-train configurations, such as cam phasing, variable valve lift, or variable valve duration.
Knock is the term given to the noise associated with the auto-ignition of a portion
of the fuel-air mixture ahead of the propagating flame front [8]. In practice knock limits
raising the compression ratio to improve thermal efficiency because sustained
auto-ignition of the end-gas, when forceful enough, can lead to damage to the engine. The
knock tendency can be even more pronounced in turbocharged applications, where the
temperature and pressure of the initial charge is higher than in normally aspirated engines.
17
emission improvement in this application. Knock reduction using exhaust gas
recirculation can have advantages over the use of fuel enrichment (fuel economy penalty,
high hydrocarbon and carbon monoxide emissions) or delayed combustion phasing (fuel
economy penalty, high exhaust temperatures) [18].
A trend that is occurring in the field of internal combustion engines is the coming
together or merging of what were conventionally two different combustion systems, the
diesel compression ignition system and the spark ignition system [19]. The spark ignition
gasoline engine designs are adopting what were traditionally aspects of diesel engines,
namely turbocharging, direct fuel injection, and diluted combustion. The diesel engines,
on the other hand, are moving toward more moderate compression ratios and
homogeneous combustion to control NOx and smoke emissions.
This trend of engine technology assimilation is exemplified by the Mazda
Skyactiv-X generation of engines, announced in 2017 [20]. This engine uses a high base
compression ratio of 15:1, cam phasing to control valve timing, cooled exhaust gas
recirculation, and a clutched supercharger to boost the air charge. At higher engine loads,
the combustion strategy is conventional spark ignition and flame propagation. At lower
engine loads, the combustion strategy is what Mazda termed spark-controlled
compression ignition. It is a stratified combustion strategy where the bulk cylinder
charge is lean and a core charge near the spark plug is enriched to enable reliable ignition
and a sufficient combustion rate [21-22]. The bulk cylinder charge is sufficiently close to
auto-ignition that the temperature and pressure increase caused by the core charge
combustion initiates the compression ignition. In this fashion, a suitably rapid lean
18
the high base compression ratio, result in a higher degree of efficiency than a
conventional gasoline engine. A key aspect of the technology is the proper matching of
the air flow, fuel injection, and spark to achieve the proper stratification and reliable
ignition. The use of in-cylinder pressure sensors to control the combustion phasing and
19
2. CHAPTER II
OBJECTIVES
2.1Research Objective
The main objective of the research was to demonstrate strategies for the effective
delivery of ignition energy for combustion in advanced lean combustion and
high-dilution engines. A range of strategies using conventional and modified ignition coil
systems were used. The aim was to understand the effectiveness of the energy delivery
mechanisms and different energy profiles. The ignition strategies were applied in engine
tests to assess their ability to extend the lean and exhaust gas diluted gasoline combustion
limits with the aim of fuel efficiency improvement.
2.2Research Motivation
Chapter 1 has highlighted the increasingly strict standards for fuel economy that
the vehicle manufacturers much achieve across their fleet of vehicles. Advances in
engine technology will be required to meet the new requirements. Engine combustion
systems that operate substantially under lean combustion or high dilution are one
proposed solution to achieve higher engine efficiencies. In this case the performance of
the ignition system becomes crucial. A robust ignition process allows stable initiation of
the combustion with small cyclic variations. Advanced ignition systems can also be
advantageous in potentially reducing knock risk at high loads.
Key fundamental aspects that affect the ignition and flame development and the
controls available to influence them are shown as a schematic in Figure 2-1. The
20
fuel [23]. The fuel chemistry is typically not readily alterable, but can be modified by
chemical reformation through negative valve overlap combustion, EGR fuel reforming,
or plasma treatment. The temperature of the mixture is an important aspect affected by a
variety of variables. At the time of ignition, the charge temperature is a strong
determinant of the fundamental flame speed.
Figure 2-1: Fundamental Aspects of Combustion and Available Controls
In the engine, the actual flame speed is typically more than an order of magnitude
greater than the fundamental laminar flame speed. This is primarily attributable to the
effect of turbulence, which on a small scale increases the flame surface area and transport
rates and therefore the overall combustion rate. The turbulence typically scales with the
engine speed, thus enabling the combustion to complete across a range of engine speeds
[5]. The organized large-scale flow of the cylinder charge is important in generating
turbulence that can increase the burning rate [24]. With respect to the ignition event, a
flow across the spark gap is generally regarded as desirable in order to stretch the Turbulence and organized
flow
Fundamental flame speed
Ignition initiation
Stoichiometry Stratification, piloted pre-chamber Chemical reformation Negative valve overlap, plasma
Temperature Intake heating, EGR, compression ratio, ignition timing Turbulence Decay of organized flow
Organized flow Intake and combustion chamber design
Deposition volume Multi-pole, corona, laser, microwave Energy profile Capacitor, multi-spark, multi-coil
21
discharge channel and expose more of the charge volume to the discharge. However,
excessively high flow velocities can cause the discharge channel to blowout and reform
prior to the establishment of a stable flame kernel [25]. At conventional levels of energy,
motion of the charge induced by the discharge itself is typically small. There are ignition
systems such as the pre-chamber igniter which locates the ignition in a partially shrouded
volume and uses the ejection of the flame into the main chamber to generate turbulence
and increase the combustion rate [5].
The ignition initiation is traditionally achieved through a spark, although
advanced systems of such as microwave enhancement, corona discharge, or laser ignition
are in development. These systems can alter the energy deposition location, profile, and
quantity. The multi-pole ignition strategy uses multiple sites of closely located spark
ignited volumes.
In order to address the ignition issue under ultra-lean combustion or high dilution
combustion, it is necessary to combine the various controls available to produce an
effective combustion system. An example of deficiencies of the conventional ignition
system when operating at lean conditions is shown in Figure 2-2, abstracted from the
experimental tests performed in this work. The spark timing and measured average
combustion phasing of an engine are compared at three different stoichiometry levels,
ranging from lambda = 1.1 to lambda = 1.65. At the close to stoichiometric condition,
the span from the spark discharge to the CA5 point is 19 CAD. When the lambda is
increased, the spark timing is correspondingly advanced to maintain the same combustion
phasing. The spark timing is pushed to 53 CAD before TDC in the case of lambda = 1.65.
22
temperature at the time of ignition with the highly advanced ignition timing. This results
in a substantially long period from the spark to the CA5 point of 48 CAD.
Figure 2-2: Impact of Dilution of Spark Timing and Flame Development
The impact of the early spark and slow initial flame growth is seen in the
increased cyclic variations in the combustion. The pressure traces of fifty consecutive
engine cycles are shown in Figure 2-3 for the cases of lambda = 1.1 and lambda = 1.65.
A notable significant amount of variability is seen at lambda = 1.1, attributable to the
variability in the cylinder flow motion that strongly influence the early flame kernel
development process. This variability is greatly amplified in the case of lambda = 1.65
by the early spark and slow combustion rate. The outcome even includes two cycles of
partial misfires. While the engine can operate with a small percentage of misfires or poor
combustion cycles, the loss of efficiency, hydrocarbon emissions, and variability in 0
5 10 15 20 25 30
300 330 360 390 420
P
res
sure
(
b
ar
)
Crank Angle Degree
Impact of Dilution on Spark Timing and Flame Development
Spark timing
Lambda 1.65
1.37
1.10
CA5 CA50 Early flame
development Firing trace
23
torque are undesirable. Thus even though the average engine cycle is apparently
controllable by the ignition system, the individual cycle is subject to substantial
variability. A more direct and effective control of the ignition process would improve the
engine stability, extend the operating limits, and potentially improve the efficiency.
Figure 2-3: Comparison of Cycle-to-Cycle Variations 0
5 10 15 20 25 30
300 330 360 390 420
P
res
sure
(
b
ar
)
Crank Angle Degree 50 Engine Cycles
λ = 1.1
0 5 10 15 20 25 30
300 330 360 390 420
Crank Angle Degree 50 Engine Cycles
24
3. CHAPTER III
LITERATURE REVIEW
3.1Advanced Ignition Systems
There are a number of ignition and control architectures that can provide benefits
in efficiency and emissions compared to conventional stoichiometric spark-ignition
engines. However, they are typically constrained in engine operating load and have
control challenges. Homogeneous charge compression ignition (HCCI) is a form of low
temperature combustion where a premixed or homogeneous fuel-air mixture is
compressed to the point of auto-ignition in a process predominately controlled by
chemical kinetics [26]. Compared to spark ignition, HCCI combustion is faster and can
be operated with leaner mixtures at higher compression ratios. As HCCI lacks a direct
ignition trigger, the control of the combustion over a wide range of conditions is a severe
challenge [27]. The implementation of HCCI on diesel engine platforms are typically
achieved with the selection of a fuel with suitable volatility and reactivity, combined with
mixing, engine boost, and exhaust gas recirculation control. In spark ignition engine
platforms, the temperatures required to achieve auto-ignition typically cannot be achieved
with compression alone. The temperature of the charge is instead typically raised
through mixing with hot residual gases, for example by exhaust re-breathing during the
intake stroke or trapping of the exhaust with negative valve overlap [28]. A discussion of
a set of gasoline HCCI tests conducted on a diesel engine platform is presented in
25
A complement to the HCCI strategy is the spark-assisted compression ignition
combustion in which spark-ignition is used to directly initiate bulk auto-ignition and
HCCI combustion [28-31]. The spark assist functions by initiating a flame kernel that
propagates through a portion of the charge. The release of this combustion energy serves
to increase the temperature and pressure of the remaining charge to initiate the
auto-ignition. Experimental studies found the use of the spark can alter the phasing of the
auto-ignition effect and improve the cycle to cycle combustion stability [31]. The
application was most effective under moderate to high loads where the flame speed was
adequate to effect significant flame propagation. At the low load limit, however, the
spark-assisted combustion was not seen to be effective because of the excessively slow
flame speeds.
In both of the above combustion system configurations, the charge may be diluted
with excess air or exhaust gas to increase the efficiency, to lower the reactivity, and
control knocking and detonation. The potential for efficiency gains was analyzed on a
thermodynamic basis by Lavoie [4]. The results are shown in Figure 3-1 for naturally
aspirated operation and boosted operation for conventional combustion and advanced
combustion modes. In naturally aspirated operation, there is limited potential for
efficiency gains at the full load of 10.5 bar BMEP, as the full use of the fresh air intake
charge is required to meet the load requirement. At lower load levels, the efficiency of
the conventional throttled stoichiometric combustion mode decreased significantly. The
use of air dilution or EGR dilution maintained a high level of efficiency to the mid-load
region. The switching to an HCCI mode of operation was used in the analysis for low
26
increase from the baseline naturally aspirated air full dilution case starting at about 5 bar
BMEP.
Figure 3-1: Potential for Brake Thermal Efficiency Gains [4]
The thermodynamic analysis by Lavoie gives guidance to the magnitude of gains
that may be achievable from advanced combustion modes. The analysis does not,
however, address the practical challenges of ignition and combustion at those conditions.
As the reactivity and fundamental flame propagation speeds are lowered by dilution, the
combustion rate may have to be maintained through the use of enhanced charge motion.
Ignition under lean burn, EGR, and high flow conditions can be considerably more
challenging. Non-conventional technologies such as laser ignition, microwave generated
plasma, and corona aim to broaden the ignition limit and enhance the rate of combustion
[32-35]. Compared to conventional inductive system spark plugs, the potential
advantages include the ability to deposit higher amounts of energy, the reduction in heat
27
The principal mechanism of ignition through lasers is electrical breakdown
through multi-photon ionization and the inverse bremsstrahlung process (electrons gain
energy by absorption of laser radiation) [36]. Multi-photon ionization generates electrons
which are further accelerated by photon collision. The accelerated electrons then collide
with neutral molecules and ionize them, creating a plasma kernel. The high plasma
temperatures and pressures generate a shockwave observable in Schileren images. The
plasma then ignites the combustible mixture through conventional chemical and thermal
pathways. The breakdown process is enhanced by pressure due to increased collision
frequencies [37]. The laser energy is typically deposited in a few nanoseconds, with the
lower bound of pulse energies on the order of 5 – 10 mJ. To date, laser ignition systems
have been proven in demonstration combustion systems, for example 100 hours in a
stationary natural gas engine running at lambda = 1.8 ignited by a full-sized external
Nd-YAG laser [38]. A solid-state laser in the form factor of a spark plug, coupled to an
external pumping laser via fiber optics, was realized by Tauer [32]. The high costs of the
laser ignition systems are a current limitation to commercial utilization.
There is still much research activity using conventional or modifications of the
inductive coil and spark plug system hardware. The use of twin ignitions coils
discharging in an offset fashion to generate a continuous discharge without the typical
decay in the current intensity showed increased tolerance to exhaust gas recirculation,
which normally slowed combustion progress and reduced engine stability [39]. The
continuous nature of the discharge was observed to be better than repetitive restriking at
28
The coupling of a number of ignition coils to discharge simultaneously on one
spark plug can increase the discharge energy, with the discharge duration remaining
comparable. Work by Yu coupled four coils to enhance the discharge current [40-41].
The multiple coils were also used to generate high frequency discharges up to 20 kHz
when the primary coil voltages were raised to decrease the required charging duration.
The coupling of ten ignition coils increased the energy by a factor of five, from 50
mJ to 250 mJ, in work by Jung [42]. The multi-coil system was seen to increase the
stability at leaner conditions. The best results were seen when the leaner operation was
matched with enhanced in-cylinder turbulence. It was also found that when examining
the distribution of the spark energies delivered, the actual energy did not strongly
correlate with the cycle combustion characteristics. This indicated that a significant
portion of cycle to cycle variations were not directly relatable to the spark energy, but
other parameters such as flow conditions, fuel concentration, and temperature. A more
powerful spark system using repetitive short discharges (12 ns duration) coupled with a
semi-open cavity that generates turbulent jet-like early flame has been used to
demonstrate the ability to enhance lean-burn operation limits to achieve fuel economy
and NOx benefits [43].
3.2Electrical Breakdown
The process of electrical breakdown is caused by the various processes of
ionization. Under moderate electrical strength fields, a free electron may be generated by
collisions with background cosmic radiation. Under high strength fields, the ionization
may occur as a result of random collisions [44]. The liberated electron and positive ion
29
collisions. The cascading process produces an electron avalanche. The voltage at which
breakdown occurs is a function of the gas pressure and contact gap spacing. This
relationship is recognized as Paschen’s law [44]. A plot of the Paschen curve behavior of
air is shown in Figure 3-2. The breakdown voltage increases at higher pressures or wider
gap spacing due to the fact that electrons lose energy through more frequent collisions. A
high electrical field must be used to allow the electrons to gain sufficient energy between
collisions. The curve displays a minimal breakdown voltage and subsequent increase in
breakdown voltage at high vacuum conditions. The increase of breakdown voltage in this
region is caused by the lower probability of collision and subsequent ionization under the
rarified conditions.
Figure 3-2: Paschen Curve for Air, adapted from [44] 0.1
1 10 100
0.0001 0.001 0.01 0.1 1 10 100
Bre
ak
d
o
w
n
V
o
lt
age
(kV
)
30
3.3Transient Plasma Ignition
A highly transient form of plasma discharge is generated by single or repeated
nanosecond high voltage pulses. The discharge can provide effective electron impact
dissociation at relatively higher pressures for engine applications [45]. The pulse
durations typically are 1 to 10 ns in length and generated by high voltage DC generators
at 20 to 100 kV. The total energy delivery per pulse is also modest at the short durations.
The individual pulses can be coupled together to increase the energy delivered. However,
the repeat pulses increase the likelihood of breakdown discharge that result in the high
current electrode wear associated with thermal plasma sparks [46].
3.4Radio-Frequency Plasma
Discharges of a more sustained, continuous can be generated by electric fields
with alternate wave frequencies on the order of 1 MHz [47]. The non-equilibrium plasma
from the discharge is also a viable ignition method. Starikovskiy attributes the five
mechanisms through which a plasma discharge initiates and interacts with the flame
kernel. There are two thermal mechanisms: 1) gas heating from the energy deposition, 2)
inhomogeneous gas heating leading to perturbations and mixing, and three non-thermal
mechanisms: 3) the effect of ionic wind 4) the ion and electron drift in the electric field,
and 5) excitation, dissociation, and ionization of the gas by electron impact [48]. An
advantage of the radio-frequency plasma is the ability to continuously supplement the
ignition energy and affect the flame kernel. One of the key challenges of radio-frequency
corona ignition is to ensure the discharge occurs while avoiding breakdown discharge.
This is the challenge especially under high density conditions when higher voltages are
31
Development of the radio-frequency corona ignition technology toward
commercialization has been undertaken by a number of automotive technology
companies, the most notable being Federal-Mogul’s Advanced Corona Ignition System
and Borg Warner’s Ecoflash system [49-50]. Published results on research engines with
the Advanced Corona Ignition System have shown a larger initial ignition volume, faster
times to 5% mass burn fraction, and reduced cycle-to-cycle variations compared to
conventional spark ignition [47]. A more systematic follow-up study of the corona
ignition voltage and duration effects was also performed [51]. It was found that the
discharge parameters influenced the early phases of combustion up to the point of 5%
mass fraction burned, beyond which the flame propagation was independent of any action
by the igniter. This corresponded to about 300 µs at lambda = 1 and 500 µs at lambda =
1.4. The use of the highest discharge voltage below the arcing threshold was found to be
the most effective. When arcing occurred, the discharge was isolated to one arc path
instead of the normally four ignition zones generated by the four-pointed igniter. At
lower voltages or corona durations, ignition sometimes did not occur at all the igniter
32
4. CHAPTER IV
METHODOLOGY
This chapter provides a description of the research platforms used in is dissertation.
The tests are in general of two categories. The first used a combustion vessel to provide a
background gas mixture of controlled pressure and composition to study the electrical
discharge, ignition, and flame propagation. The second used a single-cylinder test engine
to study the processes in actual engine applications.
4.1Combustion Vessels
Combustion vessels of three different sizes and functions were used. A small 26
cm3 optical vessel was used for the majority of tests. This vessel was used for inert and
combustible charges up to 8 bar pressure. The layout of this CV1 vessel is shown in
Figure 4-1. The vessel has a cylindrical inner volume of 25.4 mm diameter and 51.8 mm
length. Two quartz windows provide an optical path through the vessel in the axis of the
cylindrical volume. The working fluid of the vessel is filled and discharged through two
1/4 inch ports. The vessel pressure is measured by a Kistler 4075A10 piezoresistive
absolute pressure sensor. The vessel is equipped with a pressure relief valve set at 8.3 bar.
An intermediate sized non-optical vessel of 113 cm3 was used for inert and
combustible charges up to 60 bar. This vessel was not instrumented with any optical
ports to reduce the design complexity and increase the margin of safety. The layout of
this CV2 vessel is shown in Figure 4-2. The vessel cavity is a cylindrical volume of 50.0
mm diameter and 57.6 mm length. The working fluid of the vessel is filled and
33
a Swagelok PTI-S-NG5000-22AQ pressure sensor. The dynamic pressure during a
combustion process was measured by an Omega DPX101 pressure sensor. The vessel is
equipped with a rupture disk designed to burst at 60 bar pressure.
Figure 4-1: CV1 Small Optical Combustion Vessel
Figure 4-2: CV2 Intermediate Combustion Vessel
A large optical vessel of 2.6 litres nominal volume was used to visualize the flame
34
the use of different flanges and adapters to accommodate various high-pressure fuel
injectors and igniters, was designed for a range of spray visualization and combustion
studies. The layout of this CV3 vessel is shown in Figure 4-3.
Figure 4-3: CV3 Large Optical Combustion Vessel
The main inner volume of the CV3 vessel is a cylindrical cavity of 150 mm
diameter and 115 mm length. Optical access is possible through five of the six
orthogonal faces of the vessel. The optical diameter provided by the quartz windows is
80 mm. The working fluid for the vessel is filled through a 3/8 inch port and discharged
through two 3/8 inch ports. The static pressure of the vessel was measured by a
Swagelok PTI-S-NG5000-22AQ pressure sensor. The dynamic pressure during a
combustion process was measured by a Kistler 6043A60 pressure sensor. For the tests
undertaken, the vessel was equipped with a rupture disk designed to burst at 60 bar
35
Three configurations of gas preparation were used for the charging of the
combustion vessels. When a pure gas was required, the vessels were charged directly
from the gas bottle using the bottle primary regulator. When the preparation of a certain
gas composition was required, such as a stoichiometric methane-air mixture, an
Environics 4040 gas divider was used. The gas divider contains four mass-flow
controllers that are used to precisely meter two or three sources into one output stream.
The output pressure of the gas divider is by design limited to approximately 1.2 bar. The
ignition tests conducted at 1 bar gauge pressure used solely the gas divider to pressurize
the combustion vessel. With test conditions at higher pressures, the output of the gas
divider was pressurized by a two-stage diaphragm pump. This setup was used to prepare
charges up to initial pressures of 6 bar gauge. A schematic of the gas preparation


![Figure 3-2: Paschen Curve for Air, adapted from [44]](https://thumb-us.123doks.com/thumbv2/123dok_us/1363214.1169132/47.612.129.511.373.633/figure-paschen-curve-air-adapted.webp)