FURTHER DEVELOPMENT OF SHIP ADDED RESISTANCES IN HEAD WAVES
IWAN ZAMIL BIN MUSTAFFA KAMAL
A dissertation submitted in partial fulfillment of the requirements for the award of the degree of Master of Engineering (Marine Technology)
Faculty of Mechanical Engineering Universiti Teknologi Malaysia
ABSTRACT
ABSTRAK
TABLE OF CONTENTS
CHAPTER TITLE` PAGE
SUPERVISOR’S DECLARATION i
TITLE PAGE ii
DECLARATION iii
DEDICATION iv
ACKNOWLEDGEMENT v
ABSTRACT vi
ABSTRAK vii
TABLE OF CONTENTS viii
LIST OF FIGURES xii
LIST OF TABLES xvi
LIST OF NOMENCLATURE xvii
LIST OF APPENDICES xx
1 INTRODUCTION 1
1.1 Background of Study 1
1.2 Problem Statement 2
1.3 Objectives of the Research 2
1.4 Scope of the Research 3
2 LITERATURE REVIEW 6
2.1 Regular Waves 6
2.2 The Velocity Potential 9
2.3 Pressure Contours and the Surface Profile 10
2.4 Energy in a Regular Wave 15
2.5 Encounter Frequency and Heading 17 2.6 Axes and Ship Motion Definitions 19 2.7 Simplified Equations of Ship Motion 23 2.8 Added Resistance and Involuntary Speed Loss
in Waves
19
2.9 Simple Theory for Added Resistance in Regular Waves
24
2.10 Korvin-Kroukovsky’s and Jacob’s Strip Theory
32
3 METHODOLOGY 34
3.1 Introduction 34
3.2 Experiment apparatus and facility 34
3.2.1 Towing Carriage 34
3.2.2 Wave Generator 39
3.2.3 Data acquisition and analysis system (D.A.A.S.)
40
3.2.4 Model Test Preparation 42
3.2.5 Model Test Particulars 43
3.3 Experiments Setup 45
3.5 Theoretical Prediction 49 3.5.1 Added Resistance in Regular Waves
– Momentum and Energy method
49
3.5.2 Strip Theory 53
3.5.2 Calculation of the Coupled Heaving and Pitching Motions by Strip
Theory
55
3.5.2.1 Basic Force Equation 58
3.5.2.2 Applied Force Equation 47
3.5.2.3 Motion Equation 60
3.5.2.4 Solutions of Equation of Motions
66
3.6 Computational Software method – Seakeeper® 68
3.6.1 Coordinate System 69
3.6.2 Computational Methods 70
3.6.3 Limitations and Guidelines of Seakeeper®
71
3.6.3.1 Underlying Assumptions 71
4 TOWING TANK EXPERIMENTS 73
4.1 Model Experiments 73
4.2 Blockage Correction 74
4.3 Experiment Results 77
5.1 Obtaining added resistance values from Seakeeper ®
81
5.2 Added Resistance Computations in Seakeeper®
91
6 PROGRAM DEVELOPMENT USING FORTRAN 77
94
6.1 Program Development 94
6.2 Mathematical formulation used in the program 98
6.3 Simpson Rules in the Program 98
6.4 Input and Output Results 106
7 RESULTS AND DISCUSSIONS 111 7.1 Added resistance in waves results from
experimental works
112
7.2 Comparison of Added Resistance between Experiment and Theoretical Results
117
7.3 Ship Generated Waves Results 126
8 CONCLUSIONS 131
8.1 Recommendations 134
REFERENCES 135
LIST OF FIGURES
FIGURE NO. TITLE PAGE
1.1 Research Project Flow Chart 4
2.1 Regular Waves 7
2.2 Constant pressure contour beneath a regular wave 11 2.3 Constant pressure contours beneath a 100 m wave: depth
100m
13
2.4 Regular waves pictured in space and time 14
2.5 Kinetic energy in a regular wave 16
2.6 Heading definitions 18
2.7 Axes and ship motion definitions 20
2.8 Definition of added resistance in waves 24 2.9 Added resistance response curve for a fast cargo ship in
regular waves
27
3.1 Towing Tank Basin 35
3.2 Towing Carriage 35
3.3 UTM Marine Technology Laboratory Layout Plan 36 3.4 A tanker model locked to gimbals during towing 39
3.5 Wave generator flap 40
3.6 Data Acquisition and Analysis System 42
3.8 The arrangement of air struts and towing guide with ship model
46
3.9 The block diagram of Data Acquisition Analysis System (DAAS)
47
3.10 Representation of underwater hull section shapes by an infinite cylinder
54
3.11 Seakeeper® User Coordinate System and view Windows are the same as for Maxsurf®
69
3.12 Wave direction is measured relative to the vessel track and is given the symbol μ. Thus following waves are at μ = 0°; starboard beam seas are 90°; head seas 180° and port beam seas 270°.
70
4.1 Towing Tank and Model Dimensions 75
4.2 Sample of results obtained from DAAS for total resistance of the model for certain speed.
78
4.3 Experiment results for five Froude number before correction
79
5.1 Bodyplan of the Product Tanker 7698 82
5.2 Size surfaces window 83
5.3 Frame of reference window 84
5.4 Finished Section, Buttocks and Waterline plotted in Maxsurf® viewed in Perspective, Profile, Plan and Body
85
5.5 Input data window 86
5.6 Measure hull window 87
5.7 Mappings for model 7698 87
5.8 Input Data window for Vessel Type 88
5.10 Damping factors window 90
5.11 Environment window 90
5.12 Analysis method window 92
5.13 Graph window showing the added resistances result in Seakeeper®
93
6.1 Program displaying the data for selecting the added mass coefficient and amplitude ratio
97
6.2 The cross section showing the waterlines and the axes of z and y.
98 6.3 The distance y1, y2 and y3 shown from the axis to the
curves.
100
6.4 The breadth y1, y2, y3, y4, y5 and yn at each section from
1, 2, 3, 4, 5… n.
101
6.5 The breadth y1, y2 , y3,y4 at each section at an equal
interval, h.
103
6.6 Example of using Simpson’s first rule and second rule for 9 and 7 ordinates.
104
6.7 An example of an input data created in Notepad based on 7698 Tanker offset data.
108
7.1 Experiment results of Added resistances for five Froude number after correction
113 7.2 Theoretical results from Seakeeper® using Gerritsma and
Beukelman I
114
7.3 Theoretical results from Seakeeper® using Gerritsma and Beukelman II
115
7.4 Theoretical results from Seakeeper® using Salvesen method
116
7.5 Theoretical results using Joosen method 117
7.6 Comparison of experimental and theoretical added resistance at Froude number 0.166
118
7.7 Comparison of experimental and theoretical added resistance at Froude number 0.21
7.8 Comparison of experimental and theoretical added resistance at Froude number 0.25
120
7.9 Comparison of experimental and theoretical added resistance at Froude number 0.27
121
7.10 Comparison of experimental and theoretical added resistance at Froude number 0.28
122
7.11 The wave profile in time histories for wave length 1.688 m and speed 0.9096 m/s
126
7.12 The energy dissipated by ship waves at speed 0.9096 m/s 127
7.13 The energy dissipated by ship waves at speed 1.092 m/s 127
7.14 The energy dissipated by ship waves at speed 1.274 m/s 128
7.15 The energy dissipated by ship waves at speed 1.455 m/s 128
LIST OF TABLES
TABLE NO. TITLE PAGE
2.1 Salient characteristics of waves 8
2.2 Three linear displacements notation, units and position 21 2.3 Three angular rotations notations, units and positions 21
2.4 Three locations for axes for rolls, pitches and yaws 22
3.1 Model no. 7698 Main Particulars 44
6.8 Comparison result between FORTRAN 77 and Microsoft Excel.
105
7.1 Corrected Froude number 113
8.1 Percentage difference of added resistance value between experimental and theoretical
133
LIST OF NOMENCLATURE
Symbols
yy
A - Coefficient of added mass moment of inertia for pitching
motion
a - Virtual mass, or virtual mass moment of inertia
z
a - Added mass for heaving
B
- Coefficient of pitch damping momentn
B - Waterline breadth for nth section
b - Coefficient for damping force or damping moment
n
b - Damping coefficient per unit length
C - Coefficient for pitch restoring moment
c - Coefficient for restoring force or restoring moment
E - Wave energy per unit area of free surface
w
h - Height of wave
yy
I - Mass moment of inertia for pitching
k - Wave number
yy
k - Radius of gyration for pitching
LBP - Length between perpendiculars
w
L - Wavelength from crest to crest
s
L - Length of ship equivalent to LBP
AW
R - Mean resistance increase in waves, that is, resistance in
e
T - Period of encounter
w
T - Wave period
z
T - Natural period (in smooth water) for heaving θ
T - Natural period (in smooth water) for pitching
φ
T - Natural period (in smooth water) for rolling
u - Horizontal component of water velocity vertical component
of water velocity w
V - Wave velocity or celerity
z - Heaving motion
a
z - Heaving amplitude
β - Sectional area coefficient
ε - Phase angle between motions and waves
1
ε - Phase angle between wave motion and exciting force (or
moment) 2
ε - Phase angle between exciting force (or moment) and motions
ζ - Instantaneuous wave elevation
a
ζ - Wave amplitude
a
ζ - Apparent wave amplitude
θ - Pitch angle
a
θ - Pitch amplitude
μ - Heading angle
e
ω - Frequency of encounter
w
ω - Wave frequency
z
LIST OF APPENDICES
APPENDIX TITLE PAGE
A Resistance test results obtained from DAAS 138
B Resistance Test Summary Tables 164
C Offsets and Input data 169
D Program Strip Theory Flow Charts 171
E Wave data, Added Mass Coefficient and Amplitude Ratio Input Data
189
F Added mass coefficients for two-dimensional floating bodies in heaving motion
192
G Amplitude ratiosA for two-dimensional floating bodies in heaving motion
194
H Program ‘STRIP THEORY’ Result 196
I Program ‘STRIP THEORY’ Source Codes 205
J Photo shots during model test 228
K Wave surface profile time histories 236
L Table of wave amplitude averages 289
N Mathematical formulation used in the program – an example on Coupled heaving and pitching motion calculations in regular waves using strip theory.
INTRODUCTION
1.0 Background of Study
Added resistance in waves is another component of ship’s resistance. It is
sometimes being misunderstood as wave making resistance. Basically, added resistance
in waves is another partial component of the resistance that responsible for speed
reduction in a seaway especially in high seas condition. Therefore added resistance
prediction represents an important challenge for ship-owners due to its economic
implications in terms of choice of engines, fuel consumption and route-time evaluation.
Design offices should consider seriously this problem already in the early stages of the
design.
Usually, the performance evaluation of a ship in a seaway is primary based on the calm
water resistance without properly considering the weather conditions prevailing on the
operating route. Even if the calm water resistance is used as a first estimation of the
power required, an allowance is added to this value of the resistance to consider the
effect of the environment. Therefore in this study it is aim to look into the comparison of
the various theoretical method with the towing tests method as a continuous effort from
In carrying out these experimental and theoretical predictions, several issues will
be addressed as follow:
i. What is the influence of the ship speeds and the wave frequencies on the
added resistances in waves?
ii. How accurate is the present method of theoretical prediction of added
resistance in waves? Is it reliable?
iii. What is the relationship of ship generated waves to the added resistance in
waves? If there is any, can we use this relationship to predict the added
resistance in waves?
3.0 Objectives of the research
The research work is carried out in order to achieve the following objectives:
i. To evaluate the difference and accuracy of added resistance prediction of a 100
m product tanker between theoretical and model experiment.
ii. Develop a computer program in order to calculate the added resistances in waves
using FORTRAN 77.
iii. Investigate the influences of the following parameters to added resistance due to
waves either from the speed of the vessel and the also the wave frequencies
(wave length)
iv. Investigate the relationship of ship generated waves with the added resistance in
waves as ship dissipates energy to the waves created by it at aft and energy is
be used as to compare the results obtained experimentally and validate the
computed results.
4.0 Scopes of the research
The scope of the research is listed as follows:
i. Conduct literature research on ship added resistances due to head waves mainly
on the familiarization on the Strip Method and Potential Flow Theory.
ii. Develop a computer program to calculate the ship added resistance in waves
using strip theory to generate the hydrodynamic coefficients, ship’s heave and
pitch motion and using momentum and energy method or radiated energy
method in order to get the added resistance values.
iii. Conduct experiments using the tanker model in a towing tank for calm water
resistance test.
iv. Conduct experiments using the tanker model in a towing tank in regular waves.
v. Determine added resistance due to waves by subtracting resistance in waves to
the resistance in calm water
vi. Familiarization of Maxsurf software namely Maxsurf Pro® for inputs of
linesplan and hulls particulars and Seakeeper® for predicting added resistances
due to waves.
vii. Estimate added resistance due to waves by using theoretical method using
SEAKEEPER namely Gerritsma and Beukelman’s method and Salvesen’s
method.
viii. Validate the theoretical prediction results with the model experiment test results.
This topic discusses the approach of the project that has been taken to ensure the
objectives of the project will be achieved. It also presents the project flow chart.
Basically the project begins with deciding the objectives and the scopes. This is done by
having discussion with the project supervisor namely, Ir. Dr. Mohamad Pauzi Abdul
Ghani.
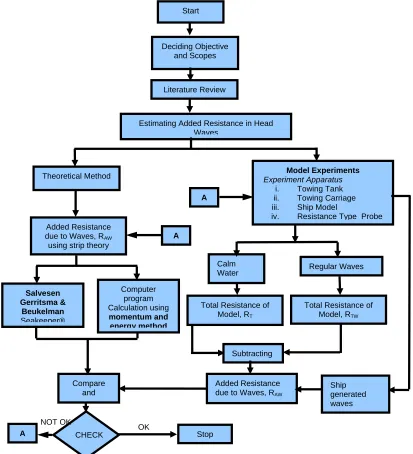
Figure 1.1: Research Project Flow Chart
Calm Water Theoretical Method Literature Review Deciding Objective and Scopes
Estimating Added Resistance in Head Waves
Start
Total Resistance of Model, RT Added Resistance
due to Waves, RAW using strip theory
Salvesen Gerritsma & Beukelman Seakeeper® Subtracting Model Experiments Experiment Apparatus
i. Towing Tank
ii. Towing Carriage iii. Ship Model iv. Resistance Type Probe
Computer program Calculation using momentum and energy method Regular Waves
Total Resistance of Model, RTW
review are done to select and pinpoint the approach of on how the research to be done.
Basically, as agreed in this research project, there are two approaches in determining the
added resistances of a ship in head wave, which are experimentally and theoretically. In
experiment works, both resistances are taken in calm water and in regular waves, and
concurrently the ship generated waves are taken by using resistance probe.
Theoretically, few methods are chosen to predict the added resistances in head waves,
and here two approach are determined which is using computational software namely
Seakeeper® and also a program will be developed using one of the method in predicting
added resistances in waves.
The flow chart of this research project is available in figure 1.1. The
experimental or theoretical prediction works will be repeated if any discrepancy found