ABSTRACT
WALKER, KATHERINE DIANNE. Development of a Wearable Device for Dogs to Determine and Monitor Arousal Levels Using Pulse Transit Time Estimations. (Under the direction of Dr. Alper Bozkurt.)
Development of a noninvasive device to obtain a quantitative and objective arousal
measure-ment for dogs would be very useful in both the clinical and the home environmeasure-ments. Traditionally, arousal evaluation in dogs has required visual examination by either a trained observer or a
knowl-edgeable pet owner. By observing the dog’s physical response, such as posture, activity level and
overall temperament, a qualitative assessment of a dog’s arousal level can be determined. Within the last decade, however, the rapid technical development of portable electronics and wearable
devices, particularly in the health space, has accelerated the development of devices with the
abil-ity to continuously monitor physiological characteristics by measuring the body’s electrical and chemical physiological signals. Two physiological signals in particular, electrocardiogram (ECG)
and photoplethysmography (PPG), are promising candidates for providing a more quantitative
and objective method of determining a dog’s state, mainly because these signals can be captured noninvasively and with only a few pieces of hardware. ECG and PPG measurements can be used to
calculate a metric known as Pulse Transit Time (PTT), which is known from previous research to be
correlated with blood pressure. Since changes in blood pressure are correlated with arousal, it is likely that PTT will also be affected. This thesis outlines our efforts towards the development of a
wearable, noninvasive device capable of estimating PTT in order to help clinicians and pet owners
© Copyright 2017 by Katherine Dianne Walker
Development of a Wearable Device for Dogs to Determine and Monitor Arousal Levels Using Pulse Transit Time Estimations
by
Katherine Dianne Walker
A thesis submitted to the Graduate Faculty of North Carolina State University
in partial fulfillment of the requirements for the Degree of
Master of Science
Electrical Engineering
Raleigh, North Carolina
2017
APPROVED BY:
Dr. David L. Roberts Dr. H. Troy Nagle
Dr. Barbara Sherman External Member
DEDICATION
BIOGRAPHY
Katherine (Katie) Walker received B.S. degrees in Electrical Engineering, Computer Engineering and Applied Mathematics from North Carolina State University in 2015. In the summer of 2014,
she began working as an undergraduate research assistant in Dr. Alper Bozkurt’s Integrated Bionic
MicroSystems Laboratory (iBionicS Lab), where she continued to work during her journey towards a Masters degree. Her research in the iBionicS Lab included contributing towards the development
of an interface to incorporate electronic sensing into canine training and physiological monitor-ing. Katie is a recipient of a merit fellowship from NC State University’s Electrical and Computer
ACKNOWLEDGEMENTS
I would like to thank my advisor and my committee for their advice and guidance throughout this journey: Dr. Alper Bozkurt, Dr. Barbara Sherman, Dr. David Roberts, and Dr. Troy Nagle. You
are fantastic mentors! You have helped me navigate the technical and logistical roadblocks and
supported me every step of the way. I have learned so much during our research discussions, and I’m very grateful to have had the opportunity to work with you. Dr. Bozkurt, when you welcomed
me into your lab in the summer of 2014, I had no idea how much I would learn over the course of the next three years. You gave me the opportunity to combine two of my passions–dogs and helping
others–while contributing to some really cool research. Thank you!
This research has been made possible thanks to funding from the National Science Foundation (NSF) under the award 1329738 and the NSF Engineering Research Center for Advanced Self-Powered
Systems of Integrated Sensors and Technologies (ASSIST). I would also like to thank the Electrical
and Computer Engineering Department at NC State for awarding graduate fellowship to me which allowed me to thrive in graduate school and pursue my research interests without a huge financial
burden.
I would also like to thank my family and friends for their support throughout this long and enduring process. You have celebrated my successes with me and shared my heartache when things
didn’t go according to plan. Throughout the years, you never stopped encouraging me to stick with
it to the very end. You have loved me unconditionally and reminded me of that when I needed it the most. I wouldn’t be the person I am today without your love and support, so thank you and I love
you!!
I would like to thank my coworkers and friends at the iBionicS Lab, Ciigar Lab, the ASSIST center, as well as those in various departments at NC State, particularly Electrical and Computer
Engineering, Biomedical Engineering, Computer Science and the College of Veterinary Medicine.
Thank you for the technical help and for sharing your laughs and (sometimes frequent) struggles with me during our graduate school journeys. Specifically, I would like to thank to Rita Brugarolas
Brufau because she showed me the ropes of graduate research. I have learned so much from you,
and I’m so thankful I had the opportunity to work with all of you!
I would like to thank the canine participants of my thesis experiments as well as their owners.
Needless to say, without their participation and cooperation, these experiments would not have been possible. In particular, I would like to give a special shout-out to my dog Prailene. She endured
the brunt of the equipment testing and served as guinea pig #1 for each experiment. She’ll never
know or understand how critical her role was in this thesis! The only part she will really remember is the seemingly endless supply of peanut butter mini Zuke’s she received in return for her patience
Finally, I would like to thank Luke, the love of my life, for his unconditional love and support
throughout this adventure. You certainly did not sign up for any of my headaches, mood swings, or sleepless nights that accompanied my journey towards graduation, but you handled each and every
curveball with grace, strength and love, and I am so grateful for that and for you. I cannot wait to see
TABLE OF CONTENTS
LIST OF TABLES . . . vii
LIST OF FIGURES. . . .viii
Chapter 1 INTRODUCTION . . . 1
1.1 Background . . . 3
1.1.1 Defining PTT . . . 3
1.1.2 Overview of Our System: Our Group’s Previous Work with ECG and PPG . . . . 4
1.2 Objectives and Outline . . . 4
Chapter 2 DEVELOPMENT OF A PPG PROBE FOR PTT ESTIMATION . . . 6
2.1 Introduction . . . 6
2.2 Materials and Methods . . . 7
2.3 Results . . . 11
2.4 Discussion and Conclusions . . . 15
Chapter 3 PTT ESTIMATIONS AS AN AROUSAL MEASUREMENT. . . 17
3.1 Introduction . . . 17
3.2 Materials and Methods . . . 19
3.3 Results . . . 23
3.4 Discussion and Conclusions . . . 36
Chapter 4 CONCLUSIONS AND SUGGESTIONS FOR FUTURE WORK . . . 38
BIBLIOGRAPHY . . . 40
APPENDIX . . . 44
Appendix A SUPPLEMENTAL WORK AND FIGURES . . . 45
A.1 Additional PPG Probe Results . . . 45
A.2 SQI Calculations for PTT Experiments . . . 50
LIST OF TABLES
Table 2.1 SQI calculations for the probe and light pipe configurations tested . . . 14
Table 3.1 Dog breed and age information . . . 22 Table 3.2 Dog stimuli information . . . 22 Table 3.3 Mean heart rate and PTT values for baseline and stimuli data for each dog . . . 27 Table 3.4 Results of two-sample t-test . . . 30 Table 3.5 Results of paired t-test . . . 30
LIST OF FIGURES
Figure 2.1 Block diagram for the hardware used for PPG data collection . . . 8
Figure 2.2 One of the PPG probes used during experiments . . . 8
Figure 2.3 The three configurations of light pipes used during experiments: (a) clear light pipe setup, (b) white light pipe setup, and (c) dual light pipe setup . . . 10
Figure 2.4 Placement of PPG probe on dog . . . 11
Figure 2.5 PPG signal captured using 1cm probe with clear light pipe placed over pho-todetector . . . 12
Figure 2.6 PPG signal captured using 1.5 cm probe with clear light pipe placed over photodetector . . . 12
Figure 2.7 PPG signal captured using 2 cm probe with clear light pipe placed over pho-todetector . . . 13
Figure 2.8 Adaptive template matching for the SQI computing algorithm . . . 15
Figure 3.1 Heart rates for 11 dogs placed in open field, where period 5 indicates thun-derstorm sound playback, reproduced with permission[37] . . . 18
Figure 3.2 Data collection platform for ECG and PPG . . . 20
Figure 3.3 Chest strap for housing electrodes for ECG and securing the PPG probe in position . . . 21
Figure 3.4 Placement of ECG and PPG measurement equipment on dog . . . 21
Figure 3.5 Baseline and stimuli heart rate data for all dogs . . . 24
Figure 3.6 Snapshot of raw data used for PTT calculations for Dog 1 baseline . . . 25
Figure 3.7 Snapshot of raw data used for PTT calculations for Dog 2 stimuli . . . 25
Figure 3.8 Baseline and stimuli PTT data for all dogs . . . 26
Figure 3.9 Baseline and stimuli PTT data for Dog 1 . . . 28
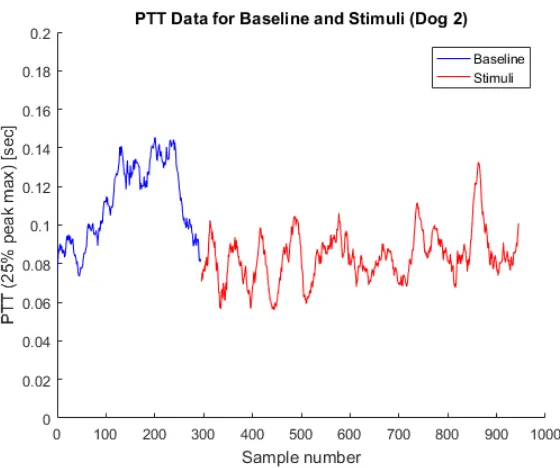
Figure 3.10 Baseline and stimuli PTT data for Dog 2 . . . 28
Figure 3.11 Baseline and stimuli PTT data for Dog 3 . . . 29
Figure 3.12 Baseline and stimuli PTT data for Dog 4 . . . 29
Figure 3.13 Sensitivity calculations for various window sizes where the detection thresh-old is equal to the mean of the entire data set for each dog . . . 31
Figure 3.14 Specificity calculations for various window sizes where the detection thresh-old is equal to the mean of the entire data set for each dog . . . 32
Figure 3.15 Changes in specificity calculations for various window sizes when the latter half of baseline data is used, essentially applying a baseline cooldown period for the dog to return to a relaxed state . . . 32
Figure 3.16 Baseline and stimuli PTT data for Dog 1 . . . 33
Figure 3.17 Baseline and stimuli PTT data for Dog 2 . . . 34
Figure 3.18 Baseline and stimuli PTT data for Dog 3 . . . 34
Figure 3.19 Baseline and stimuli PTT data for Dog 4 . . . 35
Figure 3.20 Baseline and stimuli data set durations for each dog . . . 35
Figure A.2 PPG signal captured using 1cm probe with white light pipe placed over pho-todetector . . . 46 Figure A.3 PPG signal captured using 1.5cm probe with white light pipe placed over
photodetector . . . 47 Figure A.4 PPG signal captured using 1.5cm probe with dual light pipe configuration . . . 47 Figure A.5 PPG signal captured using 2cm probe with light pipes placed over LED and
photodetector . . . 48 Figure A.6 Zoomed in view of PPG signal captured using 2cm probe with dual light pipe
setup . . . 49 Figure A.7 PPG signal captured using 2cm probe with white light pipe placed over
CHAPTER
1
INTRODUCTION
In addition to providing companionship to humans, dogs also assist us with tasks such as search and rescue, narcotic and explosive detection, and even providing alerts at the onset of medical
problems or events. Their skills and sensory perception enable them to detect changes in situations
or environments sooner than humans or human-manufactured devices and then alert the owner or handler of an observation or of a potential danger. However, in the opposite direction, a handler’s
recognition of an arousing situation for a dog may not be achieved as quickly or reliably. Traditional
methods of evaluating arousal in dogs have required either a trained observer or a knowledgeable pet owner to assess and determine. Therefore, visually examining the dog’s physical response, such
as posture, activity level and overall temperament, has been the only way for determining whether a
dog is aroused. Fortunately, the rapid technical development of portable electronics and wearable devices over the last decade—particularly in the health space—has accelerated work towards having
the ability to continuously monitor physiological characteristics from both humans and animals by
measuring the body’s electrical and chemical physiological signals. Indeed, a device with the ability to obtain quantifiable physiological measurements indicating whether a dog is calm or excited,
With the emergence of health wearables, we can now easily monitor and analyze physiological signals like heart rate and respiratory rate by examining electrocardiogram (ECG) and
photoplethys-mography (PPG). ECG contains information about the electrical activity of the heart, and PPG
contains information about changes in blood volume. These two physiological signals are relatively easy to sense and measure; minimal hardware is needed and the noninvasive nature of the sensors
increases overall comfort of the test subject.
Mental, physical and emotional stimuli can trigger the body to transition to a state of arousal and produce a physiological response. For example, upon exposure to either physical exercise or
fear, the sympathetic nerve endings release norepinephrine. This causes the heart rate to increase
and the veins and arterioles to contract, which can cause a rise in arterial pressure[1]. Increased heart rate and blood pressure provide blood supply to the muscles which might need to respond to
the physical exercise or a flight from danger (i.e. stress response, “fight or flight”)[1]. Essentially, exposure to stimuli can cause the body to transition into a state of arousal, which consists of an increased heart rate and blood pressure, an elevated state of sensory alertness as well as a readiness
to take physical action if necessary[1–4]. Thus, since a broad range of stimuli can lead to such a state, the term “arousal” is used throughout this thesis to describe the body’s response to both positive stimuli, e.g. excitement or exercise, as well as negative stimuli, e.g. fear or anxiety.
In humans, it is known that stressful stimuli, both chronic and acute, affect blood pressure [5]. Unfortunately, blood pressure cannot be comfortably measured continuously in a noninvasive manner using the traditional means of a blood pressure cuff. The equipment needed for a cuff-based
measurement is bulky and awkward and can interfere with daily activities. Alternative methods have been investigated for measuring blood pressure; a particularly promising way is via a metric
called Pulse Transit Time (PTT)[6–9].
Previous PTT studies in humans have investigated PTT for the primary purpose of estimating blood pressure via cuffless methods. While PTT calculation methods typically agree on the initial
time point of interest as the R-peak of the ECG waveform, there are various points along the PPG
waveform where the termination point of interest has been debated and studied. These various methods will be discussed more thoroughly in Section 1.1.1. Essentially, PTT is inversely related to
While it has been examined in humans, PTT has not been thoroughly examined in dogs, par-ticularly as a method for determining arousal level. The previously mentioned studies on humans
have shown correlation between PTT and blood pressure as well as correlation between blood
pressure and stress[13–20]. And while this thesis does not focus on estimating blood pressure, the relationships between arousal and blood pressure and between blood pressure and PTT are key to
the work presented here. By connecting these two relationships, we show promising results from
our pilot experiments that a quantitative measurement can be obtained and allude to whether a dog is exhibiting an aroused state.
1.1
Background
1.1.1 Defining PTT
Hey et al. defines PTT as “the time needed by a pulse wave to exit the heart and reach the PPG
measurement site”[9]. While PTT calculations typically use the timing of ECG R-peak as the first point of interest, various definitions exist for which point along the PPG waveform should be taken
as the second point of interest[8, 21]. One such method of calculating PTT is based on Pulse Arrival Time (PAT), which is the delay between the R-peak of the ECG waveform and the arrival of the pulse wave at the PPG measurement site[22]. PAT has been investigated and found to consist of PTT in addition to the pre-ejection period (PEP)[20, 21, 23]. The concern with the metric including PEP is that PEP varies with the electromechanical properties of the heart, so it can affect the arrival time of the pulse wave[7, 20, 23]. In fact, it has been shown that PAT does not correlate as well with diastolic and mean blood pressure, probably due to the effects of PEP[7, 20]. However, despite these influences, PAT has been shown to correlate well with systolic blood pressure[7]. As blood pressure increases, the blood travels faster to the PPG measurement site, decreasing PAT[22]. Furthermore, PAT is popular in the literature as a noninvasive PTT estimate most likely because of its convenience
of measurement[7, 23]. In fact, the ease of measurement was the primary motivation behind utilizing this method to calculate PTT in our experiments.
Several points along the PPG waveform have been studied in order to calculate PTT, where some of the popular ones include: the peak maximum, the peak minimum, 25% of the way up the rise, the
point at which the maximum slope occurs, the peak of the first derivative, time point approaching
30% of the peak’s first derivative value, the peak of the second derivative, the intersection of the tangent of the peak of the first derivative with the time axis, and the zero crossing of the first
first derivative, the intersection of the tangent of the peak of the first derivative with the time axis, and the zero crossing of the first derivative before the pulse wave. However, for the experimental
analysis of our pilot study, we followed Townsend’s recommendation and marked the PPG peak
maximum, minimum and 25% of the way up the rise primarily because of the convenience and simplicity of these methods[24].
1.1.2 Overview of Our System: Our Group’s Previous Work with ECG and PPG
In our previous research, we have obtained ECG data as well as PPG data from dogs[25, 26]. However, some minor adjustments and upgrades were made to our system for the completion of the
experi-ments discussed in this thesis. Essentially, our system consists of ECG electrodes which connect to
the inputs of an analog front end and the front end’s output is sampled by the BeagleBone Black (BBB) microcomputer[27]. The BBB transmits the sampled values over Wi-Fi to a laptop connected to the same network where the values are then saved for post hoc analysis.
Each ECG electrode contains an array of ten gold spring-loaded pins. These pins are intended to thread through the hair in order to achieve better skin contact and therefore a higher quality signal.
Before being placed on the dog, the electrodes are covered with electrolyte gel in order to further
reduce the impedance contributed by the canine fur. The electrodes are connected to electrode leads via snap connectors, which are used in several commercially available devices.
Previously, our PPG sensing was achieved using an analog photodetector chip which was
con-nected to the BBB’s on-board analog-to-digital converter (ADC). However, our group’s research in a separate but related area involved measuring PPG for the purpose of monitoring respiratory disease [28, 29]. In those experiments, we used a commercially available Si1143 proximity/ambient light sensor (Si1143, Silicon Labs)[30]. One upgrade to our canine physiology measurement system was to replace the analog photodetector with this light sensor. This chip’s capability and contribution to
our system will be discussed in more detail in Chapter 2.
The data collection platform is discussed in more detail in the Introduction sections of Chapters 2 and 3.
1.2
Objectives and Outline
This thesis presents the results of a pilot study in which PTT estimates in dogs were obtained
using our wearable electronics platform. While it should be noted this study examined only a small
and evaluation of three probes with three light pipe configurations for each probe is described. The results of the experiments are presented and discussed. Conclusions are formed which aid in
choosing the 1.5 cm PPG probe for the experiments discussed in Chapter 3.
In Chapter 3, the PTT experiments and results are discussed. In these experiments, our system collects baseline PTT data with the dogs placed in a calm environment, such as the home. On a
separate occasion, the dogs are exposed to certain stimuli, which is based on the owner’s knowledge
of what may arouse the dog. The results from baseline trials are compared to those from stimuli exposure for each dog. A simple potential arousal detection scheme is proposed. Additionally, the
results of three different methods for calculating PTT in our experiments are discussed. The results
suggest that PTT, particularly when calculated at the 25% rise of the peak, may give an indication regarding the arousal level of the dog.
Chapter 4 summarizes our efforts towards the development of a wearable, noninvasive device
CHAPTER
2
DEVELOPMENT OF A PPG PROBE FOR
PTT ESTIMATION
A reliable PPG pulse signal is necessary for examining each pulse wave in order to find the necessary
points along the waveform needed for PTT calculations. Therefore, development of the PPG probe was a critical prerequisite for the PTT experiments. The development of this PPG probe and the
results from its evaluation experiments are discussed in this chapter.
2.1
Introduction
Photoplethysmography (PPG) is a noninvasive technique for optically detecting blood volume
changes. PPG is obtained by placing a light source and a photodetector at the surface of the skin. The light source illuminates the tissue and the photodetector measures the intensity of the reflected
or transmitted light, depending on the sensor placement. For these experiments, a reflection-based
signal capture method is used, so the photodetector is placed close to the light source. As is the case for many optical measurement methods, PPG is prone to signal noise due to motion artifacts as
well as scattering, absorption, reflection and other issues stemming from the interaction of light
Therefore, the location of the sensor needed to be chosen so that the signal quality was acceptable while also keeping in mind the comfort level of the dog. We chose to place the PPG sensor probe at
the underarm because the hair in this region tends to be sparse, which helps achieve good contact
with the skin and reduces light scattering. Additionally, the hope was to later embed the PPG probe into the previously discussed ECG chest strap. Doing so would improve the dog’s comfort when
wearing the equipment and also minimize the number of physical hardware pieces to put on the
dog during experiments and data collection.
Previous research indicates that the PPG signal can be obtained from different tissue layers
based on the wavelength of the light source as well as the physical distance between the light source
and photodetector[31]. Leier et al says, “Red and near infrared wavelengths of light can penetrate deeper layers of tissue than shorter (green, blue) or longer (infrared) wavelengths and the absorption
of blood is more prevalent.” Infrared light has been used in many PPG devices[32].
In our group’s previous work with PPG, we used a light emitting diode (LED) working at 850 nm along with a commercial-off-the-shelf (COTS) monolithic photodetector to capture the PPG signal [25]. The analog output of the photodetector was directly connected to the BBB’s on-board 12-bit ADC.
Also in our group’s previous work, we explored methods to help improve the skin-to-device
coupling using light guides/pipes[25]. Because canine fur reflects a good portion of the light from the light source, we incorporated light pipe guides to help preserve the incident light quality until
it comes in contact with the surface of the skin. The light pipes also help to physically place the
photodetector and LED at the same height in order to aid the mechanical coupling of the system. This helps to securely position and orient the sensor at an appropriate angle with respect to the skin
so as to minimize the effects of scattering and fringing.
With these findings in mind, we designed three PPG probes to be used in data collection. While each probe contained exactly the same electrical components, the distance between the LED and
photodetector differed. Specifically, we separated the LED and photodetector by distances of 1 cm,
1.5 cm and 2 cm. We compared the results obtained from each probe in order to determine which probe would be used for the PTT experiments to be discussed in the next chapter.
2.2
Materials and Methods
For these experiments, we used the previously described BBB platform. An overview of the entire
hardware system used for data collection can be found in Figure 2.1. A closeup view of one of the
Figure 2.1Block diagram for the hardware used for PPG data collection
The PPG light source is a multi-wavelength LED package (Multi-Wavelength LED, Marubeni Cor-poration) consisting of an array of 12 total LED chips corresponding to three different wavelengths:
760 nm, 805 nm and 850 nm[33]. To clarify, each wavelength has four LED chips which emit the corresponding wavelength when activated. For our experiments, only the 805 nm wavelength was used. The 805 nm wavelength was chosen as a compromise for achieving infrared or near infrared
light, as recommended by[31, 32], while simultaneously minimizing operating requirements for the LED driver circuit.
The photodetector used for data collection is the Si1143 proximity/ambient light sensor[30]. While the Si1143 is capable of driving and controlling three LEDs, we only utilized a single channel
for our LED. This photodetector chip is capable of performing proximity measurements by obtaining two separate back-to-back measurements: one with the LED turned off (to measure the ambient light
alone) and one with the LED turned on. The two measurements are performed within microseconds
of each other with the assumption that the ambient light condition has not changed significantly between the two measurements. The photodetector obtains the numerical difference between the
two measurements and reports the result as the output[34]. The digital output of the photodetector is connected to the I2C serial bus of the BBB. For our experiments, we used forced proximity measurements, meaning that the BBB instructed the photodetector to make a measurement before
retrieving the proximity reading. Furthermore, because our BBB was not configured to support interrupt-based sampling, we observed an inconsistent sampling rate. However, it was roughly
around 90-100 Hz. The inconsistent sampling rate meant that post-processing was necessary to
resample and interpolate the readings before processing.
Because of its operational requirements, the decision was made to provide the LED with its
own external power supply in order to eliminate any performance concerns with the BBB or its
battery source driving the LED. Furthermore, although the photodetector was intended to drive the LEDs connected to its measuring channels, we discovered that this photodetector was not able to
drive our LED because of the high current and higher turn-on voltage needed. Therefore, a custom
circuit was designed for driving the LED. In this custom circuit, the LED control signal from the photodetector was connected to metal-oxide-semiconductor field-effect transistors (MOSFETs)
and passive components in order to control the on/off state of the LED for each measurement. As explored in our previous experiments, we placed light pipes over the the photodetector, the LED, or both in order to form three different light pipe setups to be tested with each probe, forming
a matrix of nine total configurations. These light pipe setups are defined in Figure 2.3. The clear
light pipe setup consisted of one light pipe placed over the photodetector. The white light pipe setup consisted of a clear light pipe with a white-colored heat shrink tubing covering the outside of
light pipe setup consisted of a light pipe (with white heat shrink tubing) placed over the LED and a light pipe (with black heat shrink tubing located near the base of the light pipe) placed over the
photodetector. Styrofoam structures were used secure the light pipes in place. These structures
could be easily removed and re-used for different experimental setups.
Figure 2.3The three configurations of light pipes used during experiments: (a) clear light pipe setup, (b) white light pipe setup, and (c) dual light pipe setup
Initially, data was collected on a human volunteer before placing the probe on a canine. Although the results of the human experiments are not included here, we wanted to ensure that the probes
were assembled correctly and achieved the intended functionality. For each preliminary trial, the
human subject placed the right index finger on top of the probe to ensure snug contact with the surface of the skin. Once the probe’s functionality was verified, it was time to test the probe on
canine subjects.
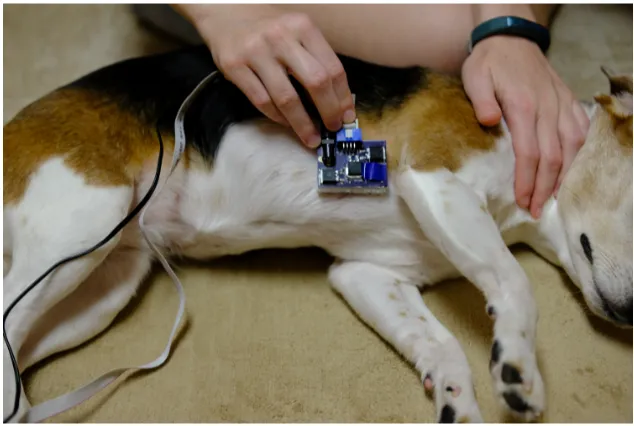
For the canine subjects, the probe was placed at the underarm, as shown in Figure 2.4. The probe was held in place by the experimenter while the canine remained in a stationary position. At
least 30 seconds of good, clean data was obtained for each probe and light pipe configuration. All
Figure 2.4Placement of PPG probe on dog
2.3
Results
PPG results were recorded for the entire matrix of light pipe setups and probes to form a total of
nine tested configurations. The results from the three best trials are printed in this chapter, but the remaining results are contained in the Appendix. The data from each experiment was processed
using the MATLAB computing software (MATLAB, MathWorks, Inc.)[35].
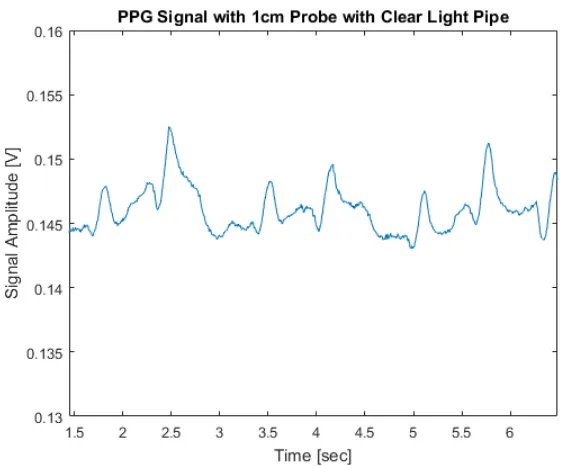
Figure 2.5 contains a five-second snapshot of clean data obtained using the 1 cm probe with the
clear light pipe (no heat shrink tubing acting as an insulating barrier) placed over the photodetector.
Figure 2.5PPG signal captured using 1cm probe with clear light pipe placed over photodetector
Figure 2.7 shows a five-second snapshot of clean data obtained using the 2 cm probe with the clear light pipe (no heat shrink tubing acting as an insulating barrier) placed over the photodetector.
Figure 2.7PPG signal captured using 2 cm probe with clear light pipe placed over photodetector
The quality of the signal obtained in each trial was evaluated using the signal quality index (SQI)
procedure presented in[36]. This algorithm classifies PPG signals (as well as ECG) as “good” if a reliable heart rate can be derived or “bad” if a reliable heart rate cannot be derived. For our analysis,
initially the PPG signals are manually examined in order to label portions of the data as usable or
unusable. Note that while Orphanidou et al. recommends human experts carry out the labeling process, we felt our level of expertise would suffice for these experiments since this is merely a pilot
study. Once the unusable portions were excluded, the PPG pulse peaks (at their maximum values)
were manually marked.
In the event that individual pulse peaks could not be distinguished from overall respiratory
rate, the data for that region was considered unusable because the feasibility rules were violated.
However, it should be noted that the feasibility rules were slightly modified because the population consisted of canines instead of humans; therefore, if the gap between successive PPG pulse peaks
was indistinguishable by the peak detector (human assessor). Although overall respiratory rate could be obtained, the individual pulse peaks could not be obtained for the entire data sets for the 1.5 cm
dual, 2 cm white and 2 cm dual experimental trials. Thus, SQI calculations could not be obtained
for those trials.
Data classified as “good” was fed into the adaptive template matching step of the SQI calculation
algorithm. The purpose of this portion of the algorithm was to search for regularity in a data segment,
which gives an indication of its reliability. First, the median time between pulse peaks is calculated. Then the individual pulse waves are extracted by taking a window centered on each detected peak,
where the width of the window corresponds to the median time between pulse peaks. Next, the
mean pulse wave template can be obtained, and the correlation coefficient of each individual pulse wave is calculated with the mean pulse wave template. Finally, the average correlation coefficient is
obtained by averaging all correlation coefficients over the entire PPG data set for that trial. A higher
average correlation coefficient suggested that the data for that set was considered better or more reliable. The SQI calculations for each trial are listed in Table 2.1, where the data sets which did not
uphold feasibility rules are listed as “N/A” because SQI could not be obtained. Figure 2.8 contains a visual example of the adaptive template matching step of the algorithm for the 1 cm clear light pipe configuration. The individual pulse peaks are plotted in red and the average pulse peak calculation
is overlaid in blue (line thickness was increased for visual clarity).
Table 2.1SQI calculations for the probe and light pipe configurations tested
Probe and Light Pipe Configuration SQI
1 cm clear 0.3900
1 cm white 0.3160
1 cm dual 0.2897
1.5 cm clear 0.4652
1.5 cm white 0.2514
1.5 cm dual N/A
2 cm clear 0.3383
2 cm white N/A
Figure 2.8Adaptive template matching for the SQI computing algorithm
2.4
Discussion and Conclusions
Strictly by visual examination, the results show that some setups were acceptable for detecting the
pulse waves, but others may have better performance detecting overall respiratory rate. For instance,
the results from the 2 cm probe for the dual and white light pipe configurations appeared to display the overall respiratory rate well but the individual pulses were not as distinguishable. On the other
hand, the 1 cm clear and 1.5 cm clear light pipe setups appeared to produce cleaner individual pulse
waves.
The calculations for SQI provided quantitative support for these observations. Specifically, the
SQI calculation algorithm suggested that the 1.5 cm clear light pipe configuration produced the
best results, followed by the 1 cm clear light pipe and 2 cm clear light pipe setups. With the visual observations in mind as well as the SQI calculations to quantitatively bolster them, we concluded
that the 1.5 cm with the clear light pipe setup should be selected for use in the PTT experiments to be discussed in the next chapter.
While the 1.5 cm probe with the clear light pipe setup was ultimately selected, there are several
the ability to obtain interrupt-based measurements would significantly improve the consistency of the sampling rate. Having a constant sampling rate is important, for example, if the data is to be
filtered or serves as the input to an algorithm for purposes of peak detection or feature extraction.
This would also place real-time physiological measurements within the realm of possibility for this system. In the system’s current state, the data must be collected completely before post hoc
process-ing and analysis. Mechanically, the system could also benefit from employprocess-ing an alternative to the
Styrofoam structures used to hold the light pipes in place. After some wear and tear, the Styrofoam tended to break off in pieces which could compromise the security of the light pipe positioning.
Finally, increasing the LED drive current in future experiments may also help improve signal quality,
CHAPTER
3
PTT ESTIMATIONS AS AN AROUSAL
MEASUREMENT
In this chapter, we collect ECG and PPG information from dogs during baseline and stimuli
expo-sure and use the information to compute PTT estimations. We also compare three different PTT calculation methods to examine their reliability toward indicating the dog’s level of arousal. The
results and analysis from these experiments are discussed in this chapter.
3.1
Introduction
As mentioned in Chapter 1, the term “arousal” is used in this thesis to describe the body’s response to
positive (or pleasant) stimuli, like excitement or exercise, as well as negative (or unpleasant) stimuli, like fear or stress. The mental, physical or emotional stimuli can trigger a response from the body’s
autonomic nervous system. In turn, heart rate and blood pressure increase as do sensory alertness,
motor activity and emotional reactivity[3, 4]. Many studies have investigated the relationship between various stimuli and a dog’s physiological signals as well as an appropriate and objective
method for measuring these signals.
ways of measuring those effects. Our group’s previous research shows that stimuli, such as thunder-storm sounds, can induce changes in heart rate, as shown in Figure 3.1. When placed in the open
field, the heart rate of the dogs was higher during period 5 (thunderstorm sound) than periods 4
(pre-thunderstorm sound) and 6 (post-thunderstorm sound), (p<0.05)[37]. Vincent et al. found that blood pressure measurements tend to be higher for stress-prone dogs[14]. Particularly, when a dog is exposed to a set of known stress-inducing stimuli (like a sound) blood pressure tends to increase
along with heart rate[13]. However, continuously and noninvasively measuring the blood pressure of a dog requires that a cuff-based or similar device be placed on the dog’s leg or tail, which may
inhibit or discourage the dog’s natural movement and activity. Furthermore, various studies have
shown that measurements like heart rate, respiratory rate, blood pressure and body temperature indicate stress or arousal in animals[15]. For example, blood pressure and heart rate tended to be higher when a dog is left in a clinical exam room with only the veterinarian than when the owner is
also present[16]. Likewise, hospital visit stress can affect a dog’s physiological measurements like pulse rate, rectal temperature, respiratory rate and blood pressure[17, 18].
Similar to its investigation in humans, PTT has been investigated in dogs as a means of estimating blood pressure. For some of those studies, the dogs were placed under general anesthesia and
administered hormones, such as epinephrine, in order to evoke ranges of hypotension and/or hypertension[19, 20]. Zhang et al. found that PAT did not produce adequate approximations for diastolic blood pressure, but Tang et al. concluded that adequate estimations of systolic blood
pressure could be obtained using certain definitions of PAT (i.e. the second point needed for PTT
calculation, located along the pulse wave). Even though the focus of this thesis is not on estimating blood pressure, we keep the observations of these studies in mind as we investigate the effects of
the chosen stimuli on PTT estimations.
Since evaluating arousal level can be complex, it is recommended that other parameters be examined concurrently, as a single metric may be misleading[38]. For this pilot study, we provide heart rate calculations as well as behavioral observations alongside the PTT estimations. However,
we suggest that other metrics like heart rate variability and respiratory rate be included as additional data in future studies.
3.2
Materials and Methods
With a few minor upgrades, the platform used for data collection was fundamentally that which was
used in our previous work[25, 26]. Figure 3.2 provides an overview of the data collection platform. The ECG signal is obtained via the spring-loaded electrodes, which are covered with impedance-lowering electrolyte gel before being placed on the dog. The electrodes are connected to the input
of the COTS single-lead heart rate monitor analog front end chip (AD8232, Analog Devices)[39]. The output of the front end chip is connected to the 12-bit ADC on the BBB and is sampled roughly every 5 ms. As noted in Chapter 2, the BBB is configured in such a way that all sampling rates are
inconsistent, so we account for this during post-processing. PPG data is sampled at approximately
90-100 Hz, ECG data is sampled at approximately 200 Hz. PPG is obtained using the 1.5 cm probe with the clear light pipe with the probe held in place by the chest strap. The ECG and PPG data are
transmitted via Wi-Fi using a Wi-Fi USB adapter (EW-7811Un, Edimax) and received by a laptop
connected to the same Wi-Fi network[40]. Once the data has arrived to the laptop, it is plotted on the screen in real time and saved to a Comma Separated Value (CSV) file, which is examined after
data collection is complete. The purpose of displaying the signal in real time on the screen helps alert the experimenter when problems arise during data collection, such as an ECG lead becoming
Figure 3.2Data collection platform for ECG and PPG
An adjustable elastic chest strap (Figure 3.3) secures the ECG electrodes and PPG sensor in place
around the thorax behind the dog’s front legs, like in Figure 3.4. The BBB platform is placed inside a fabric pouch which is attached to the top side of the chest strap (along the dog’s spine) using
Velcro. Attaching the platform in this way allows the dog to be mobile without requiring the owner or
handler to hold the package during data collection. It should be noted that, ideally, the PPG sensor would be placed at an extremity; for example, in humans, the PPG measurement site is typically
a fingertip or earlobe. In general, however, dogs tend to be less tolerant of objects placed on the
ear, foot or tail and may become distracted or anxious if measurement devices are placed in these locations. Thus, with the dog’s comfort level in mind, we decided to test the feasibility of placing the
PPG sensors near the chest. One consequence of the PPG measurement being located so near the
heart is that measurement values in the time domain are extremely sensitive and must be precise, as the blood travels a short physical distance in a very short amount of time[9].
We performed experiments on a total of four dogs; information such as breed and age can be
found in Table 3.1. All animal procedures were approved by the Institutional Animal Care and Use Committee of North Carolina State University. In each experiment, we collected baseline data on a
separate calendar day from stimuli data. For Dog 1, Dog 2 and Dog 3, at least two minutes of good
quality data was recorded each for baseline and stimuli scenarios. Note that for Dog 4, while two minutes of baseline data was obtained, only one minute of stimuli data was considered clean and
salvageable after noise removal; despite the duration being less than that obtained from the other
Figure 3.3Chest strap for housing electrodes for ECG and securing the PPG probe in position
Table 3.1Dog breed and age information
Dog Reference Breed Age (Years) Sex
Dog 1 Beagle 9 F
Dog 2 Corgi and Cavalier King Charles Spaniel Mix 12 M
Dog 3 Mixed 2 F
Dog 4 Great Pyrenees 1 M
For this study, we recruited owned dogs which exhibited arousal (fear or excitement) in response to known stimuli. Thus, we could tailor each trial towards the individual dog in order to induce a
change in the perceived level of arousal and measure any changes in PTT. The custom stimuli for
each dog is listed in Table 3.2.
Table 3.2Dog stimuli information
Dog Reference Stimuli
Dog 1 Interaction with a cat
Dog 2 Thunderstorm
Dog 3 Animated toys and wildlife in woods Dog 4 Exploring wooded area in a park
First, we obtained baseline ECG and PPG data for PTT estimation. Baseline scenarios typically
consisted of each dog being placed in a calm, mildly- or non-stimulating environment, such as in
the dog’s home. It should be noted that for Dog 3, baseline data was collected indoors but away from the dog’s home. On a separate day (and in most cases in a separate location), we collected ECG
and PPG data while the dogs were exposed to their custom-tailored stimuli.
The data from each experiment was processed post hoc using the MATLAB computing software (MATLAB, MathWorks, Inc.) in order to calculate the metrics of interest[35]. First, each data set was resampled and interpolated in order to achieve a common, constant sampling rate of 200 Hz for each
data stream; we chose to resample both data sets at the higher sampling rate because this simplified vector manipulations inside MATLAB. The ECG signal was then manually examined in order to
remove noisy, indistinguishable or otherwise unacceptable sections. Then the PPG signal was
from both pieces of data, the ECG signal was examined in order to determine where the R peaks of the waveform occurred. This was accomplished using the MATLAB functionfindpeakswith parameters
corresponding to the minimum peak height and estimated minimum time between peaks. The
returned vector containing the locations of the R-peaks was manually verified for accuracy before continuing further. After verification of the ECG R-peak locations, the PPG signal was examined to
determine where the maximum point of each pulse peak occurred. This step was done manually
because some sections of the data may have been too noisy for simple automated algorithms yet they remained distinguishable to the experiment analyst; sources of the noise and potential
improvements are discussed at the end of this chapter and in Chapter 4. After the peak maximums
were marked, MATLAB estimated the location of the base of each peak as the minimum point occurring between the maximum and R-peak of the ECG. Then MATLAB calculated an estimate
for the amplitude of the value occurring at 25 percent of the height of the PPG peak. The analyst
then manually examined the entire data set to choose where the 25 percent value occurred on the waveform; this was necessary because the PPG signal contained noise oscillations or jitters which
would have impacted simple automatic algorithms for determining these points.
3.3
Results
The experimenter noted behavioral observations during the stimuli scenarios which verified that
each dog’s arousal level had deviated away from baseline. Dog 1 initially showed excitement and curiosity when the cat entered but became territorial and protective when the cat approached the
dog’s food/treat bowl. Dog 2 was obviously fearful during the thunderstorm stimuli, as demonstrated by the body shaking/trembling, panting, frequent swallowing and crouching down towards the floor. Dog 3 began barking and jumping with obvious arousal during the stimuli scenario. For this dog’s
stimuli, pet toys were attached to fishing line and hidden in nearby woods before data collection
started; during data collection, the experimenter animated the pet toys by pulling on the fishing line. Dog 4 was known to have a calm personality while indoors but became perkier when playing
and sniffing outdoors.
In addition to behavioral and physical observations, we examined the ECG data in order to calculate instantaneous heart rates for baseline and stimuli scenarios, as shown in Figure 3.5. The
type of plot shown in Figure 3.5 is a box plot, which is a graph generated using MATLAB that provides a visualization of summary statistics for sample data. The 25th and 75th percentiles of the samples
are the tops and bottoms of each blue box, respectively. The sample median is the red line in the
Examples of the raw data examined for calculating PTT are shown in Figures 3.6 and 3.7.
Figure 3.6Snapshot of raw data used for PTT calculations for Dog 1 baseline
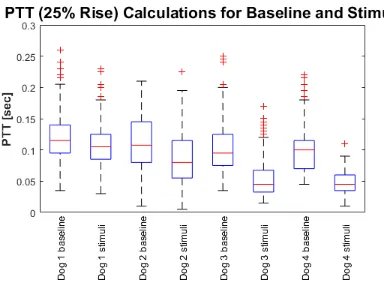
The PTT data for baseline and stimuli scenarios for each dog is summarized in Figure 3.8 in the form of a box plot. For the box plot, the 25th and 75th percentiles of the samples are the tops and
bottoms of each blue box, respectively. The sample median is the red line in the middle of each box.
The whiskers are the black lines lines extending above and below each box. Samples beyond the whisker length are marked as outliers, which are indicated by a red “+” sign.
Mean heart rate (HR) and mean PTT values for baseline and stimuli sessions are included in Table 3.3.
Table 3.3Mean heart rate and PTT values for baseline and stimuli data for each dog
Dog Baseline Mean HR Baseline Mean PTT Stimuli Mean HR Stimuli Mean PTT
Reference [bpm] [sec] [bpm] [sec]
Dog 1 90.12 0.1205 104.6 0.1084
Dog 2 103.6 0.1118 131.1 0.0837
Dog 3 94.30 0.1031 160.8 0.0533
Dog 4 70.62 0.1016 121.9 0.0484
The baseline and stimuli PTT data for each dog is shown in Figures 3.9-3.12. The PTT estimations from baseline data collection sessions are shown in blue, and the PTT estimations from stimuli
data collection sessions are shown in red. For each session, the PTT estimations are plotted in
chronological order (by sample number). The stimuli PTT data is plotted alongside baseline PTT for the purpose of visual clarity. Note that stimuli data was recorded on a separate day; that is, it was
Figure 3.9Baseline and stimuli PTT data for Dog 1
Figure 3.11Baseline and stimuli PTT data for Dog 3
The SQI procedure discussed in the previous chapter was applied to the PPG data obtained during these experiments. These calculations are listed and discussed in the Appendix.
For individual dog data, a two-sample t-test was performed between the baseline and stimuli
data sets to test the null hypothesis that both data sets had statistically equivalent means. As shown in Table 3.4, for each dog the null hypothesis was rejected at the 1% significance level.
Table 3.4Results of two-sample t-test
Dog Rejects Null p-value t-value Degrees of Standard
Reference Hypothesis? Freedom Deviation
Dog 1 Yes 9e-7 4.9533 799 0.0345
Dog 2 Yes 9e-21 9.5673 943 0.0419
Dog 3 Yes 1e-48 16.2061 558 0.0344
Dog 4 Yes 8e-41 15.6942 296 0.0292
Although this is only a pilot study, we also calculated a paired t-test from the baseline and stimuli means for each dog. As shown in Table 3.5, for this case the null hypothesis was rejected at the 5%
significance level.
Table 3.5Results of paired t-test
Dog Rejects Null p-value t-value Degrees of Standard
Reference Hypothesis? Freedom Deviation
All dogs Yes 0.0341 3.707 3 0.0193
In order to evaluate the system as a potential arousal level detector, we propose a theoretical
system which uses a simple threshold to classify aroused and relaxed regions. For the purposes of
this evaluation, this threshold was chosen to be the mean of a data set comprised of both baseline and stimuli data. Mean was chosen because of its ease of calculation in a real system; however, it
should be noted that while mean is a simple calculation, it is susceptible to drift during long periods
selection algorithms should be able to avoid these problems while also improving performance of the arousal level detector. Moving window average sizes of 1 (i.e. raw PTT data), 5, 10, 15 and 20 were
applied to the raw PTT data. Then sensitivity and specificity were calculated based on the mean of
the raw data for each dog and for the consolidation of data from all the dogs (“All Dogs”). As can be seen in Figures 3.13 and 3.14, the averaging increases both sensitivity and specificity but decreases
the responsiveness of a potential detection system to rapid changes in the dog’s physiological state.
Figure 3.13Sensitivity calculations for various window sizes where the detection threshold is equal to the mean of the entire data set for each dog
It should be noted that baseline measurements were collected as soon as the equipment was placed on the dog. Some dogs appeared to “freeze” movement or initially exhibit a partially aroused
state during this time, which we attribute to the dogs not yet acclimating to the equipment. Under
the previous scoring criteria, this would be counted as false positives. Assuming that these early regions represent a temporarily excited state prior to returning to a relaxed state, the sensitivity
and specificity can be recalculated using the latter half of each baseline data set. Since the target
Figure 3.14Specificity calculations for various window sizes where the detection threshold is equal to the mean of the entire data set for each dog
Although the 25% rise time was ultimately used for the PTT data comparison between baseline and stimuli for each dog, the maximum and minimum (base) of the PPG wave were also used to
examine alternative PTT calculation methods. These calculations are displayed in Figures 3.16-3.19.
As a reminder, for each box, the 25th and 75th percentiles of the samples are the tops and bottoms of each blue box, respectively. The sample median is the red line in the middle of each box. Sample
outliers are indicated by a red “+” sign.
Figure 3.20 shows the duration in minutes of data collection (i.e. good, clean data) obtained for each dog during baseline and stimuli sessions. As mentioned earlier, the data from Dog 4 was
kept in our analysis despite the fact that the duration of salvageable stimuli data was shorter than
that of the other dogs; a large portion of the data had to be removed because it was too noisy to analyze. Nevertheless, it is included in the results section because further investigation on a larger
population is needed in order to demonstrate statistical significance.
Figure 3.17Baseline and stimuli PTT data for Dog 2
Figure 3.19Baseline and stimuli PTT data for Dog 4
3.4
Discussion and Conclusions
The results suggest that the calculated PTT decreased in value with respect to the baseline
calcu-lations when the dog was exposed to the frightening or exciting stimuli. Although some results appeared more extreme than others, this decrease was observed in the results for each of the four
dogs tested. These initial results suggest that PTT obtained at the chest may provide an appropriate
means of measuring arousal in dogs. While this is a pilot study and does not demonstrate statistical significance due to the small population tested, the results are nevertheless promising. Further
investigation on a larger population is needed.
We also proposed a possible arousal detection scheme utilizing data captured in this way. Despite the simplicity of the detector, the results confirm that useful binary classifications of dog arousal
level may be obtained even when thresholds derived from the entire population are applied to
the data. Furthermore, the grading criteria represents a pessimistic evaluation of the detector’s performance. In the likely event that the dog’s actual state relaxes at some point during the stimulus
period or becomes excited during the baseline period, the detector may accurately classify this change. Under the criterion proposed, this correct classification would be scored as either false
negative or false positive given the uniform classification of each data set as strictly baseline or
strictly stimulus.
Additionally, the three methods of calculating PTT that were examined may suggest that some
methods are more indicative of arousal than other methods, as the literature suggests. The base
(minimum) of the PPG wave did not appear have as obvious differences (in terms of median val-ues) between baseline and stimuli, which may suggest that this method may not be as indicative
as the other methods examined. The 25% and maximum values, on the other hand, do seem to
show more obvious changes from baseline to stimuli for all dogs. However, further investigation is recommended.
The heart rate information obtained during baseline and stimuli further supports the conclusion
that the dogs responded to the stimuli and demonstrated a change in arousal level. In fact, Dog 3 became so animated during exposure to the stimuli that the instantaneous heart rate achieved
several values near the 300 beats-per-minute (bpm) mark. Note that while the heart rate approaching
300 bpm seemed unusual, given the dog’s excited and active response to the stimuli, this observation was not entirely surprising. Nevertheless, we later investigated the validity of these measurements by
obtaining ECG measurements via a commercial ECG system while repeating the stimuli experiment.
Indeed, similar observations were noted and instantaneous heart rates around 260 bpm were recorded. This separate experiment was performed solely to support the validity of the data recorded
could cause miscalculations for heart rate. Further discussion and detail about this experiment can be found in the Appendix.
Future work should include testing on a larger population as well as configuring the BBB platform
to sample according to a software driven interrupt-based protocol. An interrupt-based sampling procedure would pave the way for the system to measure and report heart rate, respiratory rate,
and PTT in real time, which could provide clinicians and pet owners alike with an arguably more
CHAPTER
4
CONCLUSIONS AND SUGGESTIONS FOR
FUTURE WORK
In Chapter 2, a PPG probe was selected which provided promising results for detecting the pulse
wave at the dog’s underarm. Although it was not calculated, respiratory rate could also be determined via the signal collected with this probe and could provide an additional physiological measurement
for investigation. The fundamental difference between the three PPG probes examined was the
physical distance separating the light source (LED) from the photodetector. We found that the 1 cm clear light pipe, 1.5 cm clear light pipe and 2 cm clear light pipe setups were the best candidates
for measuring individual pulse waves. Each pulse signal was evaluated for quality using an SQI
procedure[36]which classifies the PPG signals as “good” if a reliable heart rate can be derived or “bad” if a reliable heart rate cannot be derived. The average correlation coefficient obtained
from examining each individual pulse window with respect to the average pulse window gives an
indication as to the reliability of the signal. This enabled us to select a probe which would provide us with a reliable PPG pulse wave based on quantitative criteria. Ultimately, the 1.5 cm clear light
pipe configuration was selected as the most reliable PPG probe because visually its results were
In Chapter 3, we discuss the results of the PTT experiments. In these experiments, PTT esti-mations were obtained from four dogs during baseline and stimuli exposure, where baseline data
was collected on a separate day from stimuli exposure. PTT was calculated three different ways,
specifically as the time delay between the ECG R-peak and the maximum, minimum, and 25% of the rise of the PPG wave. The results showed that PTT, as calculated using the 25% rise of the PPG
wave, tended to decrease when the dog was exposed to fear-inducing or exciting stimuli.
Further-more, the instantaneous heart rate data also supports the conclusion that the dog’s emotional state changed during the stimuli scenario with respect to baseline. We also proposed a simple potential
arousal detector whose results confirm that useful binary classifications regarding dog arousal
level may be obtained even when the data are graded based on thresholds derived from the entire population. The results also suggest that the minimum of the PPG wave may not be a reliable PTT
calculation method; although, that particular set of data was shorter in duration than the other data
sets examined in the study. More in-depth investigation on a larger population is needed in order to conclusively argue that PTT measured at the dog’s chest using the 25% rise calculation can give an
indication regarding the dog’s arousal level.
In addition to the obvious suggestion of performing experiments on a larger population for statistical significance, one of our platform’s limitations we would suggest improving for future
work concerns the inconsistent sampling rate for ECG and PPG data. An interrupt-driven sampling procedure would help achieve a more consistent sampling rate. This, in turn, would allow for the
platform to serve as a real-time system in which physiological measurements could be obtained,
processed and reported. This capability would arm clinicians and pet owners with additional quantitative physiological measurements to further provide insight regarding a dog’s level of arousal.
Also, improving certain mechanical characteristics for the PPG probe, such as using an alternative
structure to secure the light pipes in place, could benefit from future work. Increasing the drive current for the LED may help improve the quality of the obtained PPG signal, particularly in cases
where the dog is excessively mobile or has thicker fur.
Despite these limitations, the results of this pilot study are indeed quite promising. After all, understanding when a dog’s emotional state changes, such as when the dog becomes frightened or
excited, would bring humans closer to narrowing the gap between canine and human
BIBLIOGRAPHY
[1] Guyton, A. C. & Hall, J. E.Textbook of Medical Physiology. Ed. by Gruliow, R. 11th ed. Philadel-phia, PA: Elsevier Saunders, 2006.
[2] Duffy, E. “The psychological significance of the concept of ‘arousal’ or ‘activation.’” Psycho-logical Review Vol.64. No. 5 (1957), pp. 265 –275.
[3] Pfaff, D. et al. “Hormonal and genetic influences on arousal—sexual and otherwise.”Trends in Neurosciences Vol.25. No. 1 (2002), pp. 45 –50.
[4] Valdés, J. L. et al. “The infralimbic cortical area commands the behavioral and vegetative arousal during appetitive behavior in the rat.”European Journal of Neuroscience Vol.23. No. 5 (2006), pp. 1352–1364.
[5] Kulkarni, S. et al. “Stress and hypertension.”WMJ : Official Publication of the State Medical Society of Wisconsin Vol.97. No. 11 (Dec. 1998), pp. 34–8.
[6] Mukkamala, R. et al. “Toward Ubiquitous Blood Pressure Monitoring via Pulse Transit Time: Theory and Practice.”IEEE Transactions on Biomedical Engineering Vol.62. No. 8 (Aug. 2015), pp. 1879–901.
[7] Gao, M. et al. “Comparison of noninvasive pulse transit time estimates as markers of blood pressure using invasive pulse transit time measurements as a reference.”Physiological Reports Vol.4. No. 10 (May 2016).
[8] Gesche, H. et al. “Continuous blood pressure measurement by using the pulse transit time: comparison to a cuff-based method.”European Journal of Applied Physiology Vol.112. No. 1 (Jan. 2012), pp. 309–15.
[9] Hey, S. et al. “Continuous Noninvasive Pulse Transit Time Measurement for Psycho-physiological Stress Monitoring.”2009 International Conference on eHealth, Telemedicine, and Social Medicine. Feb. 2009, pp. 113–116.
[10] Ribeiro, D. M. D. et al. “A real time, wearable ECG and continuous[sic]blood pressure monitor-ing system for first responders.”2011 Annual International Conference of the IEEE Engineering in Medicine and Biology Society. Aug. 2011, pp. 6894–6898.
[11] Myint, C. et al. “Blood Pressure measurement from Photo-Plethysmography to Pulse Transit Time.”2014 IEEE Conference on Biomedical Engineering and Sciences (IECBES). Dec. 2014, pp. 496–501.
[13] Vincent, I. C. et al. “Non-invasive measurement of arterial blood pressure in dogs: a potential indicator for the identification of stress.”Research in Veterinary Science Vol.54. No. 2 (1993), pp. 195–201.
[14] Vincent, I. C. & Michell, A. R. “Relationship between blood pressure and stress-prone temper-ament in dogs.”Physiology and Behavior Vol.60. No. 1 (1996), pp. 135–8.
[15] Bodnariu, A. “Indicators of Stress and Stress Assessment in Dogs.”LUCRARI STIINTIFICE: MEDICINA VETERINARA (Scientifical Papers: Veterinary Medicine) Vol.XLI(2008).
[16] Hoglund, K. et al. “Blood pressure, heart rate, and urinary catecholamines in healthy dogs subjected to different clinical settings.”Journal of Veterinary Internal Medicine Vol.26. No. 6 (2012), pp. 1300–8.
[17] Bragg., R. F. et al. “Evaluation of the effects of hospital visit stress on physiologic variables in dogs.”Journal of the American Veterinary Medical Association Vol.246. No. 2 (2015), pp. 212– 5.
[18] Kallet, A. J. et al. “Comparison of blood pressure measurements obtained in dogs by use of indirect oscillometry in a veterinary clinic versus at home.”Journal of the American Veterinary Medical Association Vol.210. No. 5 (Mar. 1997), pp. 651–4.
[19] Tang, H. et al. “Nonlinear relationship between systolic blood pressure and pulse transit time in anesthetized dogs.”2014 7th International Conference on Biomedical Engineering and Informatics. Oct. 2014, pp. 363–367.
[20] Zhang, G. et al. “Pulse arrival time is not an adequate surrogate for pulse transit time in terms of tracking diastolic pressure.”2011 Annual International Conference of the IEEE Engineering in Medicine and Biology Society. Aug. 2011, pp. 6462–6464.
[21] Muehlsteff, J. et al. “Cuffless estimation of systolic blood pressure for short effort bicycle tests: the prominent role of the pre-ejection period.”Annual International Conference of the IEEE Engineering in Medicine and Biology Society Vol.1(2006), pp. 5088–92.
[22] Sun, Y. & Thakor, N. “Photoplethysmography Revisited: From Contact to Noncontact, From Point to Imaging.”IEEE Transactions on Biomedical Engineering Vol.63. No. 3 (Mar. 2016), pp. 463–477.
[23] Kachuee, M. et al. “Cuffless Blood Pressure Estimation Algorithms for Continuous Health-Care Monitoring.”IEEE Transactions on Biomedical Engineering Vol.64. No. 4 (Apr. 2017), pp. 859–869.
[25] Brugarolas, R. et al. “Wearable Heart Rate Sensor Systems for Wireless Canine Health Monitor-ing.”IEEE Sensors Journal Vol.16. No. 10 (May 2016), pp. 3454–3464.
[26] Brugarolas Brufau, R. “Towards Automated Canine Training: Wearable Cyber-Physical Sys-tems for Physiological and Behavioral Monitoring of Dogs.” PhD thesis. North Carolina State University, 2016.
[27] Beagleboard.org.BeagleBone Black.
[28] Dieffenderfer, J. et al. “Low-Power Wearable Systems for Continuous Monitoring of Environ-ment and Health for Chronic Respiratory Disease.”IEEE Journal of Biomedical and Health Informatics Vol.20. No. 5 (Sept. 2016), pp. 1251–1264.
[29] Dieffenderfer, J. P. et al. “Wearable wireless sensors for chronic respiratory disease monitoring.” 2015 IEEE 12th International Conference on Wearable and Implantable Body Sensor Networks (BSN). June 2015, pp. 1–6.
[30] Silicon Labs.Si1141/42/43 Proximity/Ambient Light Sensor IC with I2C Interface.
[31] Leier, M. et al. “Smart photoplethysmographic sensor for pulse wave registration at different vascular depths.”2015 37th Annual International Conference of the IEEE Engineering in Medicine and Biology Society (EMBC). Aug. 2015, pp. 1849–1852.
[32] Tamura, T. et al. “Wearable Photoplethysmographic Sensors–Past and Present.”Electronics (Apr. 2014).
[33] Marubeni Corporation.Multi-Wavelength LED (L4*760/4*805/4*850-40Q96-1). [34] Silicon Labs.Si114x Designer’s Guide.
[35] MathWorks, Inc.MATLAB R2016b.
[36] Orphanidou, C et al. “Signal-Quality Indices for the Electrocardiogram and Photoplethysmo-gram: Derivation and Applications to Wireless Monitoring.”IEEE Journal of Biomedical and Health Informatics Vol.19. No. 3 (May 2015), pp. 832–838.
[37] Sherman, B et al. “Heart rate and anxiety responses to thunderstorm sounds by client-owned dogs.”Proceedings of the Veterinary Behavior Symposium. San Antonio, TX, Aug. 2016.
[38] National Research Council (US) Committee on Recognition and Alleviation of Distress in Laboratory Animals.Recognition and Alleviation of Distress in Laboratory Animals. Chapter 2: Stress and Distress: Definitions. Washington (DC): National Academies Press (US), 2008.
APPENDIX
A
SUPPLEMENTAL WORK AND FIGURES
A.1
Additional PPG Probe Results
This section of the Appendix contains plots of additional data obtained during the PPG experiments discussed in Chapter 2.
Figure A.1 contains a five-second snapshot of clean data obtained using the 1 cm probe with the white light pipe (white heat shrink tubing acts as an insulating barrier) placed over the photodetector.
Figure A.2 contains a five-second snapshot of clean data obtained using the 1 cm probe with the
dual light pipes (heat shrink tubing placed on both pipes to act as an insulating barrier) placed over the LED and photodetector.
Figure A.3 contains a five-second snapshot of clean data obtained using the 1.5 cm probe with the
white light pipe (white heat shrink tubing acts as an insulating barrier) placed over the photodetector. Figure A.4 contains a thirty-second snapshot of clean data obtained using the 1.5 cm probe with
the dual light pipe setup. This thirty-second snapshot suggests that slower oscillations of the PPG
wave are more easily detected with this setup than are the individual pulse waves. With the SQI calculation criteria in mind (as discussed in Chapter 2), analysis was performed on this set of data