University of Windsor University of Windsor
Scholarship at UWindsor
Scholarship at UWindsor
Electronic Theses and Dissertations Theses, Dissertations, and Major Papers
2013
ADEPT Runtime/Scalability Predictor in support of Adaptive
ADEPT Runtime/Scalability Predictor in support of Adaptive
Scheduling
Scheduling
Gholamhossein Deshmeh University of Windsor
Follow this and additional works at: https://scholar.uwindsor.ca/etd
Recommended Citation Recommended Citation
Deshmeh, Gholamhossein, "ADEPT Runtime/Scalability Predictor in support of Adaptive Scheduling" (2013). Electronic Theses and Dissertations. 4943.
https://scholar.uwindsor.ca/etd/4943
This online database contains the full-text of PhD dissertations and Masters’ theses of University of Windsor students from 1954 forward. These documents are made available for personal study and research purposes only, in accordance with the Canadian Copyright Act and the Creative Commons license—CC BY-NC-ND (Attribution, Non-Commercial, No Derivative Works). Under this license, works must always be attributed to the copyright holder (original author), cannot be used for any commercial purposes, and may not be altered. Any other use would require the permission of the copyright holder. Students may inquire about withdrawing their dissertation and/or thesis from this database. For additional inquiries, please contact the repository administrator via email
ADEPT Runtime/Scalability Predictor in support of Adaptive Scheduling
By
Gholamhossein Deshmeh
A Dissertation
Submitted to the Faculty of Graduate Studies
through the School of Computer Science
in Partial Fulfillment of the Requirements for
the Degree of Doctor of Philosophy
at the University of Windsor
Windsor, Ontario, Canada
2013
ADEPT Runtime/Scalability Predictor in support of Adaptive Scheduling
By
Gholamhossein Deshmeh
APPROVED BY:
______________________________________________ Shikharesh Majumdar, External Examiner,
Dept. of Systems and Computer Engineering, Carleton University
______________________________________________ Majid Ahmadi,
Dept. of Electrical and Computer Engineering
______________________________________________ Joan Morrissey,
School of Computer Science
______________________________________________ Alioune Ngom,
School of Computer Science
______________________________________________ Robert D. Kent, Advisor
School of Computer Science
iii
Declaration of Co-Authorship / Previous Publication
I. Co-Authorship Declaration
I hereby declare that this thesis incorporates material that is result of joint
research, as follows:
This thesis incorporates the outcome of a joint research undertaken in
collaboration with Jacob Machina under the supervision of Dr. Angela Sodan. The
collaboration is covered in Chapter 3 of the thesis. In all cases, the key ideas, primary
contributions, experimental designs, data analysis and interpretation, were performed
by the author, and the contribution of co-authors was primarily through the provision of
a method for fast curve fitting and its implementation, the validation of the proposed
R-metric, re-factoring the ADEPT code to improve its speed and fix several bugs, and
experiments setup. Wai Ling Yee provided hints in regards to the closed-form solution to
the Downey model.
I am aware of the University of Windsor Senate Policy on Authorship and I certify
that I have properly acknowledged the contribution of other researchers to my thesis,
and have obtained written permission from each of the co-author(s) to include the
above material(s) in my thesis.
I certify that, with the above qualification, this thesis, and the research to which
it refers, is the product of my own work.
II. Declaration of Previous Publication
iv
Thesis Chapter Publication title/full citation Publication status
Chapter 3 [A.Deshmeh 2010] Deshmeh, A. Machina, J.
Sodan, A., ADEPT scalability predictor in support of
adaptive resource allocation, In 2010 IEEE
International Symposium on Parallel & Distributed
Processing (IPDPS), April 2010, pp. 1-12.
Published
I certify that I have obtained a written permission from the copyright owner(s) to
include the above published material(s) in my thesis. I certify that the above material describes work completed during my registration as graduate student at the University
of Windsor.
I declare that, to the best of my knowledge, my thesis does not infringe upon
anyone’s copyright nor violate any proprietary rights and that any ideas, techniques,
quotations, or any other material from the work of other people included in my thesis,
published or otherwise, are fully acknowledged in accordance with the standard
referencing practices. Furthermore, to the extent that I have included copyrighted
material that surpasses the bounds of fair dealing within the meaning of the Canada
Copyright Act, I certify that I have obtained a written permission from the copyright
owner(s) to include such material(s) in my thesis.
I declare that this is a true copy of my thesis, including any final revisions, as
approved by my thesis committee and the Graduate Studies office, and that this thesis
v ABSTRACT
A job scheduler determines the order and duration of the allocation of
resources, e.g. CPU, to the tasks waiting to run on a computer. Round-Robin and
First-Come-First-Serve are examples of algorithms for making such resource allocation
decisions. Parallel job schedulers make resource allocation decisions for applications
that need multiple CPU cores, on computers consisting of many CPU cores connected by
different interconnects. An adaptive parallel scheduler is a parallel scheduler that is
capable of adjusting its resource allocation decisions based on the current resource
usage and demand. Adaptive parallel schedulers that decide the numbers of CPU cores
to allocate to a parallel job provide more flexibility and potentially improve performance
significantly for both local and grid job scheduling compared to non-adaptive
schedulers. A major reason why adaptive schedulers are not yet used practically is due
to lack of knowledge of the scalability curves of the applications, and high cost of
existing white-box approaches for scalability prediction. We show that a runtime and
scalability prediction tool can be developed with 3 requirements: accuracy comparable
to white-box methods, applicability, and robustness. Applicability depends only on
knowledge feasible to gain in a production environment. Robustness addresses
anomalous behaviour and unreliable predictions. We present ADEPT, a speedup and
runtime prediction tool that satisfies all criteria for both single problem size and across
different problem sizes of a parallel application. ADEPT is also capable of handling
vi
experiments with MPI and OpenMP implementations of NAS benchmarks and seven real
vii DEDICATION
I dedicate this dissertation to my wife, Golriz Mirarab, who was with me every step of
viii ACKNOWLEDGEMENTS
First and foremost, I would like to thank my supervisor, Dr. Robert Kent, for his
outstanding and continuous support of my PhD studies, which made this dissertation
possible. His guidance and deep insights were invaluable to my studies. I also remain
indebted to him for his understanding and support during all the difficult times.
I would also like to thank all my committee members: Dr. Majid Ahmadi, Dr. Alioune
Ngom, Dr. Joan Morrissey, and the external examiner Dr. Shikharesh Majumdar. Thank
you for your great advice.
I would like to thank SHARCNET for partly funding this research. Input data for the
experiments was collected on CFI-funded SHARCNET resources. We thank John Morton
from SHARCNET for providing us with data on real applications.
I would like to thank my parents, Lotfali Deshmeh and Parvaneh Hashemi for their
support.
I would also like to especially thank my aunt Manijeh Deshmeh for all her love and
ix TABLE OF CONTENTS
DECLARATION OF CO-AUTHORSHIP / PREVIOUS PUBLICATION III
ABSTRACT V
DEDICATION VII
ACKNOWLEDGEMENTS VIII
LIST OF TABLES XII
LIST OF FIGURES XIII
NOMENCLATURE XIV
CHAPTER 1 1
INTRODUCTION 1
CHAPTER 2 BACKGROUND AND LITERATURE REVIEW AND ANALYSIS 7
2.1. PERFORMANCE PREDICTION 7
2.2. A TAXONOMY OF PERFORMANCE PREDICTION 11
2.3. BLACK-BOX METHODS 12
2.3.1. SIMILARITY TO OTHER APPLICATIONS 13
2.3.2. SIMILARITY IN TERMS OF BENCHMARKS AND HARDWARE METRICS 16
2.3.3. SIMILARITY:THE CONCEPT OF SKELETONS 17
2.3.4. BLACK-BOX METHODS USING MATHEMATICAL AND STATISTICAL MODELS 18
x
2.4. WHITE-BOX METHODS 21
2.4.1. ANALYTICAL MODELING 21
2.4.2. WHITE-BOX METHODS USING SIMULATION 27
2.5. GRAY-BOX METHODS 31
2.6. EVALUATION METHODS AND APPLICATIONS OF PERFORMANCE PREDICTION 34
2.7. KEY INSIGHTS PROVIDED BY THE LITERATURE 37
2.7.1. JOB’S SIZE,RUNTIME, AND POTENTIAL CORRELATIONS 37
2.7.2. USER BEHAVIOR:SESSIONS,LOCALITY,CYCLES, AND ESTIMATES 38
2.8. CHALLENGES AND OPEN PROBLEMS 42
2.8.1. CROSS-PLATFORM PERFORMANCE PREDICTION 43
2.8.2. PROBLEM SIZES AND INPUT PARAMETERS 46
2.9. SUMMARY 47
CHAPTER 3 ADEPT RUNTIME AND SPEEDUP PREDICTION 49
3.1. ADEPT’S GOALS 49
3.2. RELATED WORK 52
3.3. THE DOWNEY MODEL 54
3.3.1. OVERVIEW 54
3.3.2. STRENGTHS AND WEAKNESSES 55
3.4. THE ADEPT PREDICTOR 57
3.5. OBTAINING THE PREDICTIVE MODEL WITH ADEPT 59
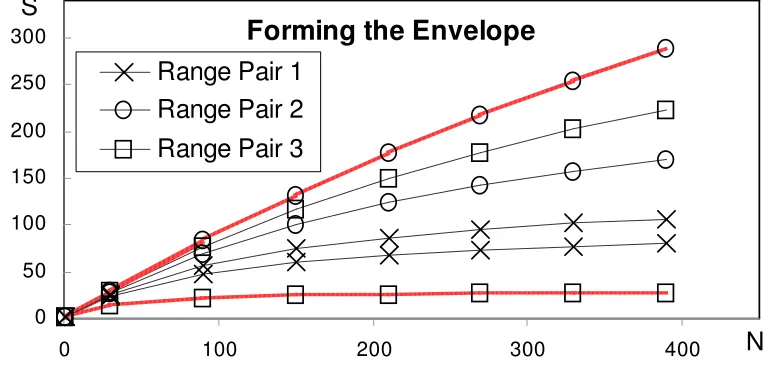
3.5.1. ENVELOPE:DERIVING CONSTRAINTS FROM OBSERVATIONS 59
3.5.2. CURVE FITTING:THE SEARCH FOR AN OPTIMAL MODEL INSTANCE 63
3.6. EFFECTIVENESS OF ADEPT’S CURVE FITTING 64
3.7. EXPERIMENTAL SETUP 66
3.8. EXPERIMENTAL RESULTS FOR MODEL DERIVATION 67
3.8.1. SPEEDUP PREDICTION 67
3.8.2. RUNTIME PREDICTION 71
3.9. ANOMALY DETECTION 73
xi
3.9.2. INDIVIDUAL ANOMALOUS POINTS 74
3.9.3. SPECIFIC SCALABILITY PATTERNS 77
3.10. AUTOMATED RELIABILITY JUDGMENT 78
3.11. PERFORMANCE PREDICTION: THE HYPOTHESIS 81
3.11.1. ACCURACY 82
3.11.2. EFFICIENCY 82
3.11.3. ROBUSTNESS 83
3.12. ADEPT CROSS PROBLEM SIZE RUNTIME AND SPEEDUP PREDICTION 83
3.13. EXPERIMENTAL RESULTS: PERFORMANCE PREDICTION ACROSS PROBLEM SIZES 86
3.13.1. SPEEDUP PREDICTION ACROSS PROBLEM SIZES 86
3.13.2. EXPERIMENTAL RESULTS:RUNTIME PREDICTION ACROSS PROBLEM SIZES 88
3.14. GENERAL APPROACH FOR DETECTING AND HANDLING ANOMALIES OVER DIFFERENT PROBLEM SIZES 90
3.14.1. INDIVIDUAL ANOMALOUS POINTS 91
3.15. RELIABILITY JUDGMENT ACROSS PROBLEM SIZES 93
3.16. SUMMARY 93
CHAPTER 4 CONCLUSION AND FUTURE WORK 96
4.1. CONCLUSIONS 96
4.2. FUTURE WORK 98
REFERENCES/BIBLIOGRAPHY 100
APPENDICES 117
APPENDIX A.ENVELOPE DERIVATION VIA CLOSED-FORM SOLUTION FORMULA 117
CLOSED-FORM SOLUTION FORMULAS 117
ENVELOPE DERIVATION FORMULAS 121
APPENDIX B.PERMISSION LETTER TO INCLUDE PREVIOUS PUBLICATION 124
xii LIST OF TABLES
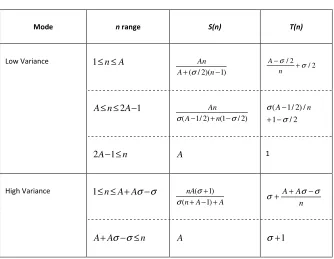
Table 1. S and T piecewise functions of Downey model. ... 56
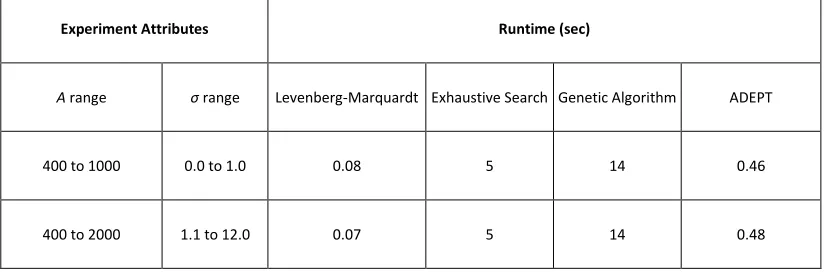
Table 2. Comparison of runtime of ADEPT with three curve fitting methods ... 63
xiii LIST OF FIGURES
Figure 1. A taxonomy of performance prediction methods ... 12
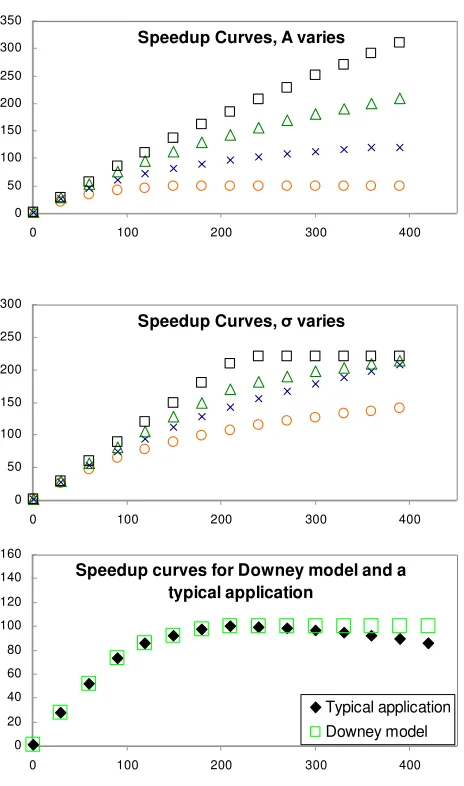
Figure 2. Downey model speedup curves ... 55
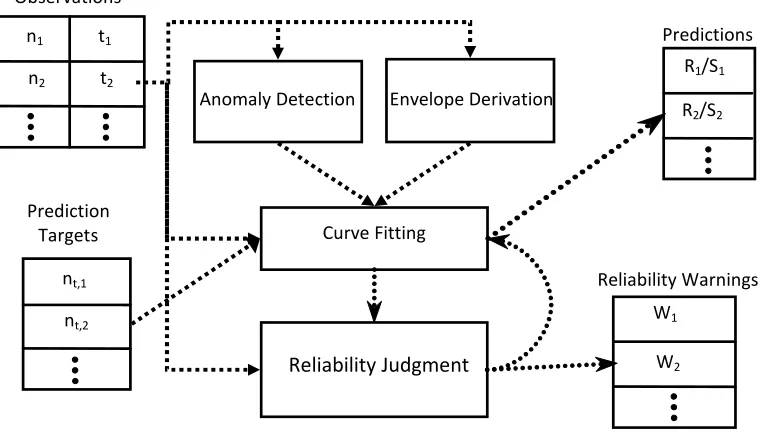
Figure 3. ADEPT components; Arrows show information flow ... 57
Figure 4. Forming the envelope ... 60
Figure 5. Speedup prediction of ADEPT, GA, exhaustive search, and Levenberg-Marquardt. ... 65
Figure 6. Speedup prediction results for NAS benchmarks ... 69
Figure 7. Speedup prediction results for the anonymous real world applications ... 70
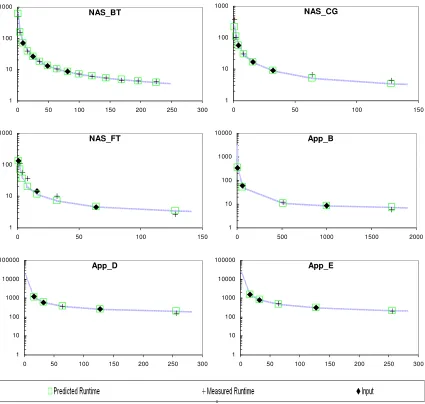
Figure 8. Runtime prediction results for NAS benchmarks and anonymous real applications ... 72
Figure 9. Detection and handling of individual anomalous points. ... 76
Figure 10. Detection and handling of specific scalability patterns. ... 79
Figure 11. Reliability judgment ... 80
Figure 12. Speedup prediction results across problem sizes, NAS BT, FT, and SP ... 86
Figure 13. Speedup prediction results across problem sizes for NAS CG and LU. ... 87
Figure 14. Runtime prediction across problem sizes, NAS BT, SP, and FT. ... 89
Figure 15. Runtime prediction results across problem sizes, NAS CG and LU ... 90
xiv NOMENCLATURE
ADEPT: Automatic Downey-based Envelope-constrained Prediction Tool
Adaptive Resource Allocation: Allocation of resources to different applications
based on the current system load, which allows a job scheduler to adapt its decisions to
the current status of the system.
Black-box prediction: a category of prediction methods that depend only on
external observation of application’s behavior, e.g. its runtime.
White-Box prediction methods: a category of prediction methods that depend
on internal knowledge of the target application, e.g. the number of iterations in the
main loop.
Gray-box prediction methods: a category of prediction methods that combine
1 CHAPTER 1
Introduction
A job scheduler determines the order and duration of the allocation of
resources, e.g. CPU, to the tasks waiting to run on a computer. Round-Robin and First-Come-First-Serve are examples of algorithms for making such decisions. Parallel job
schedulers need to make such resource allocation decisions for applications that need
multiple CPU cores, on computers consisting of many CPU cores connected by different
interconnects. An adaptive parallel scheduler is a scheduler capable of adjusting its
resource allocation decisions based on the current resource usage and demand. This
resource allocation method is referred to as adaptive resource allocation. Adaptive
parallel schedulers that decide the numbers of CPU cores to allocate to a parallel job
provides more flexibility and potentially improve performance significantly for both
local job and grid job scheduling compared to non-adaptive schedulers. Adaptive CPU
resource allocation is a widely researched topic in job and grid scheduling with potential
to improve response times significantly (up to 70%) by reducing fragmentation and
considering the current machine load [V.K.Naik 1997][W. Cirne 2003] [A.C.Sodan
2006][L.Barsanti 2006]. Taking the current machine load into account contributes most
to the improvement of response times. These improvements are achieved by running
applications with more resources if the current machine load is light, and with fewer
resources if the load is heavy [V.K.Naik 1997][A.C.Sodan 2009]. This is due to the typical
shape of efficiency curves which describe how well the processor cores allocated to a
parallel application are utilized in terms of serial runtime divided by allocated numbers
of cores and the corresponding runtime, i.e. diminishing efficiency beyond an
application-specific numbers of cores.
Adaptive resource allocation is a practically promising approach, considering that
2
resource allocation at start-time [W.Cirne 2003]. Adaptive resource allocation depends
on efficiency curves per problem size (strong scaling) since efficiency-based allocation
was found superior to uninformed approaches like equal resource partitioning
[S.H.Chiang 1996]. However, scalability and efficiency curves, which show the the obtained speedup (serial runtime divided by runtime for a specific number of cores) and
utilization of cores for different numbers of allocated cores, are not generally available;
this is a major reason why adaptive resource allocation is not yet incorporated in
practical schedulers. Thus, providing scalability prediction in an easy-to-use manner
would open new possibilities for better practical scheduling. Users may also select job
sizes “tactically” under considerations of trading shorter waiting times for increased
runtimes.
Scalability prediction is also relevant for determining the maximum meaningful
CPU resource allocation to a parallel job (and therefore an often-tackled problem, e.g.
[X.H.Sun 1999]) as feedback to users and system administrators. Though so far applied
mostly on clusters, with the emergence of parallel computing in every-day life on
multi-core systems, adaptive schedulers will likely increase in practical relevance. This is
especially true if the resources allocated to a virtual-machine running parallel jobs can
vary [A.C.Sodan 2009]. Fortunately, OpenMP applications on multi-core SMP servers
were found to exhibit similar shapes of speedup/runtime curves as MPI applications on
clusters [M.Curtis-Maury 2005]. This opens the possibility of applying the same
scalability prediction approach.
Accurate predictions can be obtained via either black-box or white-box
approaches. The latter are based on application-internal and machine information,
require code instrumentation, compiler/OS support, analysis of memory-access
behavior, simulation, etc. [L.Carrington 2003][B.Lafreniere 2005][G.Marin 2004]
[X.H.Sun 1999]. Thus, white-box approaches are complex and computationally
3
though indispensable for cross-site prediction or projection of performance on not yet
practically available platforms. Black-box approaches predict scalability (speedup and
runtime) using only runtime observations on different numbers of nodes, by assuming
conformity to a simple descriptive model which can be fitted to the observations to
derive a specific model instance. The required observations can easily be obtained from
data routinely collected in historical databases by supercomputer centers or from
explicit test series. This makes black-box approaches much easier and much cheaper to
apply. However, to be practical, the number of required observations needs to be small.
We have performed a survey on the existing methods for performance
prediction, the result of which is a taxonomy of these methods, as well as details on
their strengths, weaknesses, and an analysis of open problems. This survey forms a key
contribution of our work, as well as a basis on which we build our hypothesis.
Based on our survey and taxonomy of performance prediction methods, our
overall goal is scalability prediction (in the sense of strong scaling), on both multi-core
SMP servers and clusters, which is practically feasible for production environments. To
enable production use, we apply a black-box approach based on the Downey model
shown to capture simplified behavior of parallel applications very well [A.Downey 1997
Model]. The Downey model has been around for a long time but has not been widely used due to many real applications not fully conforming to the model, e.g. by showing
super linear speedups, and due to reliability of a specific prediction being hard to judge.
As described in [A.Deshmeh 2010], with the development of ADEPT (Automatic Downey-based Envelope-constrained Prediction Tool), we pursued the following
detailed goals:
• Achieve high prediction accuracy, while requiring only few observations (typically
4
• Provide a computationally efficient approach for deriving the model instance.
• Identify cases where the application does not fully conform to the Downey model
as anomalies, with automatic correction and multi-phase modeling for individual
irregular points and typical patterns.
• Perform reliability judgment which recognizes unsuitable observation layout and
proposes placement ranges of additional observations.
We decomposed the problem of performance prediction in a production
environment into the sub-problems as outlined according to the above requirements.
First, we developed a black-box performance prediction tool capable to fitting Downey
model instances to observations assumed to conform closely to the model. This
provided the basic functionality in ADEPT. We next addressed the challenge of
anomalous behavior in parallel applications, by studying different and typical scalability
patterns. This resulted in development of a metric for measuring how well-behaved a
particular parallel application is, by calculating a magnitude of deviation from the
expected behavior. The developed metric was extended to cover applications for which
serial runtime is not known. We then studied reliability problems when making
performance predictions, and compiled a list of reliability problems and their symptoms.
This allowed us to develop responses to each of these challenges for our prediction tool.
As result of these steps, ADEPT employs a special envelope-derivation technique which constrains the search for the best-fitting model instance, a special metric for detection
of anomalies, and special pattern handling for cases like super-linear speedup. To
validate our prediction tool, we studied the evaluation methods used in the literature
for performance prediction methods, the results of which are presented in Chapter 2.
The result of this study was the selection of one of the most widely used target
benchmark set, as well as several real world applications to further ensure applicability
5
Experiments with the NAS benchmarks [D.H.Bailey 1995] and seven real
applications show the efficiency and prediction quality of ADEPT in handling normal
cases and anomalies. We obtained generally above 80% prediction accuracy, even in
cases with anomalies and for predictions which extrapolate for more than twice the
number of nodes that were used in the closest observation. The experiments also
demonstrate the effectiveness of reliability judgment.
Having achieved highly accurate predictions for a single problem size, we next
focus on the performance prediction across problem sizes for a parallel application. The
main motivations for this move are: 1) there are potentially significant benefits for a
scheduler if such predictions are available; it makes possible adaptive scheduling as
users move to larger problem sizes of the same application, and 2) there are not any
existing black-box prediction tools that address this issue. We propose an extension to
ADEPT which makes it capable of addressing cross problem size performance prediction
with the addition of one extra input: the problem size for which the observations are
made.
To summarize, the contributions of this dissertation are as follows:
• An extensive survey on the state of the art of performance prediction
methods
• A novel performance prediction method, which can be utilized by users
and parallel application schedulers to obtain runtime and scalability curves of parallel applications. For schedulers, this can result in significant
improvement of performance metrics, as previously described.
• The proposed prediction method is highly applicable, in terms of its
requirements, i.e. 3 or 4 observations of runtime on different numbers of
6
adaptive parallel application scheduler to obtain predictions of parallel
applications’ runtime and scalability despite the constraints of a
production environment and the need for predictions on many parallel
applications. As described by our survey in the next chapter, this
possibility is not offered by other prediction methods.
• The high accuracy of the prediction method, which is comparable to
expensive, white-box performance prediction methods.
• The capability of the prediction method to make predictions without
assistance from the user or OS-level support
• The capability of the prediction method to handle anomalous behavior by
parallel applications, which makes the method robust, further increasing
its applicability in a production environment.
• The capability of the presented prediction method to identify unreliable
predictions, correct them when possible and generate warnings
otherwise, in order to avoid misleading the user of the tool (whether the
user is a human or an adaptive parallel application scheduler).
• The capability of the method to make predictions across different
problem sizes of a parallel application, thus increasing its applicability.
The rest of this dissertation is organized as follows. In chapter 2, we present the
background on performance prediction, as well as our survey which provides a
taxonomy of the existing performance prediction methods. In chapter 3 we describe the
structure of ADEPT, its contributions, and the experimental results. Chapter 4 draws
7 CHAPTER 2
Background and Literature Review and Analysis
2.1. Performance Prediction
Performance prediction is the task of providing an estimation of the
performance of an instance of an application on a specific platform, where the
application of interest may be serial, parallel, or distributed, and an instance of the
application of interest is identified as the combination of input parameters that
determine the problem that is being solved as well as the properties of the solution. The
platform may be a single CPU, a multi-core desktop machine, a cluster with tens to
thousands of cores connected by interconnects, or a distributed grid environment.
Backfilling schedulers, a common type of production scheduler for local
scheduling on clusters, depend on performance prediction in terms of jobs’ runtime
estimations to perform backfilling. Usually the user is asked to provide an estimate of
the runtime of the job he/she is submitting, and underestimation is punished by killing
the job once it runs past the estimation. Studies have shown that user runtime estimate
are generally inaccurate [A.W.Mu’alem 2001]. There have also been several papers in
the literature claiming, counter-intuitively, that inaccuracy in runtime estimation
actually improves the performance of the scheduler, suggesting better performance of
the scheduler if the runtime estimates are doubled [A.W.Mu’alem 2001], [D.Zotkin
1999], or even for randomized runtime estimates [D.Perkovic 2001]. However, these claims were negated by more recent research work. In a keynote speech, [D.Tsafrir,
2010] emphasizes that, despite some previous claims, inaccuracy in runtime estimation
does not lead to better scheduler performance. In [D.Tsafrir 2007], authors demonstrate
that doubling the runtime estimation improves the performance of the backfilling
scheduler, but does so to an even higher degree if the original estimate is accurate,
8
[S.H. Chiang 2002] emphasizes the importance of accurate runtime prediction by
evaluating the performance of a backfilling scheduler on heavy loads and a leading edge
production platform, and concluding that accurate estimations can improve the
performance of the scheduler much more significantly than was assumed before.
Moreover, authors conclude that users who provide accurate runtime estimations will
observe performance improvements even if other users do not provide accurate
estimates. The improvements are so large that authors suggest the use of test runs to
obtain accurate estimations.
[D. Tsafrir 2007] paves the way even further for incorporating performance
prediction into production schedulers by separating its two historical roles of providing
backfilling information and providing killing times for jobs, i.e. the system does not kill
jobs if they are longer than the system generated predictions. Instead, predictions are
corrected adaptively if they are proved wrong. [D.Talby, 2006] describe another
important application of performance prediction in job schedulers, which is assisting in
scheduling of moldable jobs: the scheduler must decide whether it is best to wait and
start the job later with more processors, or start the job immediately. This decision has
to be based on prior knowledge of jobs’ runtimes. [D.Talby, 2006] also proposes a
standard interface for all predictors, to increase the applicability to production
schedulers. A similar application is proposed by [W.Smith 1999], which uses runtime
predictions to estimate queue wait times.
A detailed discussion on the role of performance prediction in various aspects of high-performance computing is presented in [K.J.Barker 2009]. These roles include the
design of new machines which uses performance prediction to explore the extremely
large design space, the decision of which new platforms to acquire which uses
performance prediction to do a cost-benefit analysis, and the installation of new
systems which uses performance prediction to verify the installation. [J.Zhai 2010]
9
systems and proposes a method that accordingly assumes the availability of a single
node of the new platform for performance prediction. [D.J.Kerbyson 2002] uses
performance modeling and prediction for exploring platform architectures. Similarly,
[E.Ipek 2006] discuss the use of performance prediction for making design decisions for
new parallel systems. [L.T.Yang 2005] suggests that scientists can choose a parallel
system for their application based on prediction of application’s performance on
available platforms. [K.Davis 2009] accurately predicts the performance of two
petascale applications on an HPC platform before and after an upgrade, emphasizing a
potential key role for performance prediction in HPC platform upgrade decisions.
Performance prediction has also been used for performance tuning of parallel
applications [A.Tiwari 2009], [K.Singh, 2010], and for performance tuning and identifying
performance bottlenecks [G.Marin, 2007]. According to [R.Sarikaya 2010] performance
prediction can be used for the improvement of power-performance decisions in
dynamic power management.
A case for the importance of scalability prediction is made in [W.Cirne 2003], by
specifying that 98% of the users think their jobs can adapt to different numbers of
processors at start-time. A speedup model can assist scientists in deciding whether to
make a request for the allocation of a larger numbers of cores on a cluster, e.g.
SHARCNET [SHARCNET] holds regular rounds of applications for large numbers of cores
on its clusters. Considering the costs associated with making and processing such
applications makes a case for a speedup model. [A.Duran 2008] uses speedup prediction to dynamically determine the number of OpenMP threads to create for an application.
[Z.Wang 2009] predicts scalability on multicore machines for OpenMP programs.
[K.Singh 2010] proposes a method for dynamic concurrency throttling, which is reducing
the number of threads of an application for particular phases which are expected to
10
power efficiency (reducing power usage when it is not beneficial for scalability), while
improving performance.
Performance prediction is also needed in grid computing. [W.Smith 2010]
describes the implementation of a queue wait time prediction service on TeraGrid
[TeraGrid], based on runtime prediction. [F.Guim 2008] proposes a grid scheduler that
depends on runtime predictions implemented as a service. [K.Kurowski 2005] mentions
that grid resource brokers need estimations of job start time and job execution time to
make decisions, rather than depending on simpler parameters like load. Similarly,
[S.H.Jang, 2005] shows that selecting a site in a grid for execution based on performance
prediction rather than using load information (i.e. assuming that the site with the lowest
load will provide the shortest execution time), results in performance improvement.
[U.Farooq 2009] presents a middleware framework for grids, which is capable of
handling incorrect estimations of application runtimes, thus implying the potential
benefits from accurate runtime estimations. [J.Zhai 2010] specifies that grid schedulers
need estimations of individual workflow activities execution time to map workflow
activities to different grid sites. [N.K.Kapoor 2010] describes matching resources to jobs
using classes assigned to them according to their service demands; the proposed
method is compared to one that requires a priori knowledge of jobs resource usage
characteristics. [S.A.Jarvis 2006] presents two prediction-based middleware services and
their usage to support the execution of a workload on a set of resources on grid.
[F.Nadeem 2009] specifies the prediction of workflow execution time as having critical importance for optimization of workflow executions, and advance reservations of
resources. [Nirav 1999] emphasizes the importance of runtime prediction in grid
computing for resource management. [C.Glasnerlow 2011] specifies runtime prediction
as a supporting service for schedulers used in grid computing.
The preceding discussion establishes a key role for performance prediction in
11
particular. The rest of this chapter is organized as follows. Our taxonomy of different
approaches and a survey of the state-of-the-art in performance prediction are
presented in Section 2.1. Sections 2.2 through 2.5 provide details on each category of
methods. We provide a list of key insights relevant to performance prediction in Section
2.6. Finally, our list of open problems and their importance is delivered in Section 2.7.
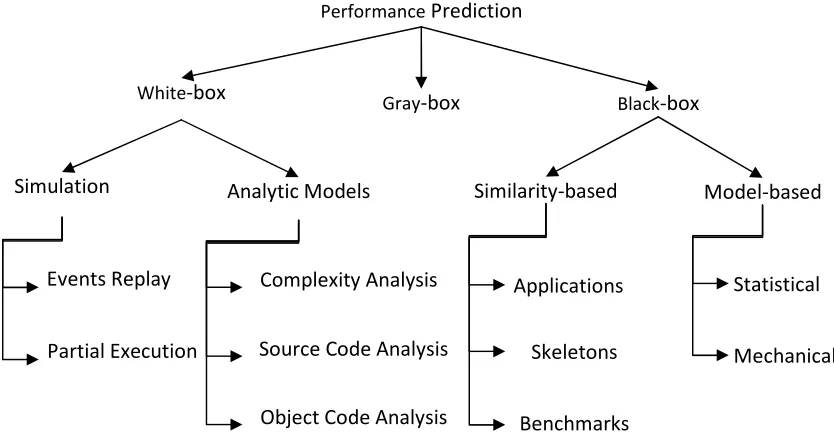
2.2. A Taxonomy of Performance Prediction
We consider the main aspect of distinction among performance prediction
methods to be the level of abstraction at which they operate. In the literature, three
different terms have been specified for these levels, which we will use as well
throughout this report: black-box, white-box, and gray-box methods, as shown in Figure
1. We will describe each of the categories shown in Figure 1 in its own section, with
subcategories shown in the figure described in the corresponding subsections. These
differ in accuracy, cost and ease of use. The terms used in Figure 1 have been previously
introduced by the literature, and organized by our taxonomy. At the lowest level of
abstraction, white-box methods use information that is either only known by developers
of the application or can be obtained through modification of application’s source code
or binary. These techniques consist of subcategories working at differing levels of
abstraction. The main advantages of white-box approaches are their accuracy and the
ability to answer what-if questions regarding performance. Their main disadvantage is
the support they need in terms of developer/expert time, compiler/OS/tool support, etc, which makes them unsuitable for production environments. Black-box methods are
on the other extreme, assuming only external knowledge regarding the application or
platform, e.g. runtime and number of processes, usually obtained from logs of user
activity across time/platform. The main advantage of this category is the potential for
12
schedulers due to underestimation of runtime, need to be resolved to actualize the wide
applicability [D.Tsafrir 2007]. Gray-box methods operate at the middle abstraction level,
attempting to maintain the applicability of black-box methods, while utilizing a subset of
low-level information used by white-box methods, which is mainly problem size
specified as a combination of input parameters.
2.3. Black-Box Methods
Black-box methods provide predictions without any “inside” information, i.e.
only the external behavior of application is available, using two general approaches: 1)
relating to behavior of “similar” applications/benchmarks, and 2) assuming a general
behavior model, fine-tuned via model-fitting.
Performance Prediction
White-box Gray-box Black-box
Similarity-based Model-based
Applications
Skeletons
Benchmarks
Statistical
Mechanical Simulation
Events Replay
Partial Execution
Analytic Models
Source Code Analysis Complexity Analysis
Object Code Analysis
13 2.3.1. Similarity to Other Applications
The main idea here is that “similar” applications have reasonably close
performances; hence if a set is formed of applications similar to the target, predictions
can be made using observations on applications in this set [R.Gibbons 1997], [A.Downey
1997], and [W.Smith 1998]. The identification of similar applications requires the
existence of historical information; these may be gathered in supercomputing centers,
and there exists an archive of multiple centers logs [Parallel Workload Archive]. Most
methods identify similarity on a per-site basis even if multiple logs are examined,
probably because each center has its own unique set of applications and users. To
identify similar jobs, [H.Li 2005], [W.Smith 2007], and [T.N.Minh 2010] use
instance-based learning on jobs’ attributes and [F.Guim 2008] constructs decision trees. In
[W.Smith 1998] and [W.Smith 2004], sets of jobs’ attributes, called similarity templates,
are used to form groups of similar jobs. For example, the template (Username, N) places
jobs with the same username and numbers of nodes in the same similarity group.
Templates are determined using greedy and genetic algorithm search on a workload.
The effectiveness of a template is related to measured mean error of the predictor fed
the sets formed by applying the template to the workload. [K.Kurowski 2005] propose
the GPRES expert system which also uses similarity templates but stores the extracted
job-category-determination rules in a knowledge base. [F.Nadeem 2009] constructs
similarity templates using supervised exhaustive search on grid workflow-level attributes, e.g. set of activities, application-level attributes, e.g. problem size,
execution-level attributes, e.g. set of grid sites, and resource-execution-level attributes, e.g. jobs in the
queue. [C.Glasnerlow 2011] uses a set of similarity rules (e.g. jobs submitted between
8am to 4pm are similar) and the resulting clusters of a single user’s jobs, which are
assigned relevance for a particular job type based on accuracies in previous predictions.
14
characteristics and performance are condition and decision attributes, respectively,
forming the similarity templates based on dependence degree of decision attribute on
each condition attribute. [R.Duan 2009] Uses specially-structured Bayesian networks
where factors are job attributes and correlation coefficients is used to discard irrelevant
factors. The probability distributions between factors are calculated from the
observations dataset.
The next step is to derive a prediction from observations on the set of similar
applications. [D.Tsafrir 2007] reports improved scheduler performance when taking the
average of the similar jobs from the user’s history, with higher accuracy from more
recent and less similar jobs than otherwise. [D.Talby, 2006] introduces a session-based
history (SBH) predictor, sessions being sets of an individual user’s jobs with at most 20
minutes between termination of one and submission of next, which uses the median of
similar jobs across multiple sessions. This is compared to recent user history (RUH)
predictor, which uses the median runtime of the last 3 terminated jobs of the user,
showing slightly higher accuracy for the former. As a result of experimenting with
different configurations of SBH, authors report improved results from using exact but
farther in the past (up to 30 sessions) matches versus using partial but more recent
ones, i.e. exact similarity is more important than proximity in time. In the extreme,
considering only the most recent session and ignoring similarity performed even worse
than RUH. [F.Nadeem 2009] uses the average of similar jobs, with the possibility of
shifting the prediction toward more recent items versus using all available observations. [S.Krishnaswamy 2004] and [T.N.Minh 2010] use the mean runtime of the set of similar
jobs. However, considering the context of the predictor in [T.N.Minh 2010], i.e.
backfilling scheduler, the number of underestimations is reduced by adding a fraction of
the standard deviation of K neighbors’ runtime to the estimation, and using the
user-provided runtime as the upper-bound for the estimate. In [R.Gibbons 1997], author
15
formation of sets of jobs for average calculation is not specified. In [W.Smith 1998] and
[W.Smith 2004], runtime prediction and its associated confidence interval are obtained
from multiple sets of similar jobs (called categories) by either calculating the mean of
runtimes or using linear regression with the number of nodes as the regression variable.
There is also a maximum on the number of jobs in each set, and the oldest job in the set
is discarded if that maximum is passed due to addition of a new job. If the target job
falls into several sets, a prediction is made per set and the prediction with the smallest
confidence interval is selected. In [W.Smith 2007], a prediction and a confidence interval
are obtained using a kernel regression method applied to the N observations that are
most similar to the target application, called query.
Genetic algorithm is used to search for optimum configuration of the regression
method, e.g. kernel function width, feature weights. ADAPS, proposed by [C.Glasnerlow
2011], uses multiple prediction methods applied to multiple sets of jobs formed based
on similarity. To make a prediction, job sets (active clusters) to be included are selected
and weighted average is taken among the predictions made per pair of job set and
method, where both the selection of job sets and weight assignments use accuracy
feedbacks. [F.Guim 2008] uses the C4.5 decision tree algorithm, which results in
prediction of ranges of runtime rather than point values. In [R.Duan 2009], authors use
an RBF-NN (radial basis function neural network), fed by a Bayesian network. The
Bayesian network provides the RBF-NN with a reduced number of dimensions and
probability tables (e.g. the probability that runtime is between 980s and 1080s when the preparation time job attribute is between 0s and 215s). In [K.Kurowski 2005], authors
propose a method based on similarity rules from a knowledge base, which uses the
arithmetic mean of the result variables of two target application-matching rules: the
one with highest specificity and the one with highest number of matching jobs. In [H.Li
fine-16
tuning the parameters of the predictor using a genetic algorithm search, where fitness is
based on prediction accuracy on training dataset,
2.3.2. Similarity in Terms of Benchmarks and Hardware Metrics
Another group of black-box methods attempt to predict by relating the
performance of target to that of benchmarks, usually based on hardware-level metrics
as these maintain the black-box constraint. [S.Sharkawi 2009] proposes a method for
predicting cross-platform, node-level performance, i.e. communication ignored, of
constant working-set size HPC applications by relating to SPEC CFP2006 benchmarks.
The overall approach is to use a genetic algorithm tool to derive a performance model
for the application as a weighted combination of similar benchmarks (called surrogates),
via examining relative contributions of 6 groups of hardware counter metrics, obtained
on a base machine, at both inter and intra group levels. Performance is predicted by
combining the model with the published performance data of benchmarks on the target
platform via solving the set of linear equations resulting from the latter, yielding the
platform-specific function H which relates runtime to benchmarks using 6 coefficients.
In [W.Pfeiffer 2008], Pfeiffer et. al. model the application runtime as the
weighted sum of published machine characteristics and measurements made by HPC
challenge micro-kernels (e.g. Peak flop, interconnect latency, memory bandwidth), with
weights being platform-independent application coefficients calculated by model fitting
on its runtimes across different platforms and numbers of cores. To make predictions for a platform, the model is combined with the measurements made by HPCC
benchmarks on that platform. The method addresses robustness and goodness of the fit
by checking for outliers and influential measurements, i.e. single measurements the
elimination of which significantly changes the fit. Backward elimination is employed to
17
fractions are gathered and a larger dataset for the fits is obtained by separately
specifying communication time as a function of related predictors. Authors suggest 15
to 20 measurements to fit three or four parameters for a given benchmark. In [F.Freitag
2001], Freitag et. al. propose a low-overhead speedup prediction method for a hybrid
application, i.e. one that uses a combination of MPI and OpenMP, via dynamic detection
of its iterative structure and parallel loops through monitoring the changing CPU usage.
Thomas et. al. introduce a profiling and performance analysis tool for MPI
applications, which does not require re-compiling or re-linking the target application to
obtain communication traces [D.Thomas 2010]. The tool can identify wait times due to
both collective operations and delay between send and receive operations. The tool is
then combined with hardware counter information to provide runtime estimates for
parallel applications.
2.3.3. Similarity: The Concept of Skeletons
In [S.Sodhi, 2008], Sodhi et. al. propose a similarity-based approach that
constructs a performance “skeleton” of the application: a synthetic, orders of
magnitude shorter program with a runtime that is a fixed portion of that of the
application, under any scenario/platform. The proposed method automatically
constructs skeletons via identifying and summarizing repeated patterns, i.e. segments of
similar system activity, in the application’s execution trace, leading to an execution
signature that is transformed into the skeleton. To obtain the signature, similar MPI calls are identified and represented with the same symbols, transforming the trace into a
string, which is compressed into a loop structure by recognition of repeated patterns. A
synthetic program that is representative of the signature, i.e. has similar execution
trace, is then constructed, using the identified loop structure to scale down the runtime.
18
with a profiling library. The computation time is calculated as the time between the call
and return of MPI routines, i.e. suffers the same problem as most other work in terms of
specifying the end of communication as the return time of the MPI call. The method is
currently more suitable for performance prediction under load sharing and not across
different platforms, i.e. different CPU and interconnects architectures. Computation is
only briefly specified, and memory subsystem behavior and its role in prediction is
skipped.
In [A.Toomula 2004] (mostly by the same group), a method is proposed for
constructing a skeleton program which has the same cache behavior, in terms of
number of cache misses, as its target application, on any platform. Because the
collection of all memory references of the target application is impractical, samples of
memory references are collected, using Valgrind tool [Valgrind], each sample being a
sequence of memory references long enough to capture temporal locality. The
references are stored as the number of the cache line they access, are clustered and
used to generate the skeleton’s synthetic C program. In [Q.Xu 2008] (from mostly the
same group), a method is proposed that constructs skeletons by combining traces from
multiple processes into a logical trace. In addition, authors specify the use of synthetic
computation code which is the same in duration, but does not entail the memory
behavior of the target application.
2.3.4. Black-Box Methods Using Mathematical and Statistical Models
A subcategory of black-box methods assumes general conformity of target
applications to an underlying model with coefficients determined for each application
19
In [H.A.Sanjay, 2008], application runtime is specified as an equation that
depends on functions of communication and computation complexity, amount of
parallelism in computation and communication, and CPU and network loads. Linear
regression is used to make predictions, and different functions are selected based on
the current load of CPU and network. A set of at most 20 candidate complexity functions
are determined by running the target application for different problem sizes on a single
non-dedicated CPU (for computation complexity), and on two non-dedicated CPUs (for
communication complexity), fitting the set of all potentially relevant complexity
functions to the observations, and choosing the functions with smallest fitting errors.
Scalability is modeled through functions specifying amount of parallelism in
computation and communication, via running the application on 2, 4, and 8 processors.
The overall obtained model is used to predict runtime under various values of loads,
number of CPUs, etc. In [R.Wu 2008], a pure mathematical approach specifies the
runtime of a parallel application as the maximum runtime of its processes and
individually models each process as a Johnson distribution. Tudor and Teo provide an
analytical model for speedup for shared-memory programs on multi-core systems,
which uses hardware counters and operating system run-queue [B.M.Tudor 2011]. The
model measures the number of cycles lost to memory contention and data dependency,
and calculates an estimated speedup loss due to these cycles. The proposed model is
evaluated on 6 OpenMP HPC dwarfs from the NAS benchmark suite.
2.3.5. Black-Box Methods Using Mechanical Models
Black-box models may use non-statistical models, which are based on certain
characteristics of parallel applications, and have been called mechanical models in the
literature. In [S.Shimizu 2009], Shimizu et. al. model resource consumption statistics, in
20
resource-specific terms including contention, e.g. = + ∗
+ ∗ , with the coefficients obtained by applying regression
analysis to observations of application across platforms. The model is claimed to
improve in accuracy as the number and variety of platforms are increased. In
[S.Venkataramaiah 2003], authors model the performance of a specific problem size of
the application as a function of application’s behavior and level of contention over CPU
and interconnect. The parallel application is run on a dedicated platform, and
measurements of CPU usage and network usage are combined with reassembly of
application’s messages and platform benchmarking results to determine the time each
CPU spends on computation, synchronization (wait), and communication, used to
predict the performance under different contention levels. CPU usage is monitored via
CPU probing, and tcpdump provides network traffic logs. In [A.Deshmeh 2010], the
ADEPT predictor is proposed which uses the Downey model [A.Downey 1997_2] as the
underlying model that explains the behavior of parallel applications. Observations of
target application’s execution times for the same problem size over different numbers
of processors are used for model fitting. A separate model fitting is done per prediction
target, assigning weights to observations based on their distance from the target
prediction point. ADEPT also handles individual anomalies in the observations by
introducing a novel heuristic that is based on expected scalability of a parallel
application. Anomalous behavioral patterns, e.g. major runtime improvements at
processor counts which are powers to two, are also handled via introduction of multi-phase modeling. ADEPT is also capable of detecting unreliable predictions, e.g. when
21 2.4. White-Box Methods
We divide white-box methods into two general categories: a) analytic modeling
which is composed of model-driven techniques; these are distinguished by the
abstraction level(s) at which the required analysis is performed: complexity level, source
code level, and object code level, and b) simulation, which covers techniques that base
the prediction on some mimic of the application’s execution; these too are distinguished
based on their abstraction level: overall structure-level abstraction leads to partial
execution, while instruction-level abstraction defines event replay techniques. There is
some degree of overlap among the two general categories, which we will point out.
2.4.1. Analytical Modeling
At the highest level of abstraction among analytical modeling techniques are
those that derive a performance model by analyzing an algorithm rather than an
application. In [K.J.Barker 2009], Barker et. al. construct a model of a generic five-point
stencil application by analyzing the general algorithm that the application follows. In
[J.Schopf 1998], Schopf et. al. analyze the performance of a stencil application, but
specify the parameters of the model as distributions rather than single values. In
[M.M.Mathis 2005] Mathis et. al. use complexity analysis to construct a model of mesh
particle transport computations. Such methods provide an overall expectation of the
performance of a specific solution regardless of the implementation details; they, however, run the risk of ignoring factors that critically influence the performance, e.g.
cache attributes of the target platform.
The next level of abstraction entails methods that employ source code analysis.
22
combine the two to obtain a symbolic model for performance prediction. Authors
provide mechanisms for translating specific parallelism patterns into models. They also
provide detailed methods and discussions for transforming different programming
constructs, e.g. pipelining, and phenomena, e.g. memory and network contention, into
the proposed modeling language. The PACE toolkit [G.R.Nudd 2000] separately models
the application and the platform, and combines the models to obtain performance
predictions. The toolkit is able to predict performance for different numbers of
processors. In [M.M.Mathis 2006], Mathis et. al. also separately model the application
and platform, using a modified version of the CHIPS performance specification language
[G.R.Nudd 2000]. A CHIPS model has a hardware specification component and a task
graph representation of the parallel application based on detailed knowledge of source
code. The proposed method predicts the time required per cell, processing unit of the
application, for different cells per processor.
In [S.R.Alam 2006], Alam et. al. propose a method for predicting workload and
memory requirements based on an API for MPI programs in FORTRAN and C, which
generates trace files that contain key events e.g. communication events, loop start/end,
floating point operations start/end. The constructed model is based on computation,
communication, and key input parameters of the application. In [L. Adhianto 2006],
Adhianto et. al. propose a prediction method that addresses hybrid applications (MPI +
OpenMP), which uses the compiler to obtain an application signature consisting mainly
of memory access patterns and floating-point operations. The method uses benchmarks to obtain platform characteristics, e.g. cache size, cache line size, clock speed, and the
parallelism overhead of MPI and OpenMP. [M.Nakazawa 2005] uses performance
prediction to find the best data distribution for a parallel application. It addresses I/O
cost as well as computation and communication cost for building a model of parallel
programs in terms of a set of equations. Micro-benchmarks are used to identify the
23
applications are iterative, and measures the time for instrumented run of one iteration
of the main loop to obtain computation, communication, and I/O cost. Manual analysis
of the source code is required to identify parallel sections, which are then instrumented
to obtain their computation time and I/O time. The computation times for different
amounts of work are obtained using these measurements.
In [Z.Wang 2009], authors propose a machine learning-based method to
determine the best number of threads for an OpenMP program on multicore machines,
based on prediction of the scalability curve of the program. A neural network and a
support vector machine are trained off-line on features extracted from a set of
programs, and are fed the features of new programs to output the optimum number of
threads and scheduling policy. The features that are to be provided on both training set
programs and the new program are extracted from both the source code, e.g.
load/store, branch count, and dynamically using source code instrumentation, e.g. L1
data cache miss rate. [T.Fahringer 2000] proposes a performance prediction framework
which uses the source code written in HPF and instrumentation to obtain a model of the
parallel application based on work distribution, communication parameters, cache
misses, and computation time. To predict computation time, it uses the runtime of
kernels executed on the target architecture. [J.Li 2009] introduce a method that uses
neural networks for predicting execution time of functions (tasks) of an application
using its source code; the input to the neural network is the previous runtimes and input
parameters. The neural network then predicts execution time and size of output (since it affects cost of communication between tasks) for the function. The application needs
to be written in a language called R script to be processed by the predictor.
There exist varying levels of abstraction among methods that depend on source
code analysis. Methods at higher levels of abstraction specify the application’s runtime
as a function of problem size, data distribution, etc. This usually allows only the implicit
24
e.g. [G.Marin, 2007] specify the control flow graph of the application and identifies the
basic blocks and the set of operations they perform. These allow the explicit
consideration of platform capabilities, e.g. specifying how much time each basic block
needs on a particular platform based on the block’s needs and platform’s resources, at
the cost of more expert time and potentially the added requirement of instrumenting
the runs to obtain some of the required metrics, e.g. number of floating-point
operations of a basic block.
Methods in the final group of analytical modeling analyze the object
code/executable of the target application, via instrumentation. A typical example of
using instrumentation is obtaining communication characteristics of applications, e.g.
how many bytes are sent on average per process, what is the average message length,
what percent of the communication operations are collective and thus may involve long
waits, etc. As in code analysis, the resulting application model may need to be combined
with a platform description to provide performance predictions. Instrumentation of
applications’ binary or source code attempts to automate at least some parts of the
code analysis to reduce the time required of a performance specialist or the developer
or to replace them; the latter may result in some sacrifice in terms of accuracy of the
constructed model.
In the Prophesy project, [V.Taylor 2003] specify the main innovation to be the
automatic modeling component. The main measure is the coupling parameter that
specifies the interaction among kernels that make up an application. A kernel is a logical unit of work; it may be a loop, a file or a procedure. The coupling value between two
kernels is the result of the division of their consecutive execution by the sum of their
individual execution (measurements for each of these terms is done in the form of a
loop execution either an individual kernel or a chain of 2 or more kernels) [X.Wu 2004].
The data collection component of the Prophesy framework collects data using
25
component provides three methods: curve-fitting, parameterization, and kernel
coupling. In curve-fitting, the user selects the data and the method to use, and models
the application runtime, communication performance, etc. as a function of some or all
of the input parameters of the application. The parameterization method involves
hand-counting the number of different operations in the code, and grouping them to
construct formulas which contain coefficient that can be determined from the database
using hand-written scripts. The Valerie Taylor group has used the Prophesy project for
runtime prediction on different HPC applications [X.Wu 2006_1], [X.Wu 2006_2]. The
kernel coupling measures the interaction between kernels by dividing the combined
runtime of kernels (runtime of kernels when they are run in sequence) by the sum of
their individual runtimes. These runtimes are measured by placing one or more kernels
into a loop such that the loop dominates the runtime, measuring the new runtime, and
subtracting the time required for execution of the rest of the application from the
obtained runtime. The application runtime is then modeled as the summation of kernel
models (kernel models seem to be developed using the parameterization method,
multiplied by the number of times it is executed in the application), each multiplied by a
coefficient which is calculated as a linear function of kernel coupling values.
[V.Taylor 2001] proposes a method to automate the development of analytical
models of parallel and distributed applications. Data about an application are gathered
via instrumentation and stored in an application performance database (also the
compilers, libraries, and the control flow). There is also a model template database, and a systems characteristics database. The goal is to use the three databases to make
predictions on performance of an application on different system configurations.
Specifies three modeling methods: curve-fitting, parameterization (these two are also
specified in other Prophesy papers), and composition. The argument for
parameterization which is manual is that parallel applications are composed of a few
26
seems to be the same as kernel coupling method specified in later relevant papers.
Runtime prediction is done for an example application (matrix multiplication), and an
FFT benchmark from NPB suite. According to [V.Taylor 2002] kernel coupling values are
weighted based on the fraction of the runtime attributed to the corresponding kernels.
It should be noted that kernel coupling values can be generated in a pair-wise manner
(i.e. for pairs of kernels) or for chains of 3 or more kernels. The exploration of which
number of kernels in the chains leads to better results is left for future work.
He, et. al., propose a method for identification of data flow patterns in parallel
programs, e.g. reduction, which can be used for performance prediction [J.He 2011].
The source code of the application is used in static analysis to classify the data flow as
one of the 5 defined patterns. The loop nest structure is extracted from the
intermediate presentation of the code prepared by the compiler, and all the
assignments are examined to construct a graph relating the result to the program
variables. A reduced form of this graph is then compared against the predefined graphs
for recognition of data flow pattern. Authors then relate the performance of several
synthetic benchmarks to those of NAS benchmarks, by matching the data flow patterns.
[L.Carrington 2003] independently models both computation and
communication operations of parallel applications (called application signature) and
machines (called machine profiles), and convolves the two models (separately for
computation in terms of a single processor model: memory and floating-point operation
needs / corresponding machine rates, and communication) to predict application runtime on a specific machine. The machine profile is composed of machine’s capability
to perform certain operations, e.g. peak floating point rate, obtained via low level
benchmarks called probes. Performance of 3 scientific applications is modeled, with
generally below 20% runtime prediction errors. The paper also provides a discussion on
using the model for sensitivity study (e.g. what would be the performance of the