*Corresponding Author 141
WHAT IS THE INFLUENCE OF THE GLOBAL ECONOMIC CRISIS ON THE
DEVELOPMENT OF THE WAGE DISTRIBUTION OF CZECHS AND
SLOVAKS?
Diana Bílková
1*
1University of Economics, Prague Faculty of Informatics and Statistics Department of Statistics and Probability Sq. W.
Churchill, Prague 3 Czech Republic, University of Business, Prague Department of Information Technology and Analytical Methods Spalena Street, Prague 1 Czech Republic
ABSTRACT
This paper deals with the development of wage distribution by gender in the Czech and Slovak Republics in the years 2005–2012. Special attention is given to the changing in the behavior of the wage distribution in relation to the onset of the global economic recession. The different behavior of the wage distribution of Czech and Slovak employees during the period is the subject of research. The article discusses the differences in wage level between men and women in the Czech and Slovak Republics. There are the total wage distributions of men and women together, both in the Czech Republic and in the Slovak Republic on the one hand, and wage distributions according to the gender separately for men and for women on the other hand. Comparison of wage levels in the world and the position of wages of the Czech employees in the international context is included, too.
© 2014 AESS Publications. All Rights Reserved.
Keywords:
Wage distribution according to the gender, Wage growth, Financial crisis, Wages of Czech and slovakemployees, Gini coefficient of concentration, Development of wage, Forecasts of wage distribution, Wages in the world.
JEL Classification:
J31, G01, H24, E24, D31, O15.1. INTRODUCTION
Development of employee wage of Czech and Slovak Republics in the last two decades requires
us to pay more attention to the issues of their differentiation in the research. This leads to strong
changes in this area. Wage structure of the population changes, the level and differentiation grow.
Groups of people with very high wages arise here and they are gradually becoming more
pronounced. In the research of wage differentiation it is not enough to focus only on the assessment
Asian Journal of Economic Modelling
of the current situation and forecast future development based on the average wage broken down by
different socio-economic, time-spatial and demographic considerations, but it is helpful to move
from the level characteristics to the whole of frequency distribution.
Considerable attention is paid to the wage and income distribution in the statistical literature. A
number of authors in the Czech and Slovak Republics dealt with the analysis of wage and income
distribution, see for example Bílková (1995), Bílková (2012), Marek (2010) or Pacáková and
Sipková (2007). Many authors researched the area of
wages and incomes also in the w
orld,see for example Behr (2007), Kaasa (2006), Mallick (2008), Milanovic (2002), Monti and Santoro
(2009), Rothschild (2005), Wessels (2008), and Wolff (2009). Publications of Italian author are
very famous in the world, see Dagum (1997) and Dagum (1999). Because the establishment and
development of the minimum wage influence strongly the development of the wage and income
distribution, considerable attention is paid to the issue of minimum wage in the statistical literature,
see Cunningham (2007) or Waltman (2000). The question of wages is closely related to the
development of unemployment, see for example Löster and Langhamrová (2011) or Miskolczi
(2011) or to the development of inflation, see Franta et al. (2010), or to another macroeconomic
aggregates.
The theoretical nature of the methods used is not described here due to the focus of this journal.
Used descriptive characteristics of the wage distribution are explained for example in Triola (2003).
One-way analysis of variance test used is explained for example in Turner and Thayer (2001).
2. DATABASE
Processed data come from the Official website of the Czech Statistical Office and of the
Statistical Office of the Slovak Republic. There are the data in the form of the interval frequency
distribution with open extreme intervals. The researched variable is the gross monthly wage in EUR.
Conversion of CZK to EUR and SKK to EUR (2005–2008) was made using the exchange rate to
half of that calendar year, see Table 1.
Table-1. Exchange rates for half of the calendar year
Exchange rate
At the date of July 1, 2005
June 30, 2006
June 29, 2006
July 1, 2008
July 1, 2009
July 1, 2010
July 1, 2011
June 29, 2012
CZK/1 EUR 30.000 28.495 28.715 23.825 25.775 25.760 24.315 25.640
SKK/100CZK 78.153 74.302 85.360 78.902 – – – –
www.cnb.cz
Because the focus of research is the nominal wage, Table 2 presents the development of average
annual rate of inflation in both countries during the period. Since the level of minimum wage
markedly affects the wage distribution, Table 2 also provides an idea of the development of
minimum wage in both states in the researched period. In 2013 the minimum wage is 312.0 EUR in
the Czech Republic and 337.7 EUR in the Slovak Republic. As the wage development is strongly
Table 2 provides an overview of the development of these indicators for the comparison. Figures 1
and 2 show the growth rate of GDP in the period.
Data were processed using the spreadsheet Microsoft Excel and statistical program packages
SAS and Statgraphics.
Table-2. Minimum wage (in EUR), unemployment rate (in %), average annual inflation rate (in %), gross domestic product at current prices calculated by income approach (in mil. EUR)
Year
Czech Republic Slovak Republic
Minimum wage
Unem- ployment rate
Inflation rate
Gross domestic product
Minimum wage
Unem- ployment rate
Inflation rate
Gross domestic product
2005 239.5 7.9 1.9 103,868.5 169.31 16.2 2.7 49,315.2
2006 265.72
279.23
7.1 2.5 117,655.7 179.94 13.3 4.5 55,081.9
2007 278.6 5.3 2.8 127,549.1 225.95 11.0 2.8 61,501.1
2008 335.8 4.4 6.3 161,528.3 268.3 9.6 4.6 66,842.3
2009 310.4 6.7 1.0 145,838.2 295.5 12.1 1.6 62,794.4
2010 310.6 7.3 1.5 147,161.5 307.7 14.4 1.0 65,869.5
2011 329.0 6.7 1.9 157,244.5 317.0 13.5 3.9 69,108.3
2012 312.0 7.0 3.3 149,997.1 327.2 14.0 3.6 71,463.0
Source: http://www.czso.cz, http://portal.statistics.sk, own research
3. COMPARISON OF THE DEVELOPMENT OF WAGE LEVEL IN THE CZECH
AND SLOVAK REPUBLICS
Figure-1. The growth rate of gross domestic product (in %) in the Czech Republic in the period 2005–2012
Source: Own research
1 from 1 October 2004 to 1 October 2005
2 from 1 January 2006 to 30 June 2006
3 from 1 July 2006 to 31 December 2006
4 from 1 October 2005 to 1 October 2006
-8 -6 -4 -2 0 2 4 6 8 10 12 14
2005 2006 2007 2008 2009 2010 2011 2012
grow th ra te of gross dom e s ti c product ( in % ) year
Figure-2. The growth rate of gross domestic product (in %) in the Slovak Republic in the period 2005–2012
Source: Own research
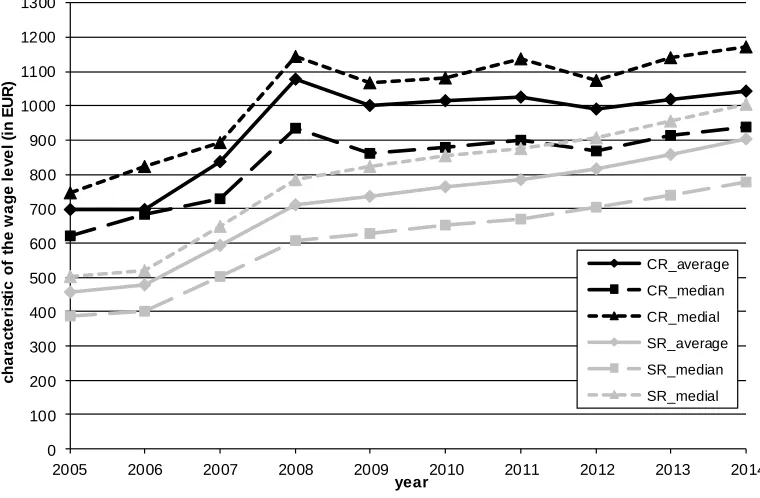
Figure 3 shows the development of location characteristics of total wage distribution (for men
and women together) in the Czech and Slovak Republics in the researched period 2003–2012
including forecasts for 2013 and 2014. Figures 4 and 5 show the same thing, but for men and women
separately. Tables 3 and 4 represents growth annual coefficients and average growth annual
coefficients of the arithmetic mean, median and medial of gross monthly wage in the period 2005–
2012 including the predictions for 2013 and 2014 in the Czech and Slovak Republics according to
the gender. 0 100 200 300 400 500 600 700 800 900 1000 1100 1200 1300
2005 2006 2007 2008 2009 2010 2011 2012 2013 2014
c h a ra c te ri st ic o f th e w a g e l e v e l (i n E U R ) year CR_average CR_median CR_medial SR_average SR_median SR_medial
Figure-3. Development of the location characteristics of wage distribution of the Czech and Slovak employees (total set) between 2005 and 2012 including the prediction for 2013 and 2014
0 100 200 300 400 500 600 700 800 900 1000 1100 1200 1300
2005 2006 2007 2008 2009 2010 2011 2012 2013 2014
c h a ra c te ri s ti c o f th e w a g e le v e l (i n E U R ) year CR_averag e CR_media n CR_medial
Figure-4. Development of the location characteristics of wage distribution of the Czech and Slovak employees (set of men) between 2005 and 2012 including the prediction for 2013 and 2014
Source: Own research
Figure-5. Development of the location characteristics of wage distribution of the Czech and Slovak employees (set of women) between 2005 and 2012 including the prediction for 2013 and 2014
Source: Own research
Table-3. Growth annual coefficients and average growth annual coefficients of the arithmetic mean, median and medial of gross monthly wage in the period 2005–2012 including the predictions for 2013 and 2014 in the Czech Republic according
to the gender
Year
Total Men Women
Average Median Medial Average Median Medial Average Median Medial
2005 – – – – – – – – –
2006 1.109 1.105 1.102 1.103 1.101 1.103 1.117 1.109 1.107
2007 1.083 1.063 1.084 1.095 1.070 1.081 1.063 1.049 1.068
Continue 0 100 200 300 400 500 600 700 800 900 1000 1100 1200 1300
2005 2006 2007 2008 2009 2010 2011 2012 2013 2014
2008 1.287 1.282 1.284 1.292 1.289 1.295 1.280 1.276 1.271
2009 0.929 0.925 0.932 0.923 0.914 0.928 0.944 0.943 0.953
2010 1.015 1.017 1.014 1.016 1.022 1.021 1.014 1.016 1.009
2011 1.012 1.023 1.050 0.995 1.006 1.030 1.045 1.045 1.078
2012 0.966 0.965 0.946 0.969 0.965 0.958 0.961 0.969 0.944
2013 1.026 1.053 1.062 1.038 1.048 1.056 1.062 1.068 1.083
2014 1.109 1.105 1.102 1.103 1.101 1.103 1.117 1.109 1.107
Ø 2005-08 1.156 1.146 1.153 1.160 1.149 1.156 1.150 1.141 1.145
Ø 2008-12 0.980 0.982 0.984 0.975 0.976 0.983 0.990 0.993 0.995
Ø 2005-12 1.052 1.049 1.053 1.050 1.047 1.054 1.056 1.054 1.057
Ø 2012-14 1.026 1.04 1.044 1.032 1.036 1.042 1.045 1.049 1.056
Ø 2005-14 1.046 1.047 1.051 1.046 1.044 1.051 1.053 1.053 1.057
Source: Own research
Table-4. Growth annual coefficients and average growth annual coefficients of the arithmetic mean, median and medial of gross monthly wage in the period 2005–2012 including the predictions for 2013 and 2014 in the Slovak Republic
according to the gender
Year
Total Men Women
Average Median Medial Average Median Medial Average Median Medial
2005 – – – – – – – – –
2006 1.041 1.041 1.040 1.029 1.023 1.024 1.054 1.053 1.059
2007 1.243 1.251 1.244 1.236 1.251 1.245 1.255 1.338 1.311
2008 1.197 1.209 1.210 1.185 1.201 1.192 1.215 1.140 1.166
2009 1.038 1.035 1.050 1.039 1.034 1.060 1.033 1.031 1.044
2010 1.035 1.035 1.039 1.028 1.026 1.037 1.040 1.046 1.043
2011 1.028 1.031 1.026 1.024 1.035 1.020 1.033 1.031 1.027
2012 1.042 1.048 1.035 1.045 1.053 1.032 1.043 1.046 1.042
2013 1.051 1.053 1.053 1.047 1.050 1.051 1.055 1.055 1.055
2014 1.041 1.041 1.040 1.029 1.023 1.024 1.054 1.053 1.059
Ø 2005-08 1.157 1.164 1.161 1.146 1.154 1.150 1.171 1.171 1.174
Ø 2008-12 1.036 1.037 1.037 1.034 1.037 1.037 1.037 1.038 1.039
Ø 2005-12 1.086 1.089 1.089 1.081 1.086 1.084 1.093 1.093 1.095
Ø 2012-14 1.051 1.051 1.052 1.046 1.049 1.050 1.053 1.054 1.054
Ø 2005-14 1.078 1.081 1.08 1.073 1.077 1.076 1.084 1.084 1.086
Source: Own research
Medial is such a characteristic of wage level that workers with wages less than or equal to
medial get half of the total amount of wages and workers with wages greater than or equal to medial
get the other half of the total amount of wages.
Comparison of the development of wage level between the Czech and Slovak Republics is
interesting. While in the first year of the financial crisis in 2009 we record appreciable drop in the
wage level in the Czech Republic, both in terms of total wage distribution for men and women
together, and in terms of separate wage distribution individually for men and women, wages in the
Slovak Republic in 2009 continue to grow, even though they are far below the growth rate before
the financial crisis, see Figures 3–5 and Tables 3–4. We can see a similar drop in the wage level in
the Czech Republic in 2012, unlike the Slovak Republic, where wage increases in this year. We can
while the Slovak wage also grows in the period of financial recession, in spite of they are far below
the growth rate before the financial crisis. However, it can be assumed that wage development is
very closely tied to the development of gross domestic product. We can see from Figures 1 and 2
that the Slovak Republic evinces more positive development of GDP during all period of the
financial crisis (with the exception of 2011) than the Czech Republic. Figures 3–5 also show a
strongly higher wage level in the Czech Republic compared to the wage level in the Slovak
Republic. The obtained results also show that although the development of wage level in the Czech
Republic during the world economic crisis shows an average annual decline and the development of
wage level in the Slovak Republic in this period shows an average annual growth, the level of
nominal wage in the Slovak Republic is still markedly below the nominal wage in the Czech
Republic now. However, Figure 6 shows that the difference between the wage level in the Czech
Republic and in the Slovak Republic is decreasing with time.
Figures 7 and 8 represent a different development of differences in wage levels between men
and women in the Czech Republic and in the Slovak Republic. We can observe from these figures
that while the difference in wage levels between men and women in the Czech Republic is on a
downward trend since the beginning of the financial crisis, the difference of wage levels between
men and women in the Slovak Republic has a growing tendency even in times of global financial
crisis, which is likely related to the increase in the level of wages in the Slovak Republic during the
crisis. Difference in wage levels between men and women is now approximately the same in the
Czech and Slovak Republics, see Figures 7–8.
Figure-6. Differences of the location characteristics of wage distribution between the Czech and Slovak employees (total set) between 2005 and 2012 including the prediction for 2013 and 2014
Source: Own research
0 50 100 150 200 250 300 350 400
2005 2006 2007 2008 2009 2010 2011 2012 2013 2014
di
ff
e
re
nce
(
in
E
U
R
)
year
difference of average
difference of median
0 50 100 150 200 250 300
2005 2006 2007 2008 2009 2010 2011 2012 2013 2014
year d if fe re n c e i n t h e w a g e l e v e l b e tw e e n m e n a n d w o m e n ( in E U R ) average median medial
Figure-7. Differences in the wage level (in EUR) between the Czech men and women employees in the period 2005–2012 including the prediction for 2013 and 2014
Source: Own research
Figure-8. Differences in the wage level (in EUR) between the Slovak men and women employees in the period 2005–2012 including the prediction for 2013 and 2014
Source: Own research
0 50 100 150 200 250 300
2005 2006 2007 2008 2009 2010 2011 2012 2013 2014
4. DEVELOPMENT
OF
WAGE
DIFFERENTIATION,
SKEWNESS
AND
CONCENTRATION
Known characteristics of differentiation and skewness were used to descriptive the development
of wage distributions of men and women in the Czech and Slovak Republics in the years 2005–
2012, see Tables 5–6.
We observe an increasing absolute variability (standard deviation) of wages of Czech men and
women in the period before the economic crisis, while the absolute variability of wages of Czech
men and women rather fluctuates during the economic recession. Absolute variability of Slovak men
and women grows all over the researched period.
Because the absolute variability of wages increases with the level of wages, the use of relative
characteristic (coefficient of variation) of wages is useful in this regard. While relative variability of
wages of men and women in the Czech Republic has rather a growing trend in all monitored period,
the relative variability of wages of men and women in the Slovak Republic has rather a downward
tendency in this period. This is evident from the results that the global economic crisis does not
considerably affect the wage distributions in terms of their relative variability in the Czech and
Slovak Republic. Tables 5–6 provide an overview of the development of moment measure of
skewness of wage distributions, too.
Table-5. Development of sample characteristics of variation and skewness of the gross monthly wage (standard deviation (in EUR), coefficient of variation (in %) and momentmeasure of skewness (without unit)) of the Czech employees in the period
between 2005–2012 according to the gender
Year
Men Women
Standard deviation
Coefficient of variation
Moment skewness
Standard deviation
Coefficient of variation
Moment skewness
2005 390 50.65 2.052 306 51.17 0.877
2006 424 49.94 1.947 337 50.45 0.855
2007 564 60.65 2.868 408 57.46 1.914
2008 717 59.65 2.717 523 57.54 1.728
2009 675 60.81 2.673 490 57.11 1.721
2010 680 60.28 2.610 493 56.67 1.706
2011 717 63.90 2.426 519 57.10 1.777
2012 683 62.83 2.480 498 56.98 1.838
Source: Own research
Table-6. Development of sample characteristics of variation and skewness of the gross monthly wage (standard deviation (in EUR), coefficient of variation (in %) and moment measure of skewness (without unit)) of the Slovak employees in the period
between 2005–2012 according to the gender Year
Men Women
Standard deviation
Coefficient of variation
Moment skewness
Standard deviation
Coefficient of variation
Moment skewness
2005 347 66.35 2.630 227 58.21 2.626
2006 364 67.66 2.578 248 60.34 2.659
2007 431 64.81 2.408 306 59.30 2.465
2008 495 62.82 2.259 364 58.05 2.168
2009 517 63.13 2.182 373 57.56 2.047
2010 527 62.59 2.077 385 57.12 1.921
2011 527 61.14 2.042 393 56.47 1.885
2012 531 58.93 2.029 395 54.41 1.821
Source: Own research
Gini coefficient was used to characterize the development of concentration of wage distribution
of men and women in the Czech and Slovak Republics in the period. Gini coefficient is related to the
famous Lorenz curve, see Figure 9, Lorenz curve is a bold here (including two extreme possibilities
of shape for the case of zero concentration and for the case of maximum possible concentration).
Lorenz curve is plotted in a rectangular chart with two scales from 0 percent to 100 percent. The
cumulative relative frequencies (percentage) of the units representing the wearers of studied variable
are the abscissa. Employees are carriers of gross monthly wage in this case. Cumulative totals of
concentrated variable (percentage) are located on the axis of ordinates. Gross monthly wage is
concentrated variable in this case. Cumulative relative frequencies of units (in %), which represent
the wearers of studied variable, and their corresponding cumulative totals of concentrated variable
(in %), thus represent the coordinates of points on the Lorenz curve. Lorenz curve merges with a
diagonal of the graph in the case of zero concentration, when the same proportion of the total sum
of values of the researched variable falls on each unit. In this case, this situation would be if every
employee had the same gross monthly wage. Lorenz curve bends more the concentration of
researched variable is greater, when the concentration of considerably large part of the total sum of
values of the variable grows into a small number of units. The highest concentration occurs when the
total sum of values of variable is only concentrated into a single unit.
Figure-9. Lorenz curve
Gini concentration coefficient is the ratio of the area content that define the diagonal of the graph and the Lorenz curve, which is indicated (λ) in Figure 9, and the content of the total area of the triangle below the diagonal of the graph, which is indicated by an area of + (λ + ω) in Figure 9
.
G
The value of Gini coefficient is thus ranges from zero at extreme leveling (zero concentration),
where all employees have the same wage, to one with extreme differentiation (maximum possible
concentration), where all wage belongs to one employee.
We can observe again the different behavior of the wage distributions in terms of their
concentration both, among the Czech and Slovak Republics, and between men and women in both
these countries, see Figure 10. While the concentration of total wage distribution in the Czech
Republic for men and women together gradually increases with the exception of the last year 2012,
the concentration of total wage distribution in the Slovak Republic for men and women together is
still approximately at the same level throughout the followed period (with a slightly decreasing
trend). Although the concentration of this total wage distribution in the Czech Republic is sharply
lower than in the Slovak Republic at the beginning of researched period, it is approximately at the
same level at the end of this period. The concentration of wage distributions of men develops
approximately the same way as the concentration of corresponding total wage distribution in the
state (in both countries), see Figure 10. In both countries the concentration of wage distributions of
women develops in very different ways than that of wage distribution of men and it is approximately
at the same level throughout the period, with slight fluctuations.
Figure-10. Development of Gini coefficient of concentration (in %) of the Czech and Slovak employees in the period between 2005–2012 according to the gender
Source: Own research
45 47 49 51 53 55 57 59
2005 2006 2007 2008 2009 2010 2011 2012
Gi
ni
c
oef
fi
c
ie
nt
(
in
%
)
year
Czech employees
Slovak emplyees
5. DEPENDENCE OF WAGE ON WHETHER THE EMPLOYEE WORKS IN THE
CZECH OR SLOVAK REPUBLIC
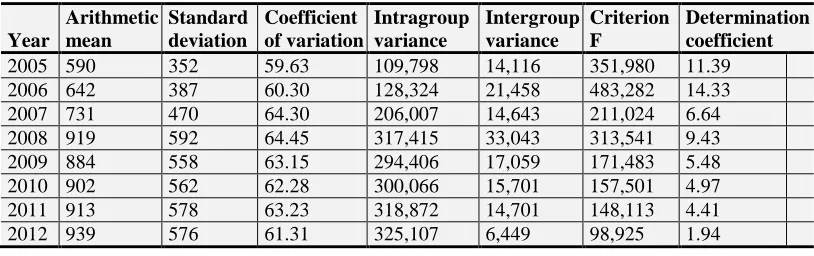
Table 7 indicates the dependence of gross monthly wage of employee on what, whether he is
employed in the Czech or Slovak Republic. One-way analysis of variance test known as the
ANOVA was used to verify this dependence, see Turner and Thayer (2001). Gross monthly wage in
EUR is an explained (dependent) variable. State with variations Czech Republic and Slovak republic
is the explanatory (independent) variable.
Table-7. Sample characteristics of the total set for Czech and Slovak Republics together – the total average wage (in EUR), the total standard deviation (in EUR), the total coefficient of variation (in %), intergroup variance (in EUR2), intragroup
variance (in EUR2), the value of test criterion F, the value of the coefficient of determination
Year
Arithmetic mean
Standard deviation
Coefficient of variation
Intragroup variance
Intergroup variance
Criterion F
Determination coefficient
2005 590 352 59.63 109,798 14,116 351,980 11.39
2006 642 387 60.30 128,324 21,458 483,282 14.33
2007 731 470 64.30 206,007 14,643 211,024 6.64
2008 919 592 64.45 317,415 33,043 313,541 9.43
2009 884 558 63.15 294,406 17,059 171,483 5.48
2010 902 562 62.28 300,066 15,701 157,501 4.97
2011 913 578 63.23 318,872 14,701 148,113 4.41
2012 939 576 61.31 325,107 6,449 98,925 1.94
Source: Own research
Table 7 presents the decomposition of the total variance of gross monthly wage into intragroup
and intergroup folders and the output of the test, too. Therefore, it is the dependency of one numeric
variable on one categorical variable, which is called a factor. Intragroup variability is the variability
of individual gross monthly wages around the corresponding group average wage (the average wage
in the Czech Republic and the average wage in the Slovak Republic). Intergroup variability is the
variability of the group average wages around the overall average wage for Czechs and Slovaks
together. It is assumed that the intergroup variability is explained by the given factor, while the
intragroup variability is not explained by it.
In other words, the variability between groups is the originator of this dependency, and thus as
the intergroup variability will be larger (the intragroup variability must be smaller), we will prove
the dependency more even on the given significance level6.
It is obvious at the first glance to Table 7 that the decomposition of the total variance of gross
monthly wage into individual components does not lead to too tight dependency of gross monthly
wage on that, whether the employee is employed in the Czech republic or in the Slovak republic. It
is evident that intragroup variability greatly exceeds the intergroup variability. The critical value is
3.84147 for 5% significance level and 6.63492 for 1% significance level in all cases due to the large
sample sizes of wage distributions. The P-value is 0.00000 in all cases. It is clear from Table 7 that
6 The significance level is the upper limit for the error probability of the first type, i.e. the probability that we reject our null hypothesis of
the F value of the test criterion unequivocally outperforms the critical value in all cases, even at the
1% level of significance, which leads to proving of this dependence.
The disproportion between the greatness of intragroup and intergroup variability in Table 7 on
one side and (which indicates rather in favor of independence) and the relation between the test
criterion values and the critical value (which shows dependence) on the other hand, is due to the
large sample sizes, which are used working with wage distributions. In the case of such large sample
sizes very high power test already exists and test reveals all the slightest deviations from the “independence”, which leads to the rejection of the tested null hypothesis of independence and to the proving of dependence at the given significance level. The dependence of gross monthly wage on
that, whether the employee is employed in the Czech Republic or in the Slovak Republic is therefore
statistically significant even at the 1% significance level.
Determination ratio then gives the tightness (power, intensity) of this dependence, it is the ratio
between intergroup folder of variability and total variability. Determination ratio therefore indicates
after the multiplication by a hundred, how many percent the intergroup variability (originator of the
dependence) contributes to the total variability. This follows from the data in Table 7 that the
dependence of gross monthly wage on that, whether the employee is employed in the Czech
Republic or in the Slovak Republic is very weak throughout the period studied (variability within
each level of factor clearly dominates). Moreover, we can say that the intensity of this dependence
decreases over time, with the exception of 2003.
6. CONCLUSION
The wage distribution of men and women in the Czech and Slovak Republics changes over
time. Their absolute amount grows with relatively fast pace in the period before the global economic
crisis (2003–2008). Wage growth in the Czech Republic has virtually stopped in the period
immediately after the onset of economic recession. Later this sharp impact of the economic
recession on wage growth eases in the Czech Republic in both genders and absolute wage levels
begin to rise again (with the exception of 2012), but it is far below the rate of growth before the
crisis. In contrast, in the Slovak republic, wage growth continues despite the period of economic
recession in both genders, although wage growth has noticeably slowed down during the financial
crisis. Although the level of nominal wages in the Czech Republic is still strongly higher than in the
Slovak Republic, Slovak wages are closer to the level of Czech wages due to the different response
of gross monthly wage in connection with the onset of economic recession in the Czech and Slovak
Republics since the start of the financial crisis.
One-way analysis of variance tests clearly show the dependence of gross monthly wage on
that, in which country the employee is employed, even at the 1% level of significance, however,
observed intensity of this dependence is generally very weak.
In an international comparison of the level of wages with regard to the purchasing power
parity the Czech Republic has a similar wage level as Croatia, Turkey, Quatar and China
8. ACKNOWLEDGEMENTS
This paper was subsidized by the funds of institutional support of a long-term conceptual
advancement of science and research number IP400040 at the Faculty of Informatics and Statistics,
University of Economics, Prague, Czech Republic.
REFERENCES
Behr, A., 2007. A European analysis of changes in gender specific wage inequality using decomposition
methods. Journal of Income Distribution, 16(1): 50-73.
Bílková, D., 1995. Vývoj příjmových rozdělení v letech 1956 * 1992 a jejich předpovědi pro roky 1995 a 1997
(Development of Income Distribution in the years 1956* 1992 and their Forecasts for 1995 and
1997). Politická Ekonomie, 43(4): 510-531.
Bílková, D., 2012. Recent development of the wage and income distribution in the Czech republic. Prague
Economic Papers, 21(2): 233-250.
Cunningham, W., 2007. Minimum wages and social policy: Lessons from developing countries (Directions in
Development). Washington: The World Bank. pp: 132.
Dagum, C., 1997. A systemic approach to the generation of income distribution models. Journal of Income
Distribution, 6(1): 105-126.
Dagum, C., 1999. Advances in econometrics, income distribution and scientific methodology. New York:
Physica-Verlag. pp: 388.
Franta, M., B. Saxa and K. Šmídková, 2010. The role of inflation persistence in the inflation process in the new
EU member states. Finance a Uvěr, 60(6): 480-500.
Kaasa, A., 2006. Factors of income inequality and their influence mechanisms: A review of the empirical
literature. Journal of Income Distribution, 15(1): 9-41.
Löster, T. and J. Langhamrová, 2011. Analysis of long-term unemployment in the Czech republic. Paper Presented at the International Days of Statistics and Economics at VŠE 2011 Held on 22–23
September 2011, Praha. pp: 228-234.
Mallick, S.K., 2008. Income distribution and consumption deprivation: An analytical link. Journal of Income
Distribution, 17(2): 25-36.
Marek, L., 2010. The trend of wage distributions in Czech republic in the years 1995-2008 analysis. Politická
Ekonomie, 58(2): 186-206.
Milanovic, B., 2002. True world income distribution, 1988 and 1993: First calculation based on household
surveys alone. The Economic Journal, 112: 51-92.
Miskolczi, M., 2011. Recognition of differentiation in unemployment trends among regions in the Czech
republic. Paper Presented at the 19th Interdisciplinarity Information Management Talks IDIMT 2011
Held on 7–9 September 2011, Jindřichův Hradec. pp: 387-388.
Monti, M. and A. Santoro, 2009. A note on between-group inequality with an application to households.
Journal of Income Distribution, 18(3-4): 49-62.
Pacáková, V. and L. Sipková, 2007. Generalized lambda distributions of household\s incomes. E+M Ekonomie
a Management, 10(1): 98-107.
Rothschild, K.W., 2005. Employment, wages and income distribution: Critical essays in economics. New York:
Triola, M.F., 2003. Elementary statistics. 9th Edn., Boston: Addison Wesley. pp: 864.
Turner, J.R. and J.F. Thayer, 2001. Introduction to analysis of variance: Design, aanalysis & interpretation.
Thousand Oaks: Sage Publications. pp: 180.
Waltman, J.L., 2000. The politics of the minimum wage. Urbana: University of Illinois Press. pp: 172.
Wessels, W.J., 2008. A consumption model of income inequality. Journal of Income Distribution, 17(2): 5-24.