© 2015 IJEDR | Volume 3, Issue 4 | ISSN: 2321-9939
IJEDR1504146
International Journal of Engineering Development and Research (www.ijedr.org)820
A Parametric Study of Simple Footing and Piled Raft
1
Jaydeep Bhanderi,
2Jitendra Mehta,
3Kinjal Rank
1Assistant Professor, 2Assistant Professor & Head, 3Assistant Professor 1Civil Engineering Department,
1VVP Engineering College, Rajkot, India
________________________________________________________________________________________________________ Abstract – A comparison is made between the effect of strip footing with and without pile. An experimental setup including mild steel strip footing with different number of piles at different spacing, loading frame with screw jack, mild steel tank is used. It is observed that settlement of footing reduces significantly by increasing the number of supporting piles and by decreasing spacing between two piles. As number of pile increases the bearing capacity ratio increases.
Index Terms – Pile. Footing, Piled Raft.
________________________________________________________________________________________________________
I.INTRODUCTION
Investigation of a rigid footing under a loadbearing wall may demonstrate that its conduct is unacceptable in excessive total or differential settlement. In spite of the fact that the total settlement may be decreased by expanding the footing, and the differential settlement may be diminished by stiffening the footing. The traditional way to deal with piled footing analysis, which includes the suspicion that all the load is taken by the piles, will unmistakably not prompt most extreme economy, and a more correct system for investigation appears to be attractive.
The idea of analysis for pile supported footing is taken from the analysis of piled raft foundations where the piles shows non-linear load-deflection behavior. The raft is analysed through the use of finite element methods, while piles are treated as springs having a variable stiffness, so as to model any non-linear behavior. The soil is treated as an elastic medium that may consist of soils of different stiffnesses. Interaction between the piles in the group is assumed to remain constant even though the stiffness of the piles may change with load level.
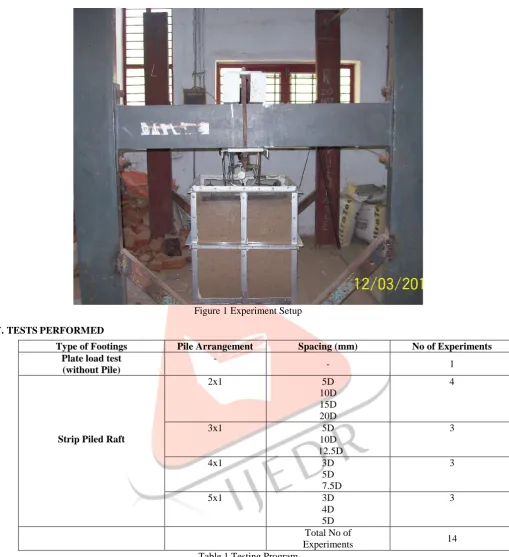
II.EXPERIMENTAL SETUP
Experimental set up is developed consisting of a mild steel tank with sides of transparent perpex sheet with dimension 120 x 120 x 150cm was prepared. A loading frame with load application using a screw jack.. Manual loading system with capacity of 10 tons was used for the experiment. The mild steel strip footing of size 60 x 10 cm and thickness of 25mm was prepared for the experiment. Diameter of Pile selected is 25 mm and length is 450 mm.
Tests are performed for different number of piles as well as varying spacing of piles. Different arrangements of Piles to be used are 2x1, 3x1, 4x1 and 5x1 and various spacing adopted are 3D, 5D, 7.5D, 10D, 12.5D, 15D and 20D, where D is diameter of Pile. In total, 14 tests are performed as shown in table - I. Laboratory tests are performed to obtain the index and strength properties of loose/dense sand used in the experiment. It was found that minimum and maximum density of sand was 15.80 kN/m3 and 18.50 kN/ m3. Experiments were performed for density of 16.90 kN/m3 considering relative density of 45%.
III. TEST PROCEDURE
1. The transparent fiber test tank (120cm x 120cm x 150cm) was used as test pit. Up to 1.20m depth the tank was filled with sand. That depth was divided into no. of layers. To achieve 45% relative density (γd = 1.69 gm/cc) the weight for each layer was counted with the help of weighing machine.
2. The weighted sand bags for every layer were kept isolated precisely and after that the sand was deliberately filled in tank such that the correct density ought to be accomplished.
3. The test plate of respective test seated over the leveled top of sand and then the proving ring and mechanical jack arrangement is provided as shown in Fig.1.
4. Two dial gauges are connected firmly with the angle bars. The angle bars are not disturbed throughout the test procedure. 5. A preliminary seating load of 70 gm/cm2 (39.2 kg = 7 div.) is applied first which is seated before the actual loading. 6. Load increments are kept different as per the situation and time constraint.
7. A first load increment is applied after the application of seating load and settlements are recorded by mean of dial gauge. Observation of this load increment shall be kept at 1, 2, 5, 10, 15, 20 min. intervals. (As per IS 1888:1982, The load settlement shall be kept for not less than one hour or up to a time when the rate of settlement gets reduced up to 0.02 mm/min.)
8. The higher load increments are then applied and corresponding settlements are recorded. The test should continue for total settlement of 10 to 20 mm or which soil fails whichever occurs earlier.
IJEDR1504146
International Journal of Engineering Development and Research (www.ijedr.org)821
Figure 1 Experiment SetupIV.TESTS PERFORMED
Type of Footings Pile Arrangement Spacing (mm) No of Experiments
Plate load test (without Pile)
-
- 1
Strip Piled Raft
2x1 5D
10D 15D 20D
4
3x1 5D
10D 12.5D
3
4x1 3D
5D 7.5D
3
5x1 3D
4D 5D
3
Total No of
Experiments 14
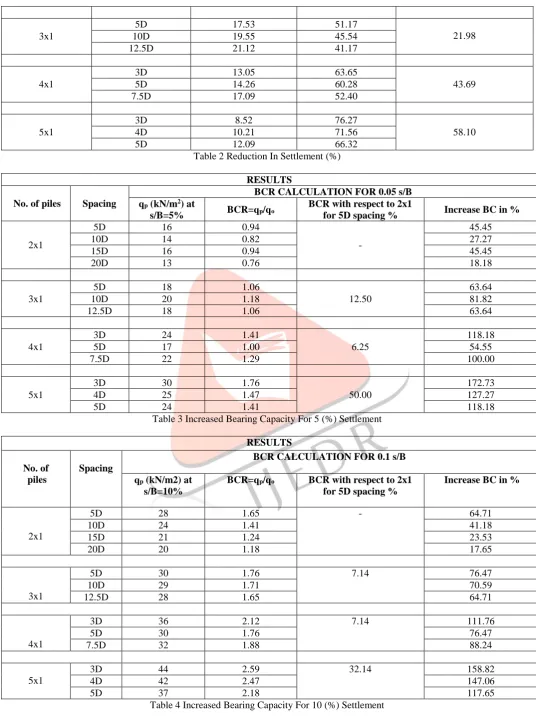
Table 1 Testing Program V.RESULTS AND DISCUSSION
The results were then analysed to study the effect of each pile spacing and number of piles. This improvement in bearing capacity increases when pile spacing decreases. The comparisons of Reduction in Settlement and Bearing Capacity for experimental work was carried out at 5% settlement and 10 % settlement.
Results
No. of Piles Spacing Settlement
Total Settlement (mm)
Reduction in Settlement (%)
Reduction in Settlement (%) Comparison with 2x1 for 5D
spacing
2x1
5D 20.84 41.95
-
10D 24.08 32.92
15D 26.85 25.21
© 2015 IJEDR | Volume 3, Issue 4 | ISSN: 2321-9939
IJEDR1504146
International Journal of Engineering Development and Research (www.ijedr.org)822
3x15D 17.53 51.17
21.98
10D 19.55 45.54
12.5D 21.12 41.17
4x1
3D 13.05 63.65
43.69
5D 14.26 60.28
7.5D 17.09 52.40
5x1
3D 8.52 76.27
58.10
4D 10.21 71.56
5D 12.09 66.32
Table 2 Reduction In Settlement (%) RESULTS
No. of piles Spacing
BCR CALCULATION FOR 0.05 s/B qp (kN/m2) at
s/B=5% BCR=qp/qo
BCR with respect to 2x1
for 5D spacing % Increase BC in %
2x1
5D 16 0.94
-
45.45
10D 14 0.82 27.27
15D 16 0.94 45.45
20D 13 0.76 18.18
3x1
5D 18 1.06
12.50
63.64
10D 20 1.18 81.82
12.5D 18 1.06 63.64
4x1
3D 24 1.41
6.25
118.18
5D 17 1.00 54.55
7.5D 22 1.29 100.00
5x1
3D 30 1.76
50.00
172.73
4D 25 1.47 127.27
5D 24 1.41 118.18
Table 3 Increased Bearing Capacity For 5 (%) Settlement RESULTS
No. of
piles
Spacing
BCR CALCULATION FOR 0.1 s/B
qp (kN/m2) at
s/B=10%
BCR=qp/qo BCR with respect to 2x1
for 5D spacing %
Increase BC in %
2x1
5D 28 1.65 - 64.71
10D 24 1.41 41.18
15D 21 1.24 23.53
20D 20 1.18 17.65
3x1
5D 30 1.76 7.14 76.47
10D 29 1.71 70.59
12.5D 28 1.65 64.71
4x1
3D 36 2.12 7.14 111.76
5D 30 1.76 76.47
7.5D 32 1.88 88.24
5x1
3D 44 2.59 32.14 158.82
4D 42 2.47 147.06
5D 37 2.18 117.65
IJEDR1504146
International Journal of Engineering Development and Research (www.ijedr.org)823
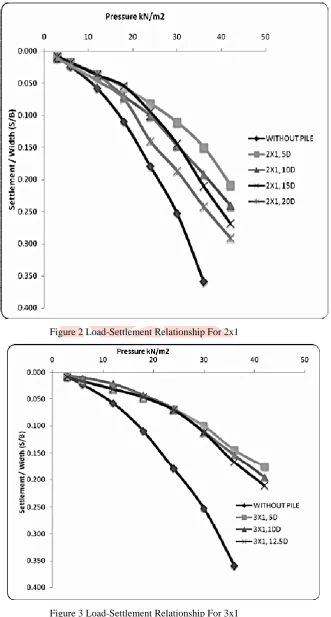
Figure 2 Load-Settlement Relationship For 2x1© 2015 IJEDR | Volume 3, Issue 4 | ISSN: 2321-9939
IJEDR1504146
International Journal of Engineering Development and Research (www.ijedr.org)824
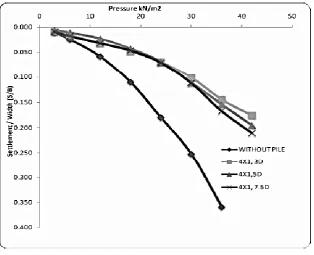
Figure 4 Load-Settlement Relationship For 4x1Figure 5 Load-Settlement Relationship For 5x1
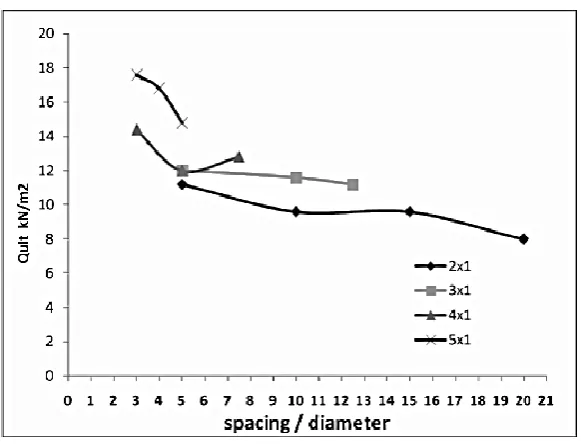
Qult (kN/m2) from spacing/diameter ratio No. of
Piles
spacing/diameter (s/d) ratio qult for s/B=0.05 (kN/m2) Q ult
(kN/m2)
2
5 16 6.4
10.00 14 5.6
15.00 16 6.4
20.00 13 5.2
3
5.00 18 7.2
10.00 20 8
12.50 18 7.2
4
3.00 24 9.6
IJEDR1504146
International Journal of Engineering Development and Research (www.ijedr.org)825
7.50 22 8.8
5
3.00 30 12
4.00 25 10
5.00 24 9.6
Table 5 Ultimate Bearing Pressure From S/D Ratio At 5 (%) Settlement
Figure 5 s/D ratio Vs Qult (kN/m2) for S/B=5% Qult (kN/m2) from spacing/diameter ratio
No. of piles settlement/diameter (s/d) ratio
qult for s/B=0.1 (kN/m2) Qult (kN/m2)
2 5 28 11.2
10.00 24 9.6
15.00 24 9.6
20.00 20 8
3 5.00 30 12
10.00 29 11.6
12.50 28 11.2
4 3.00 36 14.4
5.00 30 12
7.50 32 12.8
5 3.00 44 17.6
4.00 42 16.8
5.00 37 14.8
© 2015 IJEDR | Volume 3, Issue 4 | ISSN: 2321-9939
IJEDR1504146
International Journal of Engineering Development and Research (www.ijedr.org)826
Figure 7 s/D ratio Vs Qult (kN/m2) for S/B=10% VI.CONCLUSION
Table 2 to 7 shows the results of the experiments and Fig. 2 to 7 shows the graphical presentation of that results. From that results, Installation of piles beneath a uniformly loaded strip footing is seen to be enable
1) The Settlement of footing reduces significantly by increasing the number of supporting piles. Settlement also reduces by decreasing spacing between two piles.
2) A considerable Increase in Ultimate Bearing Capacity by increasing the number of supporting piles and by decreasing the spacing between two piles.
REFERENCES
[1] Brown P.T. and Wiesner T. J., Japanese Society of Soil Mechanics and Foundation Engineering, “The Behaviour of Uniformly Loaded Piled Strip Footing”, Vol.15, No.4, Dec-1975.
[2] Murthy V. N.S, “Soil Mechanics and Foundation Engineering.”
[3] Randolph M.F. (1994) "Design Methods for Pile Groups and Piled Rafts". S.O.A. Report, 13 ICSMFE, New Delhi, 5: 61-82. [4] Y.M. El-Mossallamy. B. Lutz and R. Duerrwang, “Special aspect related to the behaviour of piled raft foundation ”, 17th
International Conference on Soil Mechanics & Geotechnical Engineering, ICSMGE, Alexandria.
[5] Yasser EI-Mossallamy, “Innovative application of piled raft foundation to optimize the design of high-rise buildings and bridge foundations”, 10 the International Conference on Piling and Deep Foundations, Amsterdam 2006.