ISSN (Online) : 2319 - 8753 ISSN (Print) : 2347 - 6710
I
nternationalJ
ournal ofI
nnovativeR
esearch inS
cience,E
ngineering andT
echnologyVolume 3, Special Issue 3, March 2014
2014 International Conference on Innovations in Engineering and Technology (ICIET’14) On 21st&22ndMarch Organized by
K.L.N. College of Engineering, Madurai, Tamil Nadu, India
Copyright to IJIRSET www.ijirset.com 113
Harmonic Distortion Evaluation And
Reduction In Radial Distribution System
Prof S.Parthasarathy
#1, E.Jeyasri
*2#1Department of Electrical and Electronics Engineering, K.L.N College of Engineering, Madurai, Tamil Nadu, India
*2
Corresponding author, K.L.N College of Engineering, Madurai, Tamil Nadu, India
ABSTRACT— In electric power systems due to the integration of power electronic devices, the power quality issues has been raised and has led to waveform distortion. As a consequence of Harmonics the strange condition at various electrical equipment that are connected to the power systems has been created. As a result of this, current Total Harmonic Distortion (THDI) values violates its limit as mentioned in standard specified by IEEE 519-1992.This paper deals with the conventional design of passive harmonic filter for Radial Distribution Systems (RDS).The test system is simulated in DIgSILENT 14.1.6 Powerfactory.The performance of the proposed filter is analyzed on IEEE 9 bus and IEEE 34 bus RDS. The investigations validate the effectiveness of the proposed passive harmonic filter.
KEYWORDS— Power Quality, Total Harmonic Distortion, Passive Harmonic Filter.
I. INTRODUCTION
A great number of nonlinear loads like adjustable speed drives and static power switches including those of higher capacity ground the power quality strife. The term power quality refers to a wide variety of electromagnetic phenomenon that characterizes voltage or current at a given time and at a given location on the power systems. The electric power engineers see power quality as anything that affect the voltage, current and frequency of power being supplied to the end user. The Power Quality is the combination of voltage quality and current quality [1].One of the major power quality issue that affects the end user is harmonics. The total and individual voltage harmonic distortions are limited to 5% and 3% respectively as per the guideline given by IEEE 519-1992 standard [2].
These harmonics can be mitigated by adopting various
mitigation techniques including passive and active Filtering techniques [3-4].Among these, passive filters are adopted often since it is easy to install and less cost. Various types of passive filters have been proposed to mitigate the harmonics along RDS[5].The passive filter parameters have been optimized using the Particle Swarm Optimization technique, by considering the power loss created by the filter [6].One of the problem occurring due to the incorporation of passive filters along a RDS is resonance. Hence the passive filter have been designed by considering the two resonant points at the point of common coupling with the help of DIgSILENT Power Factory[7].The adaptive Cultural Algorithm with hybrid mutation have been implemented in order to optimize the parameters of Asymmetry Passive Filters[8].An Optimized Passive filter for steel manufacturing plant have been planned by using the neural-genetic algorithm with fuzzy logic[9]The optimal location and sizing of the passive filter is designed with the objective of minimizing the harmonic voltage at all the busses using genetic algorithm tool box in MATLAB environment[10].
Copyright to IJIRSET www.ijirset.com 114 II. PASSIVE HARMONIC FILTER
A. Theoretical Background
Passive filters are in combination of inductance, capacitance and resistance elements configured and tuned to reduce the impact of harmonics in the power systems. They are employed either to shunt the harmonic currents off the line or to block their flow between parts of the system. The two basic types of passive filters are single tuned and double tuned filters. Single tuned filters are series tuned to present low impedance to particular harmonic currents and is connected in shunt with the system as shown in Fig.1.The double tuned filter performs the same function as two single tuned filters and the losses are much lower in this configuration.
R C1
L1
L
L2 R C2
C
(a)Single tuned filter (b) Double tuned filter
Fig. 1 Passive Harmonic Filters
B. Design of Passive Harmonic Filter
Single tuned filters are designed by taking the values of voltage, power factor and apparent power of the bus without the filter. Conventional method for design of passive harmonic filter is depicted here.
Reactive power of the filter is
KVAR = KVAR1 – KVAR2 (1)
KVAR1 = KVA sin(cos-1(pf1)) (2)
KVAR2 = KVA sin(cos-1(pf2)) (3)
pf1 = Power factor of load without filter placement
pf2 = 0.98 (Desired Powerfactor)
Filter reactance Xfilter = (KV2 * 1000)/KVAR(4)
Capacitive reactance Xcap = (Xfilter * h 2
)/(h2 – 1)(5)
Inductive reactance XLh = Xcap / h2 (6)
Filter Inductance Lh = XLh/(2πf) (7)
Filter Capacitance Ch = 1/(hf*2π*(Lh)1/2)2(8)
Filter Resistance Rh = (h*XLh)/Q (9)
Where,
h – Order of harmonics
KVA – Load apparent power
KVAR – Load reactive power
KV – Load voltage
Q – Quality Factor
III. RESULT AND DISCUSSIONS
A. Case study I
The first system under study is IEEE 9 bus RDS [11].The system is polluted by using a six pulse converter acting as a nonlinear load. The single line diagram of IEEE 9 bus RDS is shown in Fig 2.Harmonic flow analysis is performed without nonlinear load. From the result obtained it is observed that the system is superior since THDI value at all the buses is zero.
Fig. 2Single line diagram of 9 bus RDS
The harmonic spectrum of six pulse converter is located at bus number 4 in 9 bus RDS is given in Table 1. The data for harmonic spectrum is taken from the real time harmonic study.
TABLE I
HARMONIC CURRENT SPECTRUM OF SIX PULSE CONVERTER
Harmonic Order
I_h/I_1(%) Phi_h/phi_1(deg)
f/fn = 5 12.16 0
f/fn = 7 19.63 0
f/fn = 11 5.567 0
f/fn= 13 8.833 0
The load flow and harmonic flow studies are carried out in the DIgSILENT Power Factory and the results are tabulated in Table 2. It is observed that the THDI value is raised at all the buses and particularly at bus 4 it reached its maximum value. Hence a filter is required to mitigate the harmonics in RDS. In order to identify the dominating order of harmonics, current spectrum of 9 bus RDS is generated and is shown in Fig 3.
TABLE II
LOAD FLOW AND HARMONIC FLOW RESULT OF IEEE 9 BUS RDSBEFORE FILTER PLACEMENT
Bus No
Voltage (KV)
Ili
(kA)
THDI
(%)
Pli
(MW) Qli
(MV AR)
1 23.00 0.00 0.47 - -
2 22.50 0.57 5.52 12.27 18.19
4 20.40 0.52 23.00 8.82 16.47
5 19.63 0.19 21.30 6.68 1.48
6 19.38 0.14 20.61 4.85 0.69
7 18.92 0.12 19.85 4.01 0.53
8 18.16 0.09 18.59 2.77 0.42
9 17.63 0.05 17.64 1.69 0.23
From the current spectrum it is identified that 5th, 7thand 13thorder harmonics are most dominating orders and hence passive harmonic filter is designed for order 5, 7 and 13 as per the design procedure mentioned in Eq. 1 to Eq. 9. From the result shown in Table 2, it is observed that the 4th bus is highly polluted due to the incorporation of nonlinear device at that bus. Hence the filter is located at bus number 4.The parameters of the filter is tabulated in Table 3.Quality factor is the measureof sharpness of the tuning frequency. The quality factor considered for the proposed work is taken to be 10.
Fig. 3 Harmonic current spectrum of IEEE 9 bus RDS before filter placement
TABLE III
FILTER PARAMETER FOR IEEE 9 BUS RDSPLACEMENT
Harmonic Order
Filter parameters
R (Ω)
L (mH)
C (µf)
Quality factor
Reactive Power (KVAR)
5 6.39 40.70 9.966 10 1356.69
7 3.1952 20.351 10.17 10 1356.69
13 2.3737 5.8151 10.32 10 1356.69
The reactive power mentioned in Table 3 denotes the compensation provided by the passive filter for 9 bus RDS. After the implementation of filter again load flow and harmonic flow are performed. The comparative result of Total Harmonic Distortion with and without filter is tabulated in Table 4. From the table it is observed that THDI value is reduced at all the busses after the placement of filter especially at bus number 4. The THDI is reduced from 23% to 9.30% at bus 4 after the placement of filter.
TABLE IV
COMPARATIVE RESULT OF THDI FOR 9 BUS RDS
Bus Number Total Harmonic Distortion (THDI(%))
Before Filter After Filter
1 0.47 0.19
2 5.52 2.23
3 16.59 6.71
4 23.00 9.30
5 21.30 8.64
6 20.61 8.37
7 19.85 8.07
8 18.59 7.58
9 17.64 7.21
Harmonic current spectrum of IEEE 9 bus RDS after the placement of filters is shown in Fig.4. From which it is identified that the dominating order of harmonics are suppressed, which shows the effectiveness of the filter.
B. Case study II
The Second system considered here is IEEE 34 bus RDS [12] .Load buses are identified and the non-linear load is placed at bus number 17,24 and 34 in order to pollute the system. The harmonic spectrum of nonlinear load is given in Table 5.
Fig. 4 Harmonic current spectrum of IEEE 9 bus RDS after filter placement
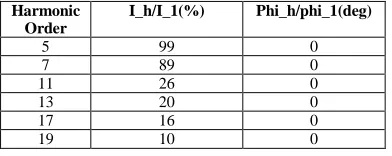
TABLE V
HARMONIC SPECTRUM OF NON-LINEAR LOAD FOR IEEE 34 BUS RDS
Harmonic Order
I_h/I_1(%) Phi_h/phi_1(deg)
5 99 0
7 89 0
11 26 0
13 20 0
17 16 0
19 10 0
The Single line diagram of IEEE 34 bus RDS with non linear load is shown in Fig 5.
Fig. 5 Single line diagram of IEEE 34 bus RDS
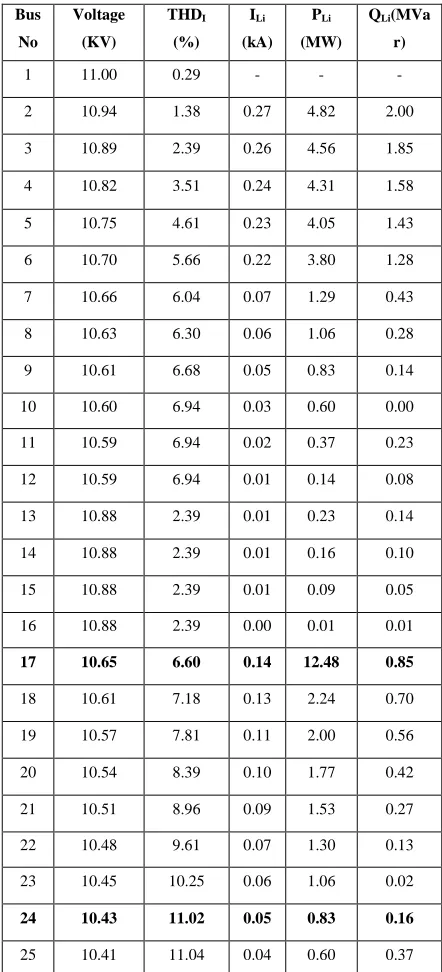
Copyright to IJIRSET www.ijirset.com 116 The THDI value is raised to a value of 10.64%
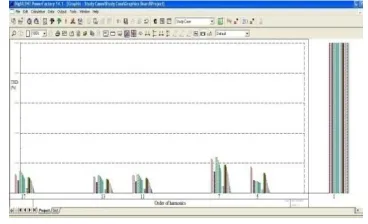
due to the presence of nonlinear load placed at three buses. Hence passive harmonic filter is designed to reduce the current harmonic distortion value at all buses. The dominating order of harmonics is determined from the harmonic current spectrum shown in Fig 6.
RDS before the placement of filter From the Fig 6 it is determined that the 5th and 7th order harmonics are most dominating. Hence passive harmonic filter is designed for those two orders and placed at bus number 17 and 24 respectively. The filter placement at bus number 34 does not result in effective reduction of harmonics value; hence filter is placed at bus number 17 and 24 only. The filter parameters are tabulated in Table 7.
TABLE VI
LOAD FLOW AND HARMONIC FLOW RESULT OF IEEE 34 BUSRDSBEFORE FILTER PLACEMENT
Bus
No
Voltage
(KV)
THDI
(%) ILi
(kA) PLi
(MW)
QLi(MVa
r)
1 11.00 0.29 - - -
2 10.94 1.38 0.27 4.82 2.00
3 10.89 2.39 0.26 4.56 1.85
4 10.82 3.51 0.24 4.31 1.58
5 10.75 4.61 0.23 4.05 1.43
6 10.70 5.66 0.22 3.80 1.28
7 10.66 6.04 0.07 1.29 0.43
8 10.63 6.30 0.06 1.06 0.28
9 10.61 6.68 0.05 0.83 0.14
10 10.60 6.94 0.03 0.60 0.00
11 10.59 6.94 0.02 0.37 0.23
12 10.59 6.94 0.01 0.14 0.08
13 10.88 2.39 0.01 0.23 0.14
14 10.88 2.39 0.01 0.16 0.10
15 10.88 2.39 0.01 0.09 0.05
16 10.88 2.39 0.00 0.01 0.01
17 10.65 6.60 0.14 12.48 0.85
18 10.61 7.18 0.13 2.24 0.70
19 10.57 7.81 0.11 2.00 0.56
20 10.54 8.39 0.10 1.77 0.42
21 10.51 8.96 0.09 1.53 0.27
22 10.48 9.61 0.07 1.30 0.13
23 10.45 10.25 0.06 1.06 0.02
24 10.43 11.02 0.05 0.83 0.16
25 10.41 11.04 0.04 0.60 0.37
26 10.41 11.04 0.02 0.37 0.23
27 10.41 11.04 0.01 0.14 0.09
28 10.65 6.04 0.01 0.23 0.14
29 10.65 6.05 0.01 0.15 0.10
30 10.65 6.05 0.00 0.08 0.05
31 10.59 7.12 0.02 0.23 0.23
32 10.59 7.37 0.02 0.17 0.26
33 10.59 7.56 0.02 0.11 0.30
34 10.59 7.68 0.02 0.06 0.33
TABLE VII
FILTER PARAMETERFOR IEEE 34 BUS RDS
Harmonic Order
Filter parameters R
(Ω) L (mH)
C (µf)
Quality factor
Reactive Power (KVAR)
17 5 26.99 171.9 2.359 10 87.71
7 18.89 85.95 2.407 10 87.71
24 5 25.83 161.6 2.465 10 87.71
7 18.08 82.29 2.515 10 87.71
TABLE VIII
FILTER COMPARATIVE RESULT OF THDIFOR IEEE 34 BUS RDS
Bus Number Total Harmonic Distortion (I) Before Filter After Filter
1 0.29 0.18
2 1.38 0.88
3 2.39 1.54
4 3.51 2.26
5 4.61 2.97
6 5.66 3.64
7 6.04 4.02
8 6.30 4.28
9 6.68 4.67
10 6.94 4.92
11 6.94 4.92
12 6.94 4.93
13 2.39 1.54
14 2.39 1.54
15 2.39 1.54
16 2.39 1.54
17 6.60 4.14
18 7.18 4.49
19 7.81 4.88
20 8.39 5.23
21 8.96 5.58
22 9.61 5.98
23 10.25 6.37
24 11.02 6.85
26 11.04 6.86
27 11.04 6.86
28 6.04 4.03
29 6.05 4.03
30 6.05 4.03
31 7.12 5.11
32 7.37 5.36
33 7.56 5.55
34 7.68 5.68
Fig. 6 Harmonic Current Spectrum of IEEE 34 bus RDS before the placement of filter
After the placement of filter at the respective buses the load flow and harmonic flow studies are performed to evaluate the effectiveness of the filter. The comparative result of THDI before and after the placement of filter is shown in Table 8. From the Table 8 it is identified that the THDI value is reduced from 10.65% to 8.71%. In order to know the effectiveness of the filter placed, Harmonic current spectrum for the IEEE 34 bus RDS after the placement of the filter was viewed and is shown in Fig 7. From the Fig 7 it is clear that the 5th and 7th order harmonics are suppressed, this shows the effectiveness of the filter.
Fig. 7 Harmonic Current Spectrum of IEEE 34 bus RDS after the filter placement
IV. CONCLUSIONS
The proposed work deals with analyzing of the load flow and harmonic flow of IEEE 9 bus and IEEE 34 bus RDS with and without inclusion of harmonic sources. The
passive harmonic filters are designed and implemented for IEEE 9 bus and IEEE 34 bus RDS. The THDI was measured and it was obvious that the THDI is under the limit specified by IEEE standard 519 – 1992 after the placement of filter. This validates that the designed harmonic filter is efficient to mitigate harmonics in RDS.
REFERENCES
[1] M.H.J.Bollen, ―What is Power Quality?‖ Electric Power Systems Research, Vol 66(2003),pp5-14.
[2] IEEE Std 519-1992, IEEE Recommended Practices and Requirements for Harmonic Control in electric Power Systems(ANSI), April 12, (1993).
[3] Partha S. Bhowmik and S.Sengupta, ―Electric Power Quality in a Deregulated Power System: A Review‖, International Conference on Power Systems, ICPS (2004) ,pp 83-88. [4] AmbraSannio, Jan Svensson, Tomas Larsson,
―Power-electronics solutions to power quality problems‖, Electric Power Systems Research, Vol 66(2003), pp 71-82.
[5] S.J.Bester and G.Atkinson – Hope, ―Harmonic Filter Design to Mitigate Two Resonant Points in a Distribution Network‖, Journal of Energy and Power Engineering 6 (2012) 2018-2023. [6] Yinan GUO, Jian CHENG and Dandan LIU, ―Optimal Design of
Asymmetry Passive Power Filters Based on Adaptive Cultural Algorithm with Hybrid Mutation‖, Journal of Computation Information Systems, Vol 10, (2011) pp 3730 – 3738.
[7] Ying-Pin Chang and Chinyao Low, ―Optimization of a passive harmonic filter based on the neural-genetic algorithm with fuzzy logic for a steel manufacturing plant‖, Science Direct, Vol 34, (2008), pp 2059 -2070.
[8] Gary W. Chang, Hung – Lu Wang and Shou – Yung Chu, ―Strategic Placement and Sizing of Passive Filters in a Power System for Controlling Voltage Distortion‖, IEEE Transactions on Power Delivery, Vol -19 (2004), pp 1204 – 1211.
[9] L.I.Kovernikova, Nguyen Chi Thanh, ―An Optimization approach to calculation of passive filter parameters based on particle swarm optimization‖ , International Conference on Renewable Energies and Power Quality , 2012.
[10] Chih-Ju Chou, Chih-Wen Lin, June – Yown Lee and Kume-Da Lee, ―Optimal Planning of Large Passive-Harmonic-Filters Set at High Voltage Level‖, IEEE Transactions on Power Systems, Vol 15, (2000), pp 433 – 441.
[11] AvadhanamKartikeyaSarma, KakarlaMahammad Rafi ,―Optimal Capacitor Placement in Radial Distribution Systems using Artificial Bee Colony(ABC) Algorithm‖, Innovative Systems Design and Engineering , Vol 2 , No 4,(2011).