ON T H E GENETICS OF T H E SPOTTED PATTERN OF THE GUINEA P I G
SEWALL WRIGHT AND HERMAN B. CHASE University of Chicago, Chicago, Illinois
Received May z o , 1936
INTRODUCTION
OAT patterns in which color is restricted to spots on a white ground
C
are extremely common in guinea pigs, and have naturally attracted the attention of geneticists from the first. That the genetic situation is somewhat complicated is indicated by the fact that there are a t present a t least three decidedly different interpretations.Variations in this type of pattern, ranging from mere traces of white in a few locations (toes, nose, between ears) to black eyed white, through intermediate grades showing much diversity in localization and of ten ex- treme asymmetry, were described by CASTLE (I~os), who, however, at- tempted no genetic interpretation. GOODALE and MORGAN (1913) pub- lished data from which they concluded that “the spotted coat is a very complex affair depending presumably on a number of factors. ” They sug- gested the hypothesis that there may be one recessive factor (ss) necessary for any spotting with extension due to other factors (sIsI, ~ 2 . ~ 2 , s3s3 etc.).
IBSEN (1916) provisionally treated spotting as due to a recessive factor s,
but noted “evidence is accumulating which seems to indicate that the rela- tionship is not as simple as has hitherto been supposed.”
I n a list of guinea pig color factors (WRIGHT 1916) the symbol Zw was used for the “assemblage of unanalyzed factors which determine white spotting.” In a review in the next year, however, (WRIGHT 191 7), a pair of alleles S , s was listed as differentiating a t least certain inbred stocks. The extreme variability of the pattern in both amount and localization of white even after 16 generations of brother-sister mating was cited as evidence for an extraordinary amount of non-genetic variability and as the reason for difficulty in genetic analysis. An effect of sex on spotting was noted. Females of each of 2 3 inbred strains were found to have slightly more white on the average than males. An effect of s as a modifier of the character of the tortoiseshell pattern of black and yellow was noted.
Early crosses between inbred strains
SPOTTING I N THE GUINEA PIG 759 TABLE I
Distributions of 4 inbred strains of guinea pigs, 1916-22 i n percentages. Grade 0 means solid color: X means a trace of white. The grades are at 5% internals ( I =2.5 to 7.5%). W (black eyed white) i s distivzguished f r o m 20 ( a trace of color). The median percentages of white are given separately for males and females i n the last two columns.
GRADE OF SPOTTING E 3 D I A N NO.
-__ -
STRAIN % WHITE
o X-2 3-j 6-8 9-11 12-14 15-17 18-20 W -
$ 9
34 1 0 0 . 0 0 0 0 0 0 0 0 0 333 0 0
39 o 35.2 32.9 14.3 7 . 7 6.7 2 . 3 0 . 9 o 659 13.9 24.4 35 o 0.8 4 . 0 1 0 . 1 19.7 29.4 2 7 . 1 8 . 6 0 . 3 1460 62.5 68.9 13 o o o 0.5 0 . 7 2 . 8 16.2 71.0 8 . 8 1278 95.0 96.4
--__ ___
Bureau of Animal Industry. These were maintained by exclusive brother- sister mating. The senior author took charge of the experiments in 1915
a t which time 1 7 of the strains were still on hand. One of them (No. 34)
had no white spotting (although much “silvering”). All of the others con- sisted wholly of tricolors but there were great differences among them in average amount of white. A drawing of the pattern of every animal was made a t birth in a rubber stamp outline and the amount of white was estimated from an outline on tracing cloth divided into 2 0 squares. In
table I is a condensed table of distributions in 4 strains. The distributions for 13,35,39, and two other strains have been published in full, separating males and females (WRIGHT 1926). Grade X means a trace of white and
W, for black-eyed white, is distinguished from grade 2 0 with a trace of
color. Strain 39 had least white of any of the spotted strains while 13 was a t the opposite extreme.
During theyears 1916 to 1919 many crosses were made between these and other strains (WRIGHT 1922). There were 1334 young from first crosses,
TABLE 2
The distributions of reciprocal crosses between strains 39 and 13, and of Fz. Note the similarity
of Fa to R and the marked disagreement with expectation based on 25% strain 39, 50% F1 and 25%
strain 13 as indicated i n the bottom line. I n designating crosses in this and later tables, the female parent i s given first.
GRADE OF SPOTTING
CROSS - NO.
o X--2 3-5 6-8 9-11 12-14 15-17 18-20 W
______I_
3 9 x 1 3 o 3 . 3 o 13.3 6 . 7 3 0 . 0 2 0 . 0 26.7 o 30 1 3 x 3 9 o 0.8 6 . 4 8 . 0 14.4 2 5 . 6 2 7 . 2 1 7 . 6 o 125 Total F1 0 1 . 3 5 . 2 9.0 12.9 26.5 25.8 19.3 o I55 F2 o 2 . 4 1 2 . 2 1 3 . 4 8 . 5 23.2 24.4 1 5 . 9 o 82 Expected in Fz
760
981 from crosses of F1 to a third strain, 692 Fz’s from two strains and 617 Fz’s combining 4 grandparental strains. Many more were born in selec- tion experiments from these crosses. I n all of these cases, spotted by spotted produced only spotted. We shall cite data from the cross between spotted strains a t opposite extremes, (13 X39) in the same condensed form as above (table 2).
Reciprocal Fl’s are intermediate and Fz is also intermediate and only slightly more variable than F,. It is impossible to find in FP 2 5 per cent
segregants with the distribution of strain 39 or 2 5 per cent like strain 13.
The minimum number of segregating factors may be estimated at 4 or 5 .
No upper limit to the possible number can be set. It may be added that while males and females showed the usual slight sex difference there were no indications of sex linkage.
Let us now turn to the crosses between the single self-colored strain (No. 34) and spotted strains, all with much white. The latter will be treated collectively (table 3 ) .
SEWALL WRIGHT AND HERMAN B. CHASE
TABLE 3
The distributions of reciprocal crosses between strain 34 and miscellaneous spotted strains, of F2,
and of backcrosses of self or near self segregants to the spotted strains.
QRADE OF SPOTTINQ
CROSS ___ NO.
o X-2 3-j 6-8 9-11 12-14 15-17 18-20 W 0-5 6-W
34xspot 12.2 75.5 12.2 0 0 0 0 0 0 49 I O 0 0
spotX34 11.1 77.8 11.1 o o o o o o 18 100 o
TotalF1 11.9 76.1 11.9 o o o o o o 67 100 o
FP 9 . 4 5 3 . 1 9 . 4 12.5 o 6.2 9 . 4 o o 32 71.9 28.1 1st Backcross 6.3 36.6 7.1 7 . 5 13.0 5 . 5 9.1 13.4 1 . 6 254 50.0 50.0 2-4Backcross 8.6 31.9 6.9 6.9 7 . 7 1 1 . 2 9 . 5 16.4 0 . 9 116 47.4 52.6 Total Back-
cross 7.0 35.1 7.0 7.3 11.4 7.3 9.2 14.3 1.4 370 49.1 50.9
Complete dominance of self color is shown in only 1 2 per cent of the F1
SPOTTING I N THE GUINEA PIG
Non-genetic variability
761
The existence of the alleles S , s was first confidently asserted in a later paper (WRIGHT 1920) on the basis of a new experiment which had then reached the 7th backcross generation of self to inbred spotted. This experi- ment, ultimately carried to the 11th backcross generation, will be dis- cussed later. The 1920 paper dealt primarily with an analysis of the vari- ability within closely inbred strains. It was shown that in a typical strain (No. 35) descended a t that time from a single mating in the
7th
generation of brother-sister mating, there was variation from a trace of white to self- white but that this enormous variability (standard deviation about 2 2 per cent of the area of the coat) was almost wholly non-genetic. There was a correlation of only +.014 between parent and offspring (using a trans- formed scale designed to counteract the damping of variation in the neigh- borhoods of o and IOO per cent white). It was further shown that most ofthis non-genetic variability was of such a sort that environmental factors common to littermates played very little role. The correlation between littermates was only +.069.
While the intrastrain differences were thus proved to be non-genetic, the differences between strains are of course genetic. Both should be pres- ent in a random bred stock and this proved to be the case. The stock from which the inbred strains were derived had been maintained without even second cousin mating. I n this stock the correlation between parent and offspring a t this time was +.211 interpreted as indicating that 42 per cent ( = 2 X . 2 1 I ) of the variance is genetic (leaving 58 per cent as non-genetic) on the assumption of no dominance or epistasis. Confirming this was the observation that the actual variance in the inbred stock was 57 per cent of that in the random bred stock on the transformed scale.
More extensive data on this question have been reported briefly in a later paper (WRIGHT 1926) together with data which indicate that the most important of the non-genetic factors common to littermates is the age of the mother. We shall discuss these and other data on the roles of heredity and environment in a later section.
762 SEWALL WRIGHT AND HERMAN B. CHASE
tion of 3 per cent in an unfixed strain of rats is to be compared with one of about 2 0 per cent in a stock of guinea pigs in which all animals have been shown to have almost identical genetic constitutions. The same contrast is also doubtless indicated by the difference in regularity and symmetry. The patterns of hooded rats form a practically linear series of grades with a high degree of symmetry. I n guinea pigs nearly every individual has its own characteristic pattern and there is usually asymmetry. Why the same character should behave so differently in different rodents is not known. The fact of an enormous amount of non-genetic variability in the guinea pig must be taken into account in any discussion of the genetics of white spotting in this animal. The phenotypes of single individuals are prac- tically worthless here as indicators of genotypes.
Eleven generations of back crossing
The I I-generation backcross experiment, referred to above, was re- ported a t the 1923 meeting of the American Society of Zoologists, but only
TABLE 4
Distribution of grades of spotting in F I , F2 and backcrosses to spotted strains, follozling a C Y O S S
of a self-colored male to spotted females. The backcrosses are classified according to the amount of ancestry of strains 35 (median about 65% white) and strain 13 (median at 98% white).
GRADES OF SPOTTING
NO. o X-2 3-5 6-8 9-11 12-14 15-17 18-20 W
spot X self 2 6 . 7 7 0 . 0 o 3 . 3 30
Fz 10.0 45.0 10.0 10.0 10.0 5.0 1 0 . 0 2 0
3/4blood or more35 7 . 7 44.3 7 . 7 1 7 . 3 7 . 7 1.9 9 . 6 3 . 8 5 2
Backcrosses to spot
Intermediate 1 . 8 33.9 8.8 5 . 8 10.8 11.0 14.3 12.8 0.8 398 3/4 blood or more 13 o 2 1 . 2 11.3 12.5 6 . 2 1 . 3 1 1 . 2 33.8 2 . 5 80
a brief abstract was published. The first cross was between a self-colored male (unrelated to strain 34 or to the other inbred strains referred t o above) and tricolor females from various inbred strains. Most of the young showed a little white spotting, the most extreme being a female with 30 per cent. None showed any yellow spotting. A small F, generation showed 2 5 per cent with spotting beyond the limits of F,. F, was backcrossed with tricolors of various strains and produced about 50 per cent with no more white than F, and about 50 per cent with larger amounts. Each of these classes was about equally divided between animals with and without yellow spotting.
SFOTTING I N T H E GUINEA PIG 763
tion. This process was repeated through I I backcross generations, pro- ducing a t length animals which were 99.98 per cent of tricolor ancestry but the results remained the same.
The tricolor strains used varied from ones which averaged about 65
per cent white (No. 35) to ones with over 95 per cent (No. 13). I n table 4 all backcross generations are combined, but a distinction is made between those which were $ blood or more of strain 35, those which were
2
blood or more of strain 13 and those which came of intermediate tricolor an- cestry.Obviously the line between Ss and ss must be drawn a t different points, depending on the tricolor strain used. In table 5, the line was drawn above
TABLE 5
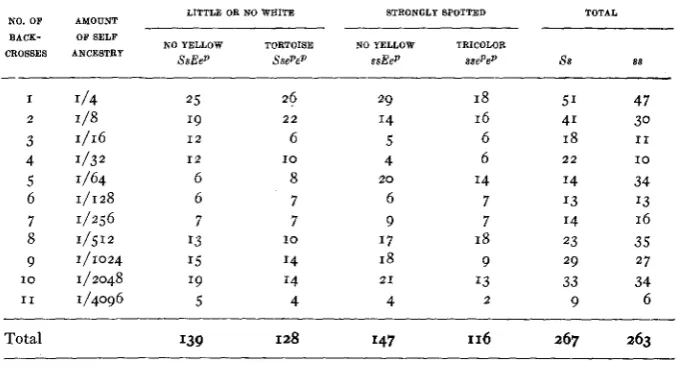
Persistence of genes S and. E through 11 generations of backcrossing of self (or near self) segregants (SsEep) to inbred tricolor stocks (ssepep). Criterion for separating Ss and. ss as described in text.
LITTLE OR NO WEITE STRONGLY SPOTTED TOTAL NO. OF AMOUNT
NO YELLOW TORTOISE NO YELLOW TRICOLOR BACK- OFSELF
CROSSES ANCESTRY
SsEep SsePeP s s E e p s s e p e p 88 88
I 2 3 4 5 6 7 8 9 I O I 1 1/4 I/S 1/32 1/64 1/256 1/512 1/1024 1/2048 I/4096 1/16 1/128 25 19 1 2 1 2 6 6 7 I3 I5 19 5 26 2 2 6 8 7 7 I4 '4 4 10 I O 29 I4 5 4 6 9 1 7 18 4 2 0 21 18 16 6 6 I4 7 7 18 9 I3 2 51 41 18 14 I3 14 23 29 33 9 2 2 47 30 I 1 I O 34 '3 16 35 27 34 6
Total I39 128 I47 116 267 263
grades 3 and 4 for males and females respectively of the group with
2
blood of strain 3 5 , above 7 and 8 for the males and females respectively of the intermediate group, and above 1 1 and 1 2 for the males and femalesof those with
9
blood of strain 13. These were the points which most nearly divided these groups on a I : I basis. It is of course recognized thatthis is somewhat arbitrary and that there was probably real overlapping in each case.
7 64 SEWALL WRIGHT AND HERMAN B. CHASE
unit (E) and the ratios indicate random assortment relative to S,s. The deficiency of tricolors is undoubtedly due to the failure of yellow spotting to appear in some of constitution ssepep which were nearly or wholly white. The fact that the white spotting factor s behaves as a modifier of the tor- toiseshell pattern was obvious in these data. In Ssepep with little white, the yellow was usually restricted to scattered hairs or an irregular brindle. I n ssepep there was a more or less complete segregation of black and yellow into distinct spots on the white ground. These effects have also been noted by ILJIN (1928). The yellow spotting factor on the other hand had no apparent modifying effect on the white pattern.
Other interpretations of spotting
PICTET has also reported on extensive experiments with white spotting in guinea pigs. From his descriptions and illustrations, it seems clear that the patterns in his stocks are similar to those with which we have worked. His conclusions, however, are very different. He finds four major pairs of alleles, two affecting head only and two the trunk only, no one of which can be identified directly with our single major pair S , s.
I n a paper (1925) dealing with white on the head he distinguishes self color, frontal white (self except for a median streak) and lateral white (white on cheeks as well as nose). Pure selfs by albinos gave 78 self to 8 2
frontal (approximately I : I). Crosses between these F1 types gave 54 self:
5 4 frontal: 36 lateral (exact 3:3:2) apart from albinos. He assumes two pairs of alleles with interactions as below.
P F ,
Ff
ff
U U , U p Frontal Self
PP
Lateral LateralIt is assumed that the selfs were of type UUff and that all of the albinos happened to be ppFf (the albino factor being correctly interpreted as in- dependent of spotting). Results from later generations are interpreted as in harmony with this hypothesis.
Later papers (1930, 1931) analyze spotting of the trunk. While it is stated that in most cases the extent of white is similar on head and trunk, it is held that these regions are subject to independent systems of genes because the correlation is not complete. I n particular it is noted that an- imals with “generalized” white on the trunk may have a self colored head while one with a self colored trunk may have any amount of white on the head. Thus while the symbols U and
p
are used for genes affecting the trunk in these papers, they are apparently not considered to be related to the head factors assigned these same symbols in the earlier paper.SPOTTING I N THE GUINEA PIG 765
for spotting. On the other hand, 5 other matings of self by spotted gave 49 self in F1, and 50 self to 19 spotted in FP, suggestive of recessive spotting. The spotting in these two cases differed in character. The white in the recessive spotting was limited to the feet and small spots on the nape of the neck and in the sternal and perianal regions (apart from the head). This is called localized spotting. In the dominant type, the white was more or less extended over the body, ranging from narrow streaks across the back or along the belly to the completely white type (with black eyes). This is called generalized spotting.
The descendants of the above crosses were interbred. The total ratios agree with expectation from formulae assigned to parents according to the following scheme of combination effects.
PPl
PP
PP
U U , U u Generalized Self
uu Localized Localized
(x2=1.2, n = 1 2 probability more than .999 of worse fit from random sampling.)
IBSEN (1932) makes the following statement in regard to white spotting. “White spotting (s) is quite variable in its expression in the guinea pig. There are probably a number of modifiers concerned and in addition there seems to be some variation that is entirely somatic. The dominant modi- fier F a (face) causes the white spotting to be restricted entirely to the face, while its allelomorph, f a , permits white to appear in other parts of the body as well. Evidence has been accumulating which seems to indicate that there is a modifier of Fa, thus being a modifier of a modifier. This factor, N u , (narrow) causes the white face to be narrow while its allelo- morph, nu, permits it to widen, N u seems to be completely dominant to
nu. There are other types of white spotting in guinea pigs, such as white belt and white rump and it is even possible by selection to produce animals that are entirely white. None of these, however, can be readily fixed by selection thus lending support to the supposition that there is more than one pair of modifiers concerned in the production of each type. I t would probably require much research to make a complete analysis of the modi- fiers affecting white spotting.”
This scheme may be represented as follows. The data supporting i t have not been published.
s-
- - Self ss F a - N u -ss F a - n u nu ss f a f u -
Narrow facial streak only Extensive facial white
White on body as well as face
766 SEWALL WRIGHT AND HERMAN B. CHASE
The greatest difference is with respect to non-genetic variability. IBSEN finds so little that definite formulae can be assigned certain phenotypes, while we have found so much in all inbred spotted stocks that such an assignment would be quite impossible.
New crosses between inbred strains
Thus since 1932 there-have been three widely different interpretations of the genetics of white spotting of the guinea pig. It seemed desirable to make a new series of tests. The following experiments involve only three closely inbred strains.
Strain D has been closely inbred since 1906 first by Prof. W. E. CASTLE
since 1916 by WRIGHT. It has never thrown white spotting of any sort. Strain 2, as used here, is entirely descended from a single mating in the 15th generation of brother-sister mating (U.
S.
D. A strain, p . 759). I t hasTABLE 6
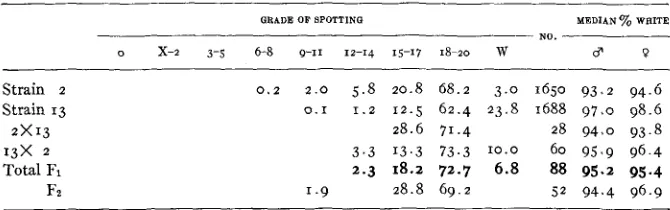
Distributions of spotting i n strains 2, 13, i n reciprocal crosses bebeen them and i n Fz.
GRADE OF BPOTTINQ MEDIAN 70 WRITE
NO.
- -
0 x-2 3-5 6-8 9-11 12-14 15-17 18-20 w $ 0
Strain 2 Strain 13 2 x 1 3 1 3 X 2 Total FI
Fz
0.2 2 . 0 5.8 20.8 68.2 3 . 0 1650 93.2 94.6
0.1 1.2 12.5 62.4 23.8 1688 97.0 98.6 28.6 71.4 28 94.0 93.8
3 . 3 13.3 73.3 10.0 60 95.9 96.4 2.3 18.2 72.7 6 . 8 88 95.2 95.4
1 - 9 28.8 69.2 5 2 94.4 96.9
consisted wholly of high grade spotted (median percentage of white 93.2 in males, 94.6 in females). There has been, however, considerable variability in grade as shown in table 6. The correlation of +.064f.025 between parent and offspring (here made without any transformation of scale, but arbitrarily treating black eyed white as a grade higher than grade 2 0 with a trace of color) shows that this variability is largely non-genetic
(see table 16).
Strain 13 as used here traces to a single mating in the 18th generation of brother-sister mating. Two substrains are distinguished, 13 and 13E, the former but not the latter from continued brother-sister mating. There is, however, no recognizable difference between them in amount of white, which is the greatest of any inbred strain we have had. The median grades are 97.0 in males, and 98.6 in females. As with strain 2, the absence of ap- preciable correlations between parent and offspring (table 16) indicates that practically all variability is non-genetic.
h
3
2
0
U
%
p
Y
9-
Q
0
-?:
2 P a
0,
v
c:
.N
-
9)
2
G
.% P
h 3
w s
U
*
:k
h
q
U4
c:
5
E
.-E:
J 8 Y v
Q
c:
e
._
0
& E
2
.g
Y
.N
B
YP)
0
2
B
768 SEWALL WRIGHT AND HERMAN B. CHASE
they are closely similar genetically. The distributions of
F1
and Fz are shown in table 6. The medians (95.2 and 94.4 per cent for F1 and Fz males respectively and 95.4 and 96.9 per cent for F1 and F2 females respectively) give no indication of any complementary effect and the doubtful increase of variability in F2 gives indication of only minor differences.Strain 2 (ss) had been mated with strain D (SS) for another purpose and repeated backcrosses had been made to D (WRIGHT 1935a). F1 (table 7) consisted of 59 animals (all Ss) of which 54 were completely self while
5 had a trace of white (one or both hind feet). This result from a cross to a strain as white as 2 indicates that
D
must have a rather exceptional stock of modifiers which repress white. Among 2 0 7 backcross animals (about half Ss, half S S ) 198 showed no white while 9 had traces consisting in most cases of a few white hairs between the ears. Among 305 of the second generation of backcrossing to D (about 2 5 per cent Ss, 75 per centS S ) only 3 showed a few white hairs. 182 animals which were 15/16 or
31/32 blood of strain D were entirely self although i t is probable that some were still heterozygous. Evidently S is almost invariably fully dominant over s where there is a preponderance of modifiers from strain D.
Some of the 7/8 blood animals (all self colored) were tested by mating with strain 13. Eight of these produced only self or low grade spotted among 83 young and were considered to be SS. The distribution of grades is shown in table 8. Two males and two females gave some high grade spotted, presumably ss, demonstrating the tested self parent to be Ss.
These tested heterozygotes were now mated inter se in order to extract a spotted line deriving its spotting from strain 2 but 718 of its modifiers from strain D (table 7). Their young consisted of 2 2 fully self and 9 low grade spotted. Matings of tested heterozygotes with these spotted segre- gants produced 17 fully self and 2 0 low grade spotted. Matings among these spotted animals and their descendants have produced 145 all spotted and, with few exceptions, of low grade. These results indicate complete recessiveness of spotting in animals which are 718 blood of strain D. Most of them were of what PICTET calls the localized type (where spotted a t all on the trunk). The results are thus close to those which he has reported for his recessive spotting factor except that white on the head (few white hairs to extensive white on nose and cheeks) nearly always accompanied the localized sFotting of the trunk, indicating that only a single main factor was involved.
00
\ cl
d
e
769 SPOTTING I N T H E GUINEA PIG
* v) t ". . . . U h
oi N P-
I =
s z g
8
v) c l : ? ? ? r
w
N
z
b gr.2 8B b d
5 s h 5 d r ' 1 0 r
-
0I l.22 ;8
: a L
9 q . G '9::
"
' b o 2 *a
w z z
%g
A $
:
% R 3 c( YI h +4 z N w aE
o wb 0
0 3 7 2 I
3
n;c
3 8 % d::@
S a-
z A2 2 v ) D 6 z 0 0 h v ) N C I N P - W O \ U v ) N
P) m 0 3 C I r . m N
B
3 U C I
.U $ d d m o d N
g s
U E ? ? ? ? ? ?
- 3 0
._ U B P ; i ; w d o d
* i
+
. + $ & L A $ +
m -&>
9
5
~ a ; m ~ ~8 ,
E
f b o " m o3 . g 6 & dW.4 I L &
4 2 - O N 0
",o 8 . 0 - g P )
3
g & l P ; l & l.% %
$ 2 m . .
" 9 m s 2 0 & N g \ o o d ; +
d w - $
i 3g v ) CI . 9'09 909 1
& v)z-?v)CIo
& U n O m o h m h
' P ; L o d W G c ; I
N I w d H C I C I
* s
1 % I
F3 b .a I
I
\ $
h
h c:
- U -
8 . 0 -
" 9 $ 4 3
-
I
\o o ? m w v)
P - 0
N C I
4
-F-i .E, e e P " ?
N h , o
2 .N r s
7 9 9
8 2
0 I I I I I I I" w
2 8
m N
2 3
2 g , * Y YI
h d S " $ 6
p x , I $ l
I
Z o
m r . V ) H m h l U m3\0 N2
C I I" W 8:: 3 2
&
I$a s 3
I
1
I \o N d % I
I
m .n
b
0 ' z
8 8
z
g ?
<?.-=\"P.?10
* * * * * r x x x
3
2 4 2
w
s
2 2 2 2 2 3s
2-z.222o u -
-
x x x x x x2 h h h h h h
m z m m , "
3 .-.\\\\\ N + C O % % d
1
y m h V l C I m
X
FI CI m a I
I
I
W
7 7 0 SEWALL WRIGHT AND HERMAN B. CHASE D OI
B
2G
'tt -a. h v 2 2j
.$ * O h4 %
Y;2
2 :
2 3
s'tt 2 %
- 2
? 2 $ 2 .
.* 3
% -8
' s k i
B-.,
3 s
2 - 2
g :
22
g
.g
3@ O h +
29
2 a N
cl ..
z ..
-2 9
ie
$ 2 8 %2 %
k 6 2+.- i
y x
* U
z *
$2
$9
. a $
x
.$z2:a '"," 3 6 3 k , y1 U
' 0 9 ' :
" ? *
w v i r - O o \ O
N W Q )
O m m
vi
Q)
N
?
N Y
? ?
W Y N W
UI W r c ) u i I O I O -
. . . . 0 0
W N
? t ? ?
9 9
0
d m o
N N H
m N O \ o
N m N v)
. . . .
0 0
N *
"9 r ? ?
0 N " 2
4
E E
" 9 1 9 9 9
? ? " ?
m
- - W O 0
Y * W N
N N d
SPOTTING I N THE GUINEA PIG 7 7 =
We will now turn to the descendants of the test crosses to strain 13
(table 9). Animals with only a trace of white were selected and back- crossed to 13 (ss). The process was repeated for several generations. No fully self-colored animals have appeared in these backcrosses. A markedly bimodal distribution of grades of spotting has, however, persisted through- out. In those 7/8 blood or more of strain 13, the median of the lower group
(Ss) was, however, higher than that of the extracted spotted (ss) with
7/8 blood of strain D, while the median of the higher group is nearly the same as that of pure 13. As in the previously reported experiments of this type, there can be little doubt of the segregation of a single major unit factor. As a critical test, however, matings were made within each of the groups of supposed segregants (table IO). The matings between high grade spotted (grades 16 to 20) gave an array almost like that of pure 13. These
were clearly ssXss. Supposed heterozygous segregants (grades X to 9) of these same generations were also mated inter se. The progeny were utterly different. Of the 136 young,
17
were fully self and 24 more had only a trace of white. About 66 per cent had more color in the coat than the most colored of the young from the high grade parents. This result leaves no doubt of the conclusion that there is here segregation of a single spotting factor showing incomplete dominance over self. The results from the crosses between 2 and 13 show that it is the same spotting factor thatwas completely recessive where there was 7/8 blood of strain D.
As noted
17
of the 136 young from SsXSs were recorded as self. This is only 12.5 per cent or half the proportion of SS expected, indicating thata small amount of white may be brought out by the “modifiers” of strain
13 even in the absence of the main spotting factor. Unfortunately strain
13 is silvered as well as spotted. The above
17
animals showed more or less silvering but no white in the regions (nose, forehead and feet) where pie- bald white is most likely to appear. Those recorded as having a trace or more of piebald white all showed white in one or more of these regions.Tests of grading
It seemed desirable to test the reliability of the grades. As noted, these were based on drawings made in rubber stamp outline. Most of the draw- ings were made by the senior author a t the time of recording births. The estimates of grades were made by the junior author, using an outline on tracing cloth, divided into squares. I n 306 cases (all from backcrosses of
7 7 2 SEWALL WRIGHT AND HERMAN B. CHASE
analysis of the two series of grades (not using Shepard’s correction) gave the following results.
Standard
Mean Deviation Correlation
Chase Wright
11.41 11.36
7.96) 7.93
There is no indication of any differential systematic errors and random errors are of negligible importance. Only about 0 . 2 per cent of the vari- ance is determined by random errors.
In another test, Mr. CHASE made wholly independent records of the patterns of I 19 miscellaneous animals, distributed rather uniformly from grade x to 2 0 , but including no black eyed whites. The two sets of drawings were also graded independently.
Standard
Mean Deviation Correlation
,989 k ,002
6.52
Chase 9.99
Wright 1 0 . 1 1
There can be no important differential systematic errors either in draw- ing or grading. Random errors are naturally considerably increased but yet account for only one per cent of the variance. As the standard deviation in this population was nearly twice that of an isogenic stock with mean near grade IO, it may be estimated that about 3 or 4 per cent of the non- genetic variance may be attributed to the combined errors of drawing and grading.
Aberrant results
Results which a t first seemed rather aberrant have been obtained from crosses between two stocks which are not related to any of the inbred strains of the preceding experiments. Strain A was built up to be dominant in a large number of genes. It consists typically of self agoutis (SEACPFB)
with smooth fur except on hind toes ( R M ) . Strain B was made up to be recessive in most of these respects. It consists of smooth-furred pink-eyed, dilute brown-yellow-white tricolors (sePackpFbrm). The results of a large backcross generation have been described in a previous paper (1928).
We are indebted to Dr.
STRANDSKOV
for use of recent data from these stocks and their crosses.The earlier records of strain A naturally revealed heterozygosis in many respects including S,s. Since 1926, however, only low grade spotting has appeared. The complete records, 1926-1934 inclusive, are given in con- densed form in table 1 1 . The records for strain B are given for the years
1924-25 as reported previously and separately for the period 1926-34.
SPOTTING IN THE GUINEA PIG 773
far from adequate picture of the situation. The total records for F1 (BXA) and ( A X B ) 1926-1934, are reported here. The backcross data (F1 X B ) are merely repeated (in condensed form) from the previous paper. The first question raised by these data is whether ss can ever be com- pletely self-colored. No such case was present in the data described earlier in this paper although the median grade of white was very low in certain strains (39,7/8D) and occasional animals had only a few white hairs. The records of 851 animals from strain B from 1926 to 1934 agree in this re- spect, but in the earlier records of B , 4 animals out of 454 (about I per
TABLE 1 1
White spotting i n strains A , B and crosses. All A’s are believed to be SS i n spite of some low grade spotting (up to grade z ) , all B’s ss i n spite of 4 selfs (grade 0). Note segregation of self i n FZ from strongly spotted R’s.
QRADE OF 8POTTINQ
NO.
-
SOURCE REMARKS
o X-2 3-5 &8 9-11 12-14 15-17 18-20 W
A 20 Matings ( o x o ) 100.0 17Matings(oXo) 86.2 13.8
7 Matings (XXo) 73.2 26.8
Total 88.4 11.6
~~ ~
B 1924-25 0 . 9 5 . 7 9 . 0 7.7 13.2 2 0 . 7 1 8 . 3 24.4 - 454 1926-34 o 5 . 9 9 . 4 10.9 15.9 20.0 1 7 . 0 20.7 0 . 2 851
Fi A X B low 36.9 63.1 I 60
A X B high 87.5 12.5 16
B X A low 29.8 70.2 242
B X A high 16.7 69.8 5 . 2 3 . 1 2 . 9 1 . 2 1.0 0 . 2 420
Total 24.0 69.0 2.9 1.6 1.4 0.6 0.5 0.1 838
FiXB 9 . 8 37.8 12.4 8 . 9 6 . 6 9 . 4 8 . 7 6 . 4 0.0 437
FZ From selected F,’s
(gradesg-12) 17.2 4 1 . 4 6 . 9 3 . 4 10.3 6 . 9 3 . 4 10.3 0.0 29
cent) were recorded as completely self colored although from homozygous spotted parents. Unfortunately this question was not definitely in mind a t the time of record and there may have been less care in looking for traces of white than in later experiments. We think it probable that plus modifiers may occasionally bring about complete absence of white spotting in ss but hesitate to affirm this positively until a case has been examined with this point in mind and has been tested genetically.
Other questions are raised by the traces of white in strain A itself and the very high grade white spotting (up to 95 per cent white) found in some of Fl ( B X A ) . I n strain A only self-colored males have been used since
7 74 SEWALL WRIGHT AND HERMAN B. CHASE
these females produced a t least one offspring each, with traces of white. The other had only 2 young. The total ratio was 30 self to 1 1 with traces of white. The remaining matings of strain A (all self by self) may be divided into two groups: 2 0 matings with 96 young all self-colored, and 1 7
matings with a t least I white-marked offspring each and a total ratio of
187 self to 3 0 with white. Two of the latter had white belts across the shoulders (grade 2).
If white spotting were due to a simple recessive in this stock, we should expect more than 50 per cent from matings classified as SsXss by the oc- currence of at least one spotted young one, but only 2 7 per cent were ob-
served. We should expect more than 2 5 percent from matings similarly
classified as SsXSs, but only 14 per cent were observed. This hypothesis is ruled out unless ss is frequently self-colored, which is contrary to all previous experience. The traces of white in strain A are clearly not due to The next possibility is that these white-marked animals are Ss. If this is true, many selfs in the strain must also be Ss, so many that a consider- able number of reasonably high grade spotted (ss) should have appeared. But this has not been the case since 1926. More evidence on this hypoth-
esis is provided by the crosses with strain B. Table I I distinguishes mat-
ings which produced a t least one offspring above grade 2 (12.5 per cent
white) from those which did not and in which the parent from strain A was certainly SS. I n the former there may be a suspicion that it was Ss.
However, the young above grade 2 from these matings constitute only 13.5 per cent of the total, a proportion so low as to practically rule out this hypothesis. It may be noted that the low ratio applies not only to the total but to every individual mating. The most extreme spotted (over 50 per cent white) came from 9 males of strain A. These produced the following ratios (making the cleavage a t 12.5 per cent) : P O : IO, 28: 7, 2 2 :4,
31:3, 16:1, 25:3, 25:5,6:1 and2:1.Noneoftheseisinharmonywiththe
mating formula S s x s s . Thus it is strongly indicated that all of strain A, self and white-marked alike, were SS and that these strongly marked Fl’s from (B XA) reaching 95 per cent white in one case, as well as the selfs
(24 per cent of the total) were all Ss.l
This is confirmed by a number of tests. Matings between rather strongly marked Fl’s (grades 9 to 12) produced the
F,
population in the bottomline of table 11. The appearance of as many as 5 self and 1 2 with only a ss
.
SPOTTING I N THE GUINEA PIG 775
trace of white out of 29 young make i t certain that the F1 parents were Ss
(not ss). I n other cases Fl’s of various grades were mated with strain 13
(the whitest of the inbred strains) (table 12). There is no appreciable dif-
ference in the results from low grade and high grade Fl’s and both agree with expectation from SsXss and not a t all with that from ssxss.
TABLE 1 2
Tests of F1 (RXB) of widely di-fferent grades by mating to the most extreme straiiz No. 13. Both groups of Fl’s breed like Ss.
GRADE OF SPOTTINQ
NO.
__ -
0 X-2 3-5 6-8 9-11 12-14 15-17 18-20 W
FI (2-6)Xstrain 13 o 32.0 10.0 6 . 0 4 . 0 8.0 16.0 24.0 - 5 0
Fl (13-17)Xstrain 13 o 20.4 12.2 4 . 1 10.2 10.2 14.3 28.6 - 49
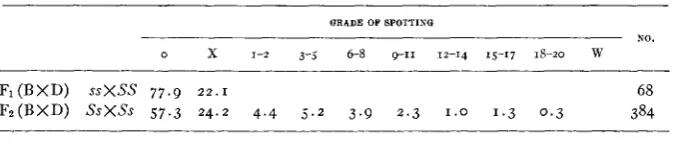
These results from (BXA) may be compared with those in table 13 from the mating (B XD). It will be recalled that strain D was wholly self
( S S ) and gave results in crosses with the high grade spotted of strain 2
which indicated an expectional array of modifiers which reduce white.
___-- __ ____--___
TABLE 13
Crosses of strains B and D.
GRADE OF SPOTTINQ
NO.
0 X 1-2 3-j 6-8 9-11 12-14 15-17 18-20 W
F i ( B X D ) SSXSS 77.9 22.1 68
Fz(BXD) SsXSs 57.3 24.2 4 . 4 5.2 3 . 9 2.3 1 . 0 1 . 3 0 . 3 384
The results from (B XD) are quite as expected. The white-suppressing modifiers of strain D have reduced Ss to a distribution similar to that of
SS of strain A, and the ss segregants in FP must have a distribution much like that of Ss of F1 (BXA).
Analysis of variability
Having established that there is just one major pair of alleles affecting white spotting in a number of diverse stocks, it is desirable to return to the evaluation of the roles of heredity and environment in determining the variation within a spotted stock. I n doing this i t is desirable to allow for the obvious damping of variability a t both extremes of the range from self color to self white. An approximate method of doing this has been discussed in previous papers (WRIGHT 1920, 1926). The assumption that
776 SEWALL WRIGHT A N D HERMAN B. CHASE
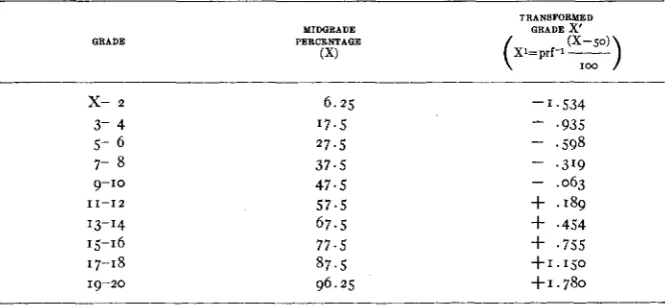
For the purpose of calculating the correlations, the grades were grouped in pairs and a transformed grade was found for the mid point of each (table 14). Table 15 shows the correlations between parents, between parent-offspring by sex and between littermates also by sex in a random bred stock and in a portion of strain 35 derived from a single mating in the I 2th generation of brother-sister mating, using the above transforma-
tion of scale. The records for these two stocks were made during the same period of years (1916 to 1924) and are thus strictly comparable. The same set of correlations but without the transformation of scale has been found for a more recent branch (1926-1934) of strain 35, tracing to a single mat-
TABLE 14
Transformed grades, based on the inverse probability function of the midgrades and used i n calculating standard deviations and correlation coejicients.
TRANSFORMED
MIDGRADE GRADE x'
GRADE PERCENTAGE
(X)
x-
2 3- 4 5- 6 7- 89-10
13-14 15-16 17-18 19-20 11-12
6.25 ' 7 . 5
27.5
37.5 47.5 5 7 . 5 67.5 7 7 . 5 87.5 96.25
-1.534
-
.935- ,319
- .063
- .598
+
.I89+
.454+
.755 +I.IjO+1.780
ing in the 22nd generation (35 D) (table 15) and for strain 2 and the two
branches of strain 13 described earlier in this paper (table 16). In the case of 35 D, the correlations among brothers and sisters which were not littermates were also found. The correlations between brothers and be- tween sisters were calculated from symmetrical tables, each pair being entered twice.
SPOTTING IN THE GUINEA PIG I l l
For analysis of the variability we can use only the data based on the transformed scale. If h2 represents the portion of the variance due to heredity, e2 that due to environment common to littermates and d2 that due to environment not common to littermates; the correlation between parent and offspring should equal $h2 if the effects of all genes combine ad- ditively (no dominance or epistasis) but should be somewhat less if these conditions are not met (WRIGHT 1920). Under the same conditions the
TABLE 15
Parent-ojspring and fraternal correlations in a random bred stock, and i n the inbred strain N o . 35 at two periods. Transformed grades used i n case of random breds and the earlier data from strain 35. Untransformed grades used in 35 D.
RANDOM BRED STRAIN 35 STRAIN 35 D
STOCK (191624) (1926-34)
NO. r NO. r NO.
'
Father-Mother 143 +.060 140 +.064 72 - .047
Parent-offspring 3-8 973
+
,244 738+
.or5 200 - ,0689 - 3 1014 +.217 738 +.013 196 +.05z
9 - 9 965 +.116 688 -.m4 185 - .031
3 - 9 929 +.187 688 +.074 190 +.I49
Average 3881 + . I ~ I 2852 +.024 771 +.026
Littermates 3-3 537 +.355 340 +.128 91 +.024
3 - 9 1050 +.288 722 +.089 180
+.
1099 - 9 493 +.I90 305 +.IO7 89 +.218
Average 2080 +.282 1367 +.103 360 +.t15
Sibs not 3-3 335 - ,061
littermates 3- 9 509 - .049
9 - 9 202 - .02I
Average 1046 - .048
correlation between littermates would be +h2+e2. The assumption of complete dominance and equal frequencies of alleles reduces the parent- offspring correlation to 1/3h2 and that between littermates to 5/12h2+e2. In all cases, dominance reduces the genetic component of the fraternal correlation just half as much as it does the parent-offspring correlation (PEARSON 1909; WEINBERG 1910; FISHEX 1918). Any non-additive effects among genes which are not alleles (epistasis) also reduces the correlations between relatives (WRIGHT 1935).
778 SEWALL WRIGHT AND HERMAN B. CH..ZSE
variance of strain 35 is thus 59 per cent
(::@::)
- of that of the random bred stock indicating that about 41 per cent of the latter variance was due to heredity, and had been lost after long continued inbreeding of strain 35. The correlation between parent and offspring in the random-bred stock (+.191) indicates 38 per cent ( = 2 x.19) of the variance as due to additive gene effects. This differs so little from the 41 per cent estimated from the actual variances that little complication from non-additive geneTABLE 16
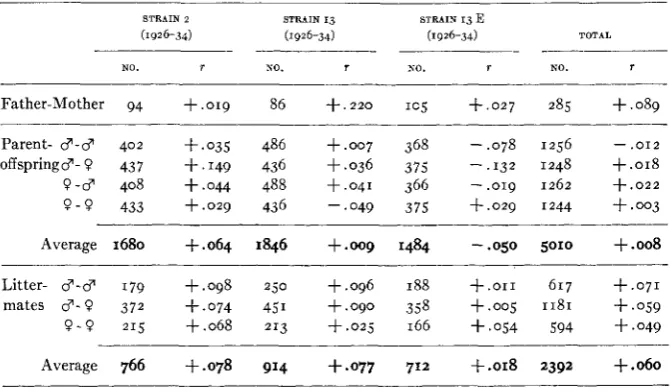
Parent-offspring and fraternal correlations i n 3 inbred strains, characterized by very large amounts of white. Untransformed grades.
~~ ~
STRAIN 2 STRAIN 13 STRAIN 13 E
( 1 9 2 6 - 3 4 ) ( 1 9 2 6 - 3 4 ) ( 1 9 2 6 - 3 4 ) TOTAL
- - - ___
NO. 1 NO. r NO. T NO. T
- ___--__
Father-Mother 94 +.019 86 +.zzo I C ~ f . 0 2 7 285 +.089 Parent- 3-3 402 +.os5 486 +.007 368 -.078 1256 - - . O I Z
offspring$-? 437 +.149 436 +.036 375 -.I32 1248 +.OI8
9 - 3 408 +.044 488 S . 0 4 1 366 - . o r 9 1262 +.022
9 - 9 433 + . o q 436 -.049 375 f . 0 2 9 1244 +.003 Average 1680 f . 0 6 4 1846 +.oog 1484 -.050 5010 +.008
Litter- $-$ 179 +.098 250 +.096 188 + . o r 1 617 + . 0 7 1
mates 3 - 9 372 f.074 451 +.090 358 +.oq 1181 +.OS9
9 - 9 215 +.068 213 + . o q 166 +.OS4 594 +.049
Average 766 +.078 914 +.077 712 f.018 2392 +.060
effects (dominance or epistasis) is indicated. It should be said, however, that another method of calculating the transformed standard deviations of the inbred and random bred strains was made by fitting the distribu- tions by the function prf-l (Zf - .so) = I/S [prff1(X - .so) -a] where a and s are the mean and standard deviation on the transformed scale and Zf the running sum of the fractional frequencies (WRIGHT 1926). This yields 54 instead of 59 per cent as the ratio of the variances (s = .782 in random bred stock, s = . 5 7 4 in strain 35). A somewhat greater role of non-additive gene effects is indicated by this method. The difference was due mainly to irregularities in the distribution of the random bred animals.
SPOTTING I N T H E GUINEA PIG 779 .209 or 35.2 per cent of the standard deviation of the total population
(.593). The proportion of the total variance due to sex is given by the ratio of the square of the half difference to the total variance, or one fourth the square of the above fractions. It appears that 2.5 per cent of the vari-
ance in the random bred stock and 3.1 per cent in strain 35 was due to sex. The analysis into genetic and nongenetic portions applies of course to the 98-97 per cent not due to sex.
The littermate correlation in strain 35 (+.103) can be taken as indi- cating the portion of the variance (within each sex) which is due to en- vironment common to littermates. This is on the assumption that the
TABLE 17
Mean percentages of %lhite in males and females o j strain 35, at two periods, in relation to age of mother.
STRAIN 35 ( 1 9 1 6 - 2 4 ) STRAIN 35 D ( 1 9 2 6 - 3 4 ) AGE OF -____
MOTHER MALES FEMALE8 MALE8 FEMALES
(MONTHS) -____
NO. AV. NO. AV. NO. AV. NO. AV.
3- 5 182 5 6 . 3 153 6 0 . 5 2 5 5 6 . 0 31 6 5 . 0
6- 8 195 5 9 . 5 187 6 7 . 6 45 67.8 41 70.2
9-11 1 5 2 60.6 160 6 6 . 5 40 71.7 21 78.1 12-14 150 6 1 . 3 124 70.6 33 69.8 30 76.3
15-20 174 6 3 . 2 149 69.6 27 61.9 34 74.7
21-46 138 66.9 144 7 3 . 3 23 78.2 2s 77.6
Total 991 61.1 917 67.8 193 67.8 182 73.1
_____-_-__
- _ _ _ ~ _ _
parent-offspring correlation (+.024) can be ignored. If the latter is ac-
cepted, the estimate is reduced to +.079. The figures from the other in- bred strains confirm the existence of an effect of the order of these figures as does the difference (+ .091) between littermate and parent-offspring correlations in the control stock. It is indicated that the greater portion of the variance (89.7 per cent in strain 35) is due to environmental factors so local in incidence that they do not affect littermates alike.
The only direct evidence on the nature of the environmental factors common to littermates is given by tabulations of grade of spotting in rela- tion to age of mother. Such tabulations have been made in strains 35, 35 D, 2 and 13. I n the last two cases no significant relations were found, but the highly asymmetrical distributions banked up against the limit of IOO per cent white make these unfavorable material for detecting slight
780 SEWALL WRIGHT AND HERMAN B. CHASE TABLE 18
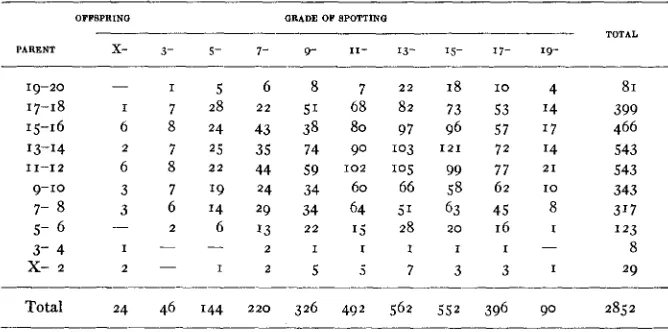
Joint frequencies of parent and ofspring i n inbred strain 35. Correlation (broad categories) +.026
OFFSPRINQ GRADE OF SPOTTINQ
TOTAL PARENT X- 3- 5- 7- 9- 11- 13- 15- 17- 19-
19-20 17-18 15-16 13-14 9-10 11-12
7- 8
5- 6
3- 4
x-
2- 1 5 6 8
I 7 28 2 2 51
6 8 24 43 38
2 7 2 5 35 74
6 8 2 2 44 59
3 7 19 24 34
3 6 I 4 29 34
2 6 13 22
- 7 68 80 90 60 64 1 5 I 0 2
22 82 97 103 105 66 5' 28 I8 73 96 I21 99 58 63 2 0
1 0 4
53 I4
57 17
72 I 4
77 21
62 IO
16 I
45 8
I - - 2 1 1 1 1 1
-2 - ' 2 5 5 7 3 3 1
81 399 543 543 343 317 123 8 29 466
Total 24 46 144 220 326 492 562 552 396 90 2852
up to 15 months of age. This factor determines about 3.6 per cent of the total variance and thus approximately half of that common to littermates. I n 35 D, the results are more irregular as expected from the smaller num- bers but the correlation of
+
.252 i .069 for females,+
.203 i .069 for males give clear evidence of significance (the average +.227f.o49 is 4.6 times its standard error). From the square of this figure it appears that about5 per cent of the variance (untransformed scale) was due to this factor. This would be slightly reduced by transformation of the scale. The regres- sion, 0.76 percent white per month (up to 15 months) agrees reasonably well with the earlier data. It should be noted that in case (35 D) the effect is definitely one of age of mother, since most matings were intentionally
TABLE 19
Comparison of correlations obtained by the broad category method with the averages of those given in tables 15 and 16.
PARENT-OFFSPRINQ L I T T E W A T E S SIRS, DIFFERENT LITTERS
STRAIN CORRELATION CORRELATION CORRELATION
NO. NO. NO.
TABLES BROAD TABLES BROAD TABLE BROAD
IS. 16 CAT. I S , 16 CAT. 1.5 CAT.
35 2852 +.024 +.026 1367 +.103 +.075
35D 771 +.026 +.OZo 360 +.I15 +.083 1046 --.048 -.045
2 1680 +.064 +.os9 766 +.078 +.IOI
I3 1846 +.009 +.m8 914 +.077 +.090
13E 1484 -.050 -.066 712 + . o r 8 +.m5
AV. 5 inbred
strains 8633 +.016 f . 0 1 2 4119 +.079 +.072
Random
SPOTTING IN THE GUINEA PIG 781
made between males and females of widely different ages (WRIGHT 1935, It has seemed desirable to check the parent-offspring and littermate correlations by a different method of allowing for the distortion of the scale. For this purpose the tabulations by sex were combined into single tables and correlations calculated by PEARSON’S method for broad cate- gories. The parent-offspring distribution for strain 35 is shown in table 18;
those for littermates in this stock and those in the random bred stock have been deposited with “Genetics.” In the broad category method, the mean
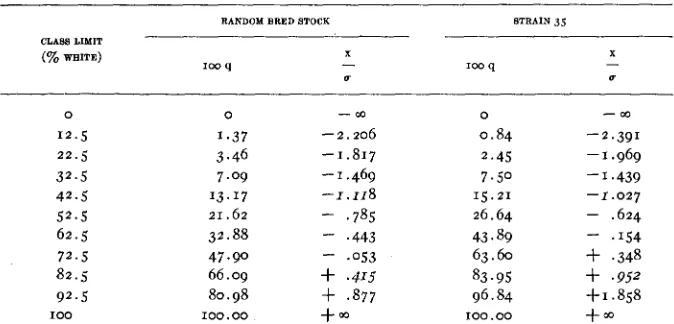
TABLE 20
Deviations of class limits from the median i n the random bred stock and in strain 35 i n terms of
their standard deviations assuming normality. See j i g . I .
P. 526).
RANDOM BRED STOCK STRAIN 35
0 12.5 22.5 32.5 42.5 52.5 62.5 72.5 82.5 92.5
1 0 0
0 1.37 7.09 13.17 21.62 32.88 47.90 66.09 80.98 3.46 100.00 - m -2.206 -1.817 -1.469
- I . I I ~
- ’785
- .443
- .os3
+
. 4 I 5+
.a77+ m 0 0.84 2.45 7.50 15.21 26.64 43.89 63.60 83.95 96.84
roo. 00
- m
-2.391 -1.969 -1.439
-1.027
- ,624
- .I54
+
,348+
.952+I ,858 t m
of each class on a hypothetical normal scale, is calculated by the formula
21 -z2
ql-qz
x=- where ql and q 2 are the observed tail frequencies (fractions of I)
cut off by the class limits and zl and z2 are the theoretical ordinates of the unit normal curve a t these points. The approximate correlation is given by
Zx,xzf nuz12uz22’
the formula rZIZa = The results are given in table 19. Comparisons are made with the averages of the correlations for separate sexes from tables 15 and 16. The latter might be expected to be slightly larger because of the elimination of sex differences but the different scales prevent exact comparison. On the whole the differences are unimportant.
I n this method, the scale is adjusted in each case so as to yield a cor- rected standard deviation of I. Thus each distribution yields a separate
782
and 19 (92.5 per cent white) the values fall rather closely along a straight line. Taking the values a t 4 2 . 5 and 82.5 as those closest to the standard deviations, considering both scales (fig. I ) we see that a scale interval of
1.533" in the random bred stock corresponds to one of 1 . 9 7 9 ~ for strain 35. 1.533 The corrected standard deviation of strain 35 is thus 77.5 per cent =
-
1 e979 of that of the random bred stock and its variance is 60.1 per cent ( = .775')
SEWALL WRIGHT AND HERMAN B. CHASE
+2r
+ D
Y
c)
0
3i
0 0
0, L
P
0 3 t
E
d - Q
CL
-2u
i
-20- -0- 0 to- +2(T
Inbred
Strain35
FIGURE I . Transformation of class limits to give normal distribution of class frequencies in random bred stock plotted against similar transformation for inbred strain 35. The range between white and 8 ~ . 5 7 ~ white includes 1 . 9 7 9 ~ in the inbred strain but 1 . 5 3 3 ~ in the random breds. The variance of the inbred stock is thus 60.1% (= 1.533~/1.979~) of that of the random bred stock on a scale based on these two points.
SPOTTING I N THE GUINEA PIG 783
value actually found in strain 35 by the above method. The agreement with results from the previous method is as close as can be expected. There can be little or no dominance or epistasis among the minor factors which affect spotting.
Putting all of these results together we reach the following approxi- mate analysis of variance in the random bred stock and an isogenic in- bred strain.
Isogenic Random Bred Inbred Strain Stock Heredity
Sex
Environment Age of mother
Other factors common to littermates Factors not common to littermates
DISCUSSION
The results fall into a consistent picture. dicated.
0 40
3 2
4
IO0 IO0
Four classes of factors are in- First is a major pair of alleles, S,s. SS is usually self but under excep- tional conditions shows traces of white up to a small shoulder belt; Ss
may be self colored or any grade of spotted up to a t least 95 per cent white;
ss is usually well marked with white, often self white, but may have only a trace of white and perhaps may be completely self-colored under very unusual conditions.
Second is a multiplicity of minor genetic factors with additive effects (little or no dominance or epistasis). The median grade of ss can be shifted from about IO to 97 per cent white by the appropriate combination. The median grade of Ss may similarly be shifted from self color to about 30 percent white. Finally a little white may appear in SS with an extreme array of white modifiers.
Third, there is an enormous amount of non-genetic variability respon- sible for a range extending from a trace of white to IOO per cent white in
isogenic strains whose median grade is near 50 per cent. This can be sub- divided into a small portion composed of factors common to littermates, in which is included an effect of age of mother in a t least one stock, and a large portion not common to littermates and hence to be interpreted as due to developmental accidents. In a typical random bred stock, all ss,
784 SEWALL WRIGHT AND HERMAN B. CHASE
88%
D
12% 2
44% D
56‘% 2,13
0.
60- $SS
50.
40-
3 0
20.
10. 94% 2.13
0
?
55
6 %
0
ox
I 2 3 4 5 6 7 8 0 10 I1 12 13 14 IS16 17 18 19WWI
FIGURE 2. Distributions of SS, Ss, and ss according to sex and residual heredity. The abscissas are the classes used in grading. The ordinates are the fitted percentage frequencies in these classes, doubled in the cases of X and 20 to allow for the fact that their ranges are only of half width.