INVESTIGATION
Causes and Consequences of Genetic Background
Effects Illuminated by Integrative Genomic Analysis
Christopher H. Chandler,*,†,1,2Sudarshan Chari,*,†David Tack,*,3and Ian Dworkin*,†,1 *Michigan State University, Department of Zoology, East Lansing, Michigan, 48824, and†BEACON Center for the Study of Evolution in Action
ABSTRACTThe phenotypic consequences of individual mutations are modulated by the wild-type genetic background in which they occur. Although such background dependence is widely observed, we do not know whether general patterns across species and traits exist or about the mechanisms underlying it. We also lack knowledge on how mutations interact with genetic background to influence gene expression and how this in turn mediates mutant phenotypes. Furthermore, how genetic background influences patterns of epistasis remains unclear. To investigate the genetic basis and genomic consequences of genetic background dependence of the
scallopedE3allele on the Drosophila melanogaster wing, we generated multiple novel genome-level datasets from a mapping-by-introgression experiment and a tagged RNA gene expression dataset. In addition we used whole genome resequencing of the parental lines—two commonly used laboratory strains—to predict polymorphic transcription factor binding sites for SD. We integrated these data with previously published genomic datasets from expression microarrays and a modifier mutation screen. By searching for genes showing a congruent signal across multiple datasets, we were able to identify a robust set of candidate loci contributing to the background-dependent effects of mutations in sd. We also show that the majority of background-dependent modifiers previously
reported are caused by higher-order epistasis, not quantitative noncomplementation. Thesefindings provide a useful foundation for more detailed investigations of genetic background dependence in this system, and this approach is likely to prove useful in exploring the genetic basis of other traits as well.
G
ENETICISTS often strictly control their organisms’ wild-type genetic backgrounds when experimentally dissect-ing genetic pathways. Although this tight control is necessary to avoid faulty inferences caused by confounding variables (e.g., Burnettet al.2011), it can often paint an incomplete or even incorrect picture; no genetic pathway or network exists in a vacuum. Instead, these networks occur in the context of all the alleles in the genome, which usually varyamong individuals. There is substantial evidence that wild-type genetic background almost always modulates the phenotypic effects of mutations (e.g., McKenzie et al. 1982; Threadgill et al.1995; Atallahet al. 2004; Millozet al.2008; Chandler 2010; Dowellet al.2010; Gerkeet al.2010). The influence of wild-type genetic backgrounds also extends to interactions among mutations (Remold and Lenski 2004; Dworkin et al. 2009; Wanget al.2013b), altering patterns of epistasis, and these complex interactions are likely widespread (Chari and Dworkin 2013). Alleles that influence many mutant pheno-types segregate in most natural populations, representing a potential source of cryptic genetic variation (Polaczyket al. 1998; Félix 2007; Vaistij et al. 2013). In many cases, this cryptic variation has been described phenomenologically, or via the partitioning of genetic variance components (Gibson et al.1999; Dworkinet al.2003; McGuiganet al.2011). How-ever, its genetic basis remains poorly understood (Dworkin et al.2003; Duveau and Félix 2012).
If our aim is to understand how a specific perturbation to a genetic network (e.g., a particular mutation) influences the phenotype outside a laboratory setting—a goal shared by
Copyright © 2014 by the Genetics Society of America doi: 10.1534/genetics.113.159426
Manuscript received November 7, 2013; accepted for publication January 28, 2014; published Early Online February 5, 2014.
Supporting information is available online athttp://www.genetics.org/lookup/suppl/
doi:10.1534/genetics.113.159426/-/DC1.
Data deposited in the Dryad Repository, doi:10.5061/dryad.1375s. NCBI SRA: SRP035237, SRX423326, SRX423475, SRX423855, SRX423874, SRX424394, SRX424397, SRX424398.
1Corresponding authors: Department of Zoology, Michigan State University, East Lansing, MI 48824. E-mail: idworkin@msu.edu; and Department of Biological Sciences, SUNY Oswego, Oswego, New York 13126. E-mail: christopher.chandler@ oswego.edu
2Present address: Department of Biological Sciences, SUNY Oswego, Oswego, New York 13126.
multiple disciplines, from the genetics of disease to evolutionary biology—then we must go beyond simply characterizing the phenotypic consequences of background-dependent effects. That is, we need to understand both the causes and conse-quences of this genetic background dependence of mutational effects (Chandleret al.2013). For instance, one study showed that specific quantitative trait nucleotide (QTN) alleles in naturally occurring yeast (Saccharomyces cerevisiae) isolates have complex phenotypic effects depending on both genetic background and environmental context (Gerkeet al.2010). However, to make predictions about how a particular QTN may influence trait variation in a novel genetic (or environ-mental) context requires a more mechanistic understanding of how the QTN allele interacts with the genetic background to influence phenotypes, whether at the level of gene expression, cellular changes, morphology, behavior, etc. (Xuet al.2013). This goal may involve mapping the background modifier loci to identify the genes and alleles responsible for the back-ground dependence (e.g., Chandler 2010; Duveau and Félix 2012), and testing which genes are misexpressed (and how severely) as a result of the mutation in different genetic back-grounds (e.g., Dworkinet al.2009). Only with such data will we be able to identify common patterns across traits, taxa, and mutations.
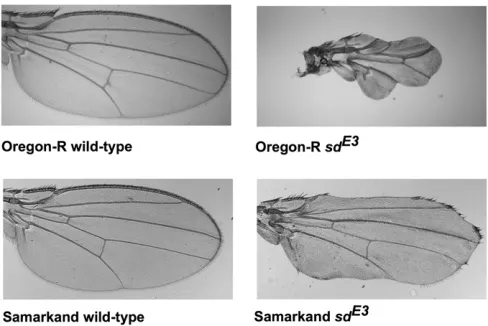
Accomplishing these goals will require tractable models. Such models should provide the ability to examine specific mutations across multiple wild-type backgrounds and geno-mic resources to facilitate the analysis of the modifiers. One such system is thefly (Drosophila melanogaster) wing. Several mutations affecting wing development have background-de-pendent phenotypic effects (Altenburg and Muller 1920; Nakashima-Tanaka 1967; Silber 1980; Dworkin and Gibson 2006; Debatet al.2009), with selectable variation present in natural populations (Thompson 1975; Cavicchiet al.1989). In one dramatic example, the scallopedE3 (sdE3) mutation causes a moderately reduced, blade-like wing in the back-ground of one common lab wild-type strain, Samarkand (hereafter, SAM), but a much more severely diminished wing in another common background, Oregon-R (ORE) (Figure 1; Dworkin et al. 2009). These two parental strains are com-monly used wild-types forDrosophilaresearch, one primarily in molecular biology (ORE), and the other (SAM) in quantita-tive genetics, aging, and studies of recombination (Hofmanova 1975; Hofmannet al.1987; Lymanet al.1996; Lyman and Mackay 1998; Leips and Mackay 2002; Mackenzie et al. 2011). More recently it was used as the common line for an advanced intercross design for the Drosophila synthetic population resource (King et al.2012). Thus, identifying se-quence polymorphisms and differences in gene expression between these two strains will facilitate studies of background dependence in otherDrosophilatraits.
The sets of genes whose expression is altered in wing imaginal discs by the sdE3 mutation in each genetic back-ground are largely nonoverlapping and partially independent from those genes that are differentially expressed between the two genetic backgrounds in a wild-type context (Dworkin
et al. 2009). The mechanisms underlying this background dependence, however, are poorly understood. Nevertheless, sditself is well studied, making it a good system for investi-gating the mechanisms underlying background-dependent expression. SD encodes a TEA family transcription factor (TF) that forms heterodimers with multiple TF partners to regulate at least three biological processes (Campbell et al. 1992; Guss et al. 2013). Its best known role is in wing development, where SD interacts with the Vestigial (VG) pro-tein (Halderet al.1998; Paumard-Rigalet al.1998; Simmonds et al.1998; Bray 1999; Varadarajan and VijayRaghavan 1999; Guss et al. 2001; Halder and Carroll 2001). In particular SD-VG regulates the expression of a number of genes infl u-encing specification of cell fates as well as overall tissue growth in the wing imaginal disc (Gusset al.2001; Halder and Carroll 2001). Recently SD has been shown to be an important transcriptional cofactor with Yorkie (YKI), medi-ating hippo signaling to regulate growth and polarity of tissues (Goulev et al. 2008; Wu et al. 2008; Zhang et al. 2008, 2009; Zhaoet al.2008; Renet al.2010; Doggettet al. 2011; Nicolayet al.2011; Zhanget al.2011; Poonet al.2012; Cagliero et al. 2013; Koontz et al. 2013; Sidor et al. 2013). Finally, SD plays a role in the development of odorant and gustatory neurons in the adult (Campbellet al.1992; Shyamala and Chopra 1999; Rayet al.2008), although the details of how it acts as a transcriptional regulator are less well known in this context.
Like other quantitative traits, the penetrance and expressivity of a mutation probably have a complex genetic basis. Indeed, in one high-throughput screen for conditionally essential genes in yeast, four or more modifier loci were necessary to explain the background dependence of numerous conditionally lethal gene deletions (Dowell et al.2010). These background polymor-phisms may also have multifactorial consequences, such as pleiotropic effects on other unrelated traits (Duveau and Félix 2012). In the case of ourDrosophilawing model system, preliminary mapping efforts suggested the presence of a major-effect modifier on chromosome arm 2R near (but not in) vg. Yet the genetic background polymorphisms respon-sible for this background dependence remain unknown (Dworkin et al. 2009). Unfortunately, due to the typically complex genetic basis of background dependence,fine map-ping these modifier loci to specific polymorphisms, or even genes, remains challenging (Zhanget al.2013). However, we may be able to gain additional insight by integrating data from a variety of approaches. For instance, gene expression studies can identify genes whose expression is affected by a focal mutation in a background-dependent manner (Dworkin et al.2009, 2011), providing a complementary set of candi-date loci. Then, using whole-genome resequencing to search for polymorphic transcription factor binding sites (TFBSs) could help explain these background-dependent effects on gene expression.
experimental sources to identify a robust set of candidate genes mediating the background dependence of the sdE3 mutation. These sources included: (i) replicated introgression lines to map the loci contributing to background dependence; (ii) whole-genome resequencing of the introgression and pa-rental lines to predict polymorphic SD transcription factor binding sites; (iii) expression profiling from a digital gene expression experiment and two existing microarray experi-ments; and (iv) the results of a previously published screen for dominant modifiers of thesdE3phenotype. Despite earlier work suggesting that there may be a single modifier of large effect (Dworkin et al. 2009), our mapping results indicate that this background dependence has a complex basis, en-compassing several genomic regions each containing multiple candidate genes. Nevertheless, the additional data help nar-row the list of candidates. In particular, patterns of allele-specific expression and SD binding site predictions suggest thatcis-regulatory variants are not a major contributor to this background dependence. Finally, we extend recent results demonstrating that the majority of genetic interactions with sdE3are background dependent (Chari and Dworkin 2013), to determine whether these are the result of quantitative non-complementation or higher-order genetic interactions. Our results demonstrate that the majority of tested background-dependent modifiers cannot be explained simply by variation at the locus interacting withscalloped, ruling out simple quan-titative noncomplementation. Overall, our results lay the foundation for more detailed investigations into the mecha-nisms underlying genetic background dependence, and sug-gest that this approach should be useful for dissecting other complex phenotypes.
Materials and Methods
Mutations and wild-type strains
As described in detail in Dworkinet al.(2009), we introgressed the sdE3 allele into the SAM and ORE wild-type strains via backcrossing for .20 generations (each marked withw2 to facilitate the introgression). Each wild-type strain (both with and without thesdE3mutation) was tested (using 8–10 molec-ular markers across the genome) to rule out contamination. Results from whole-genome resequencing (see below) were consistent with these initial results.
Generating short- and long-wing backcross lines for mapping
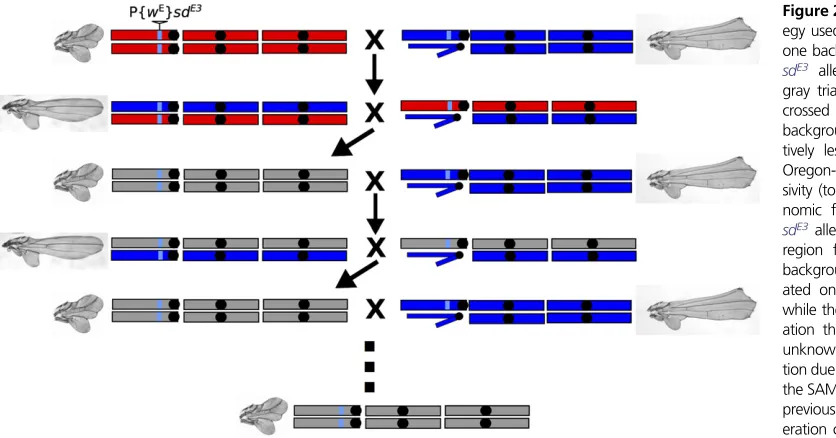
To map the loci underlying the background dependence of the sdE3mutant phenotype, we used a phenotypic selection-based backcross procedure to introgress genomic regions that harbor the short-wing alleles into an otherwise long-wing genome (Figure 2). We generated a total offive independent backcross lines by crossing ORE wsdE3flies to SAM wsdE3 flies, and crossing the F1’s together. From the F2’s, we selected
flies with both long-wing (SAM-like) and short-wing (ORE-like) phenotypes. Theseflies were backcrossed to OREwsdE3
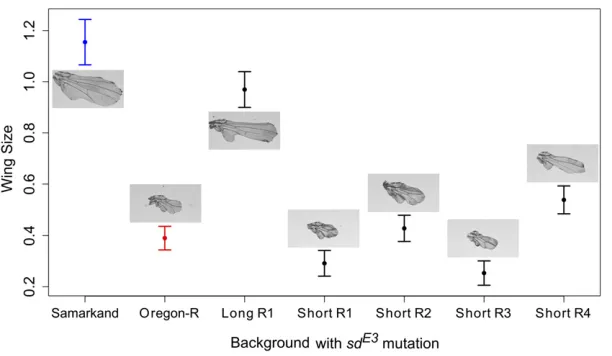
and SAM w sdE3flies, respectively, and the process was re-peated. Twelve cycles of backcrossing (24 generations) were completed for the short-wing backcross lines, and 20 cycles (40 generations) for the long-wing lines, with 20flies of each parent strain used for backcrossing each generation (Chari and Dworkin 2013). We generated four independent short-wing replicates. Only one long-short-wing replicate remained at the final generation, as maintaining the long-wing phenotype while backcrossing to ORE wsdE3was problematic because inheritance patterns broke down over successive generations: specifically, the long-wing phenotype ceased being dominant (I. Dworkin, unpublished data).
Phenotyping of wing size
To compare wing lengths in the backcross lines, along with the“pure”SAM and ORE backgroundsdE3strains, we grew each of the lines at 24°, 65% relative humidity (RH) on a 12:12 light cycle in a Percival incubator (I41VLC8) using our standard lab media. Onceflies eclosed, they were stored in 70% ethanol. Twenty wings were dissected from each genotype (10/sex) and mounted in 70% glycerol in PBS. Digital images were captured using an Olympus DP30BW camera mounted on an Olympus BW51 microscope at 340 magnification. Wing area was then estimated using a custom ImageJ macro that segments the wing blade from the rest of the image.
Resequencing Oregon-R, Samarkand, and backcross lines
We prepared genomic DNA from frozen whole flies using a Zymo Research Tissue and Insect DNA kit (Irvine, CA) following the manufacturer’s instructions and submitted samples to the Michigan State University Research Technol-ogy Support Facility for analysis on an Illumina Genome Analyzer II. SAM and ORE were each run on separate lanes while the five backcross lines were barcoded, pooled, and run on a single lane. We obtained30,000,000 paired-end 75-bp reads (with an estimated insert size of 360 bp) for each lane, yielding 24-29X coverage for SAM and ORE and 5-7X coverage for each of the backcross lines.
We mapped reads to the D. melanogaster reference ge-nome (release 5.41) using bwa v. 0.6.0-r85 (Li and Durbin 2009), allowing up to four mismatches (5%) per read. We used samtools v. 0.1.18 (Li et al. 2009) to call SNPs in all samples simultaneously and to generate consensus sequences for ORE and SAM. Sites with coverage higher than 100 times were excluded from SNP calling to avoid false positives in repeat sequences. In downstream analyses of the backcross lines, we excluded indels and included only SNPs for which SAM and ORE were both scored as homozygous, but different from one another with high confidence (genotype quality scores$30 as reported by samtools).
Backcross analyses
SAM or ORE, so we focused our attention on SNPs at which SAM and ORE were scored as homozygous for different alleles. For each SNP, we estimated the frequency of the ORE (short wing) and SAM (long wing) alleles using custom Python scripts to count the number of sequence reads in each backcross line carrying each allele. We then plotted the proportion of reads displaying the ORE allele across the entire genome using a sliding window approach (with a window size of 10 kb and a step size of 2 kb). An alternate binning approach and various bin sizes yielded similar results.
SD binding site analyses
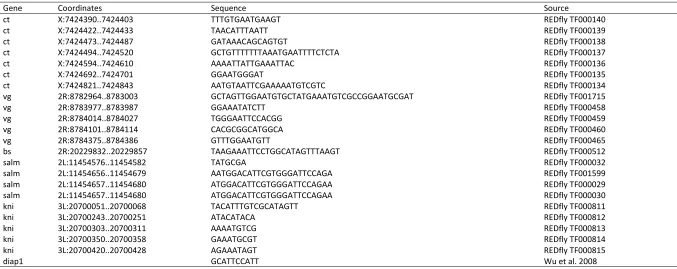
We sought to scan the ORE and SAM consensus genomes for genes that are predicted to be SD binding targets and in which sequence differences between SAM and ORE may alter putative SD binding sites. We first generated a posi-tion-weight matrix based on 23 known SD binding sites (Supporting Information,Table S1andTable S2) using the MEME suite (Baileyet al. 2009). Next, for each annotated gene in the genome, we extracted its full sequence in ORE and SAM (including introns) plus 10 kb of upstream and downstream flanking sequence. We used MotifScan.v6 (Kim et al.2010) to generate a log-likelihood ratio (LLR) score for each gene, indicating the relative likelihood that the sequence contains one or more SD binding sites. We computed the difference between the LLR scores obtained from the SAM and ORE consensus sequences (DLLR). To identify genes with the strongest evidence of having predicted SD binding sites in SAM or ORE, or of being background-dependent SD targets, we derived empiricalP-values for the LLR and DLLR scores by comparing each gene’s LLR and DLLR scores to the 1000 other genes with the most similar GC content.
To complement these genome-wide binding site analyses, we also investigated the sequences of two known SD binding sites that were previously experimentally verified, in the genes cut and salm (Guss et al. 2001; Halder and Carroll 2001), by extracting all sequence read data that mapped to those sites (using the mpileup command in samtools).
Digital gene expression
We used digital gene expression (Morrissy et al. 2009) to identify genes that are misregulated in sdE3 mutants and genes showing evidence of allelic imbalance in SAM/ORE
“hybrids.”This approach is similar to RNA-seq, but the cDNA is treated with a restriction enzyme (NlaIII) during library preparation, causing all sequence reads to begin at a restric-tion site. Wefirst generated both mutant and wild-type F1
hybrids by crossing SAMwsdE3flies to OREwsdE3flies. We dissected wing discs from wandering third instar larvae and pooled200 wing discs to generate each sample. We gener-ated two biological replicates each of both wild-type and mutant hybridflies. We extracted total RNA using an Ambion MagMax-96 kit (Life Technologies) following the manufac-turer’s instructions. Further processing was performed at the Michigan State University Research Technology Support
Facility, where samples were sequenced on an Illumina Ge-nome Analyzer. After qualityfiltering, we obtained 7.6 to 8.1 million single-end, 17-bp reads from each sample.
We appended theNlaIII restriction site recognition sequence to the start of each sequence read and mapped sequence tags (unique reads) to the consensus ORE and SAM transcriptome sequences using BWA, allowing up to two mismatches (11%) per sequence. Sequences that mapped equally well to multiple genes were discarded from further analyses. All sequences that mapped to a single coding gene were included in analyses comparing wild-type flies to mutant flies. All sequence tags mapping to a single coding gene specifically in SAM or ORE were used in analyses of allelic imbalance. In cases in which either the SAM or ORE allele was missing from the sequence reads (i.e., only one of the two alleles was transcribed), we examined the SAM and ORE genome sequences to check for mutations in the NlaIII restriction sequence, because such a mutation would cause the mutation-bearing allele to be absent from our dataset even if it was being expressed. These cases were excluded from analyses of allelic imbalance.
To identify genes that are differentially regulated between wild-type and sdE3mutantflies, we used the edgeR Biocon-ductor package for R v. 3.0.8 (Robinsonet al.2010), using the exactTest function, after estimating tagwise dispersions; all mapped reads were included in this analysis. We then com-putedq-values using the qvalue library (Storey and Tibshirani 2003). To test for allelic imbalance in genes in which se-quence tags could be confidently assigned to either SAM or ORE, we compared binomial models using likelihood ratio tests. The null model assumed an equal probability (0.5) of a sequence read being derived from either SAM or ORE. The first alternative model allowed that probability to differ from 0.5, but was constrained to be the same in both wild-type and mutant flies. To identify genes in which the sdE3mutation alters the level of allelic imbalance, we also tested a second alternative model, in which the probability that a given se-quence read was derived from SAM or ORE differed between wild-type and mutantflies.
Microarrays
background, and their interaction asfixed effects, and array as a random effect, using the lmer function in R. For the Illumina dataset, we again log transformed and normalized the data, andfitted linear models (using the lm function), with geno-type, background, and their interaction as predictor variables.
Modifier mapping
We examined results from a prior study that screened two large autosomal deletion libraries (Exelixis and DrosDel) for domi-nant, background-dependent modifiers of thesdE3phenotype. Details are published elsewhere (Chari and Dworkin 2013). Briefly, we crossed males carrying each deletion to be tested to females carrying the sdE3allele in either the SAM or ORE background. We analyzed the wing phenotypes of the male offspring, which were hemizygous for sdE3, heterozygous for the deletion of interest, and heterozygous for one of the two backgrounds (Figure S4). As a control, we crossed SAM and OREflies to the progenitor strains used to generate the deletion lines. We then scored wing phenotypes using a semiquantitative scale (1–10) (Chari and Dworkin 2013; Tanaka 1960), and used linear models to test for effects of each deletion, the genetic background, and their interaction on the wing pheno-type. Deletions showing a significant interaction term were considered background-dependent modifiers. The raw data for the modifier mapping and for the subset of deletions used for the backcross selection can be obtained from the Dryad Digital Repository (http://dx.doi.org/10.5061/dryad.4dt7c).
Gene ontology analyses
Using the sets of candidate genes from the expression, deletion modifier screen, binding site analysis, and mapping data, we tested for overrepresentation of gene ontology categories using WebGestalt (Wanget al.2013a) with the enrichment test tool. We performed analyses for individual datasets (using the appropriate reference gene list), as well as a combined anal-ysis in which candidate genes were identified by searching for genes showing a congruent signal across multiple data-sets (with the full EnsemblDrosophilagene list as the refer-ence). We used a Benjamini–Hochberg false discovery rate, with a minimum of three genes per category. Given that for many genes we had only partial information (e.g., for some genes we had no or incomplete expression data, while for genes on the X chromosome, we had no modifier data) this list is incomplete. However, it still provides a useful view of the types of genes represented and whether different subsets of biological processes are affected by the main genotypic effects of thesdE3allele and by its interactions with other loci. We also verified our results using the BioProfiling.de tool (Antonov 2011), which is a superset of the analysis done by WebGestalt.
Results
Backcross mapping identifies genomic regions contributing to variation in the sdE3phenotype
While the wings of the wild-type SAM and ORE flies are qualitatively similar, the effects of the sdE3mutation differ
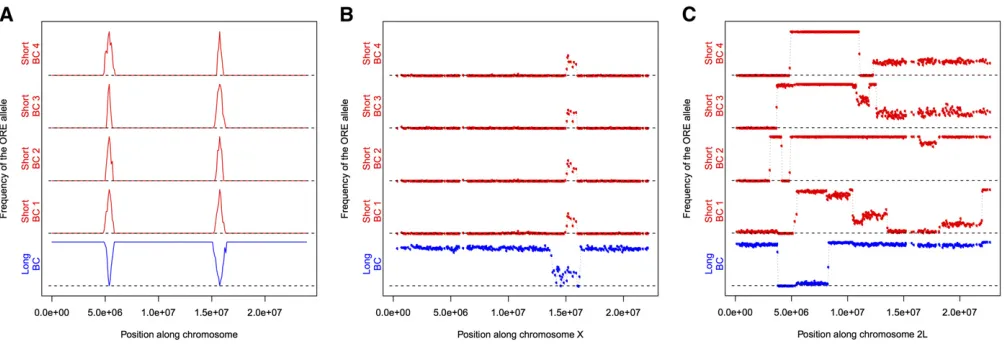
dramatically in each background (Figure 1). To identify regions of the genome associated with the long- and short-wing sdE3 phenotypes, we backcrossed SAM or ORE sdE3flies to the al-ternate background while selecting for short- and long-wing phenotypes, respectively, each generation (Figure 2). Back-crossing was repeated for 12 cycles (24 generations) for the short- and 20 cycles (40 generations) for the long-wing backcrosses. This procedure is expected to introgress the ORE alleles that contribute to a short-wing phenotype into an otherwise SAM background, and vice versa. After back-crossing, we obtained one long-wing and four short-wing lin-eages phenotypically similar tosdE3in the pure SAM and ORE wild-type backgrounds (Figure 3), despite a predicted.95% replacement of the genetic background (Figure 4A).
To identify genomic regions harboring polymorphisms mo-dulating genetic background effects, we used whole-genome resequencing of the parental and backcross strains to identify which genomic regions introgressed. While there were.504,000 putative polymorphisms identified between the ORE, SAM, and the reference genome, we utilized only 92,006 SNPs that met our criteria (seeMaterials and Methods). We observed several regions that introgressed repeatedly in the short-wing backcross lines, with sizes ranging from just a few kilobases, up to 5 Mb (Figure 4B,Figure S1). A large portion of chro-mosome arm 3R introgressed, overlapping with several background-dependent modifier deletions of the sdE3 phe-notype. There were several additional regions, all of smaller sizes, on chromosome arm 3L that also consistently intro-gressed. Nearly 75% of the left half of chromosome arm 2R introgressed in some backcross lines, and5 Mb of chromo-some 2L also introgressed across all short backcross lines, although each with clearly distinct recombination breakpoints. Several regions were less consistent. For instance, while a por-tion of chromosome arm 2L introgressed repeatedly, the break-points around the introgressed region were variable among lines (Figure 4B,Figure S1), with one replicate line exhibiting
Figure 1 Phenotypic effects of the sdE3 mutation on the Drosophila
melanogasterwing in the Oregon-R (ORE) and Samarkand (SAM) genetic
nearly complete introgression of the entire chromosome arm.
In the long-wing backcross line, we expected the opposite genomic pattern from the short-wing lines, i.e., mostly ORE alleles, except where long-wing SAM alleles had introgressed. We identified only a few regions exhibiting this pattern (Fig-ure 4,Figure S1), some of which corresponded to the intro-gression regions for the short-wing backcross lines: one on the left half of chromosome arm 2L, one on the left half of 2R, one on 3L, and one on 3R. Surprisingly, in some regions where an ORE segment had introgressed into an otherwise SAM chromosome in the short-wing backcross lines, the same allelic distribution was observed in the long-wing backcross line, rather than the opposite pattern as expected for back-ground modifiers of thesdE3phenotype,e.g., a small region near the right end of 3R (Figure 4,Figure S1).
Strain-specific polymorphisms in predicted SD binding sites weakly correlate to differences in gene expression
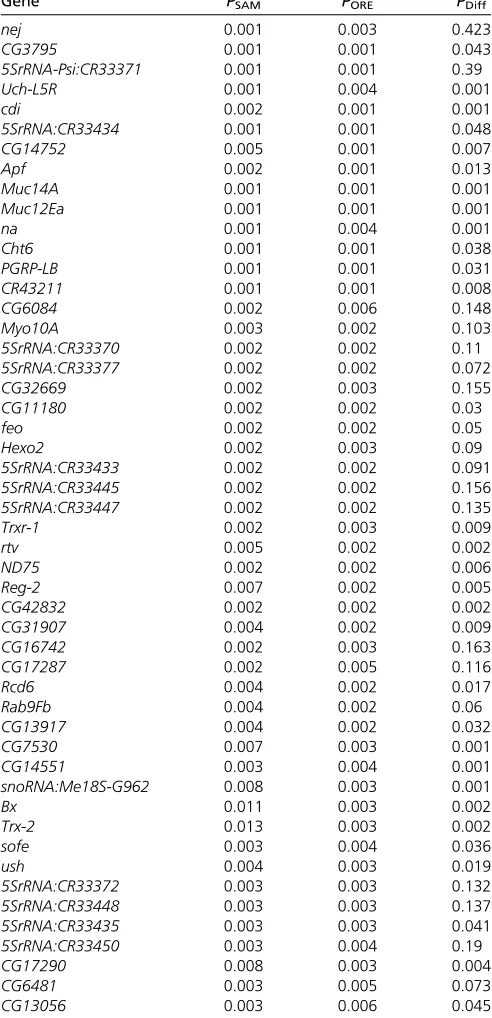
To identify putative polymorphic SD transcription factor bi-nding sites that may contribute to the background-dependent effects of thesdE3mutation on gene expression, we searched our resequenced SAM and ORE genomes with MotifScan v6 (Kim et al. 2010) for predicted SD targets. Using the LLR scores generated by MotifScan, we computed an empirical P-value for each gene by comparing its LLR score to the LLR scores of 1000 genes most similar in GC content (see Mate-rials and Methods for details). A total of 163 genes were predicted to be targets of regulation by SD (P # 0.01 in either SAM or ORE; Table 1; see Dryad doi:10.5061/ dryad.1375s for full results). Of these, 131 were common to both genetic backgrounds, 16 were SAM specific, and 16 were ORE specific. Genes predicted to be SD targets in at least one of the two backgrounds showed significant overlap
with genes identified as being misexpressed in sdE3 flies in one of three gene expression datasets (the DGRC dataset; see Integrating multiple datasets generates a robust set of candidate locibelow); however, the degree of overlap was not especially strong (using a more relaxed significance threshold to in-crease the total strength of the signal in the data, observed overlap = 16 genes of 10,380 common to both datasets, of which 146 were differentially expressed in DGRC atq#0.05 and 535 were significant in the binding prediction analysis at P#0.05;P= 0.004 in a randomization test).
In addition, we also searched for genes that showed evidence of differential affinity for SD between the SAM and ORE genomes by identifying genes with exceptional differ-ences in LLR scores computed using the SAM and ORE sequences, regardless of whether or not the gene was predicted to be a significant SD target in ourfirst analysis. Using this method, we identified 149 genes predicted to show differential affinity for SD (P#0.01), although only 37 of these were predicted to be significant SD binding tar-gets (P#0.01).
We also manually checked two experimentally verified SD binding sites (Gusset al.2001; Halder and Carroll 2001) for polymorphisms. The genes regulated by both of these binding sites were predicted to be SD binding targets by our analyses (cut: P = 0.018 in SAM and P = 0.022 in ORE; salm: P = 0.026 in SAM and P = 0.023 in ORE), but neither was predicted to show differential affinity for SD binding. There was no evidence of substitutions in the SD binding site that regulates cut expression (Table S3). However, ORE (but not SAM) showed evidence of three substitutions in the known SD binding site that regulates salm (Table S4).salmwas one gene that was verified (via in situhybridization) to be differentially expressed between SAMsdE3and OREsdE3(Dworkinet al.2009).
Figure 2Backcross selection strat-egy used to introgress alleles from one background into another. The sdE3 allele (insertion denoted by gray triangle) was originally back-crossed into both the Samarkand background (blue) with the rela-tively less severe phenotype and Oregon-R (red) with higher expres-sivity (top row). The light blue ge-nomic fragment proximal to the sdE3allele represents the genomic region from the original genetic background thatsdE3was gener-ated on (neither SAM nor ORE), while the gray coloration in gener-ation three and beyond indicates unknown chromosomal composi-tion due to recombinacomposi-tion between the SAM and ORE chromosomes in previous generations. The two-gen-eration cycle consisted of generat-ing F2’s and selectingflies with the
Allelic imbalance in gene expression is unlikely to contribute to the phenotypic effects of
genetic background
We generated DGE data—sequences from short mRNA tags (cleaved by a restriction enzyme)—in SAM/ORE hybridflies with both wild-type (ORE sd+/SAM sd+) and sdE3 (ORE sdE3/SAMsdE3) genotypes. We used this to identify (i) genes that are misregulated in the presence of thesdE3mutation; (ii) genes showing evidence of allelic imbalance,i.e., unequal transcription of the SAM and ORE alleles of the same gene; and (iii) genes showing evidence of genotype-dependent al-lelic imbalance.
A total of 59,057 mappable unique sequence tags represent-ing 11,267 transcripts from 10,312 genes were identified. Of these, 2,078 sequence tags representing 1,639 genes displayed significantly different expression levels between wild-type and sdE3flies at a threshold ofq#0.001. This set of differentially expressed genes contained a disproportionate number of genes annotated as being involved in spindle organization and mitotic spindle organization, microtubule cytoskeleton organization, spindle elongation and mitotic spindle elongation, and gene expression, among others (Figure S2,Table S5).
Because DGE was performed in SAM/ORE hybrid flies, we also wanted to test for allelic imbalance,i.e., differential expression of the two copies of a gene within an individual. There were 2583 mappable unique sequence tags represent-ing 1970 transcripts and 1937 genes for which we could distinguish between the SAM and ORE alleles. Of those, 392 tags representing 378 genes showed evidence of allelic imbalance at a threshold of q #0.001 (Table S6). Genes showing evidence of allelic imbalance were not enriched for any Gene Ontology (GO) categories after adjustment for multiple comparisons.
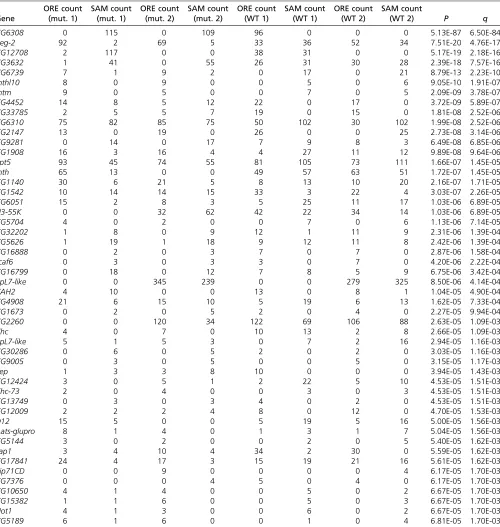
We identified 29 genes showing evidence of a difference in the level of allelic imbalance between wild-typeflies and sdE3mutantflies (q#0.001; Table 2). There was no more overlap than expected by chance between these genes and genes showing evidence of differences in SD binding affinity between SAM and ORE (P = 0.52 using a randomization test, again with a more liberal significance cutoff; observed
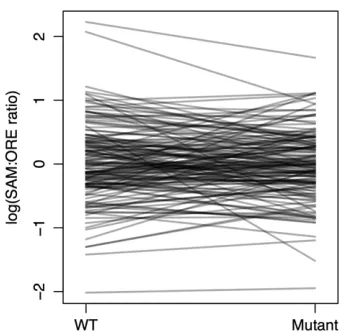
overlap = 11 genes of 1063 common to both datasets, of which 156 were significant in the DGE dataset atP#0.01 and 71 were significant in the binding prediction dataset at P # 0.05). Similarly, these genes did not show any more overlap than expected by chance with the genes showing evidence of a genotype-by-background interaction influencing expression levels in either of two previously published micro-array datasets (P= 0.11 andP= 0.93). Consideringsd geno-types separately, 337 genes showed evidence of allelic imbalance in wild-typeflies (at the same threshold), and 146 genes showed evidence of allelic imbalance insdE3flies, with 26 of these genes overlapping (all atq#0.001). Again, GO terms showed no significant enrichment after correction for multiple comparisons. Lastly, there did not seem to be any overall, con-sistent bias toward the expression of one background’s alleles or any consistent change in allelic imbalance between wild-type and mutant flies (Figure 5, Figure S3). Thus, despite some evidence of allelic imbalance, it does not appear to correlate well with other features of the background dependence. Whether this is a function of the underlying biology or the limited representation of the short sequence tags (limiting our ability to discern RNA from each parental allele) is unclear.
The majority of background-dependent genetic interactions with sdE3cannot be explained by
quantitative noncomplementation across the wild-type strains
A previous deletion screen for dominant modifiers of the sdE3phenotype showed that the majority of observed modi-fiers display background dependence (Chari and Dworkin 2013). That is, most deletions that alter thesdE3phenotype do so differently when expressed in the SAM and ORE ge-netic backgrounds. However, that study was unable to dis-tinguish between two competing hypotheses to explain this result. Thefirst is quantitative noncomplementation,i.e., second-order epistasis between thesdE3allele and the hemizygous back-ground allele uncovered by the deletion (Palsson and Gibson 2000; Mackayet al.2005). Alternatively, background-dependent modifiers may be explained by third-order (or higher) epistasis between thesdE3allele, the deletion itself, and one or more
genetic background alleles elsewhere in the genome. To eval-uate these hypotheses, we used data from crosses between 31 deletions showing background-dependent effects to the short-and long-wing introgression lines (Figure 2,Figure S4). If the modifier deletion’s background dependence is due to quanti-tative noncomplementation, then the wing phenotype will depend on the genetic background (SAM or ORE) the fly carries across from the deletion. On the other hand, if this background dependence is due to higher-order epistasis, the phenotype will also depend on alleles present at other loca-tions in the genome, not just alleles uncovered by the deletion. We can therefore test for quantitative noncomplementation by comparing the genotypes and phenotypes of flies carrying a deletion of interest and thesdE3mutation in (i) a pure SAM or ORE parental background,vs.(ii) an introgression background. Specifically, ifflies from these two cases exhibit the same mod-ification of the wing phenotype, but are hemizygous for differ-ent alleles at the deletion locus, then alleles elsewhere in the genome must be influencing how the deletion modifiessdE3’s effects, and we can rule out a “simple” two-way interaction (Figure S4). Similar logic applies for the situation in which the lineages have distinct phenotypes but the same allele oppo-site the deletion. For80% of the deletions tested, at least one cross between a backcross and the deletion provided evidence that second-order epistasis is insufficient to explain the back-ground dependence of the modifier’s effects (Table 3). Thus, the majority of modifier loci are background dependent because of third- or higher-order epistasis between the focal mutation, the modifier, and additional loci elsewhere in the genome.
Integrating multiple datasets generates a robust set of candidate loci
We also took advantage of several additional datasets. First, we used two previously published microarray datasets comparing
gene expression profiles between wild-type andsdE3flies in both the SAM and ORE genetic backgrounds to identify genes whose expression levels are influenced bysdgenotype, ge-netic background, and their interaction (Dworkinet al.2009, 2011). Second, we examined the results of the screen for autosomal dominant modifiers of sdE3 mentioned earlier (Chari and Dworkin 2013).
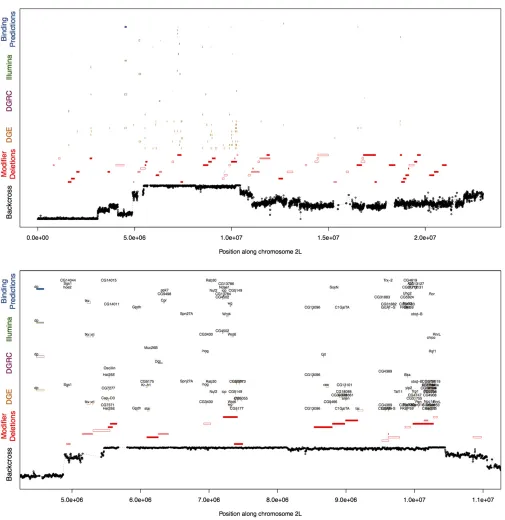
To identify candidate genes for further study, we searched for genes displaying a common signal in multiple datasets: (i) those falling within a region showing evidence of introgres-sion in the short-wing backcross lines; (ii) genes occurring within modifier deletions or background-dependent modifier deletions; (iii) differentially expressed genes in the micro-array and DGE datasets (specifically, genes whose transcript levels were influenced bysdgenotype, a by-back-ground interaction in the microarray datasets, or genotype-dependent allelic imbalance in the DGE dataset); (iv) genes predicted to show differential affinity for SD binding between SAM and ORE. Because significant but incongruent effects in independent expression datasets (e.g., up-regulation insdE3 flies in one dataset, and down-regulation in another dataset) could be a cause for concern, we also“flagged”genes show-ing evidence of such inconsistency. We then plotted all of these sources of data on a common set of axes (Figure 6, Figure S5) and selected a set of robust candidates supported by multiple independent data types, including multiple ex-pression datasets. At this stage, we used liberal cutoffs to identify “significant” genes (q , 0.05 for most datasets; P,0.05 for SD binding and the Illumina microarray dataset; and short-wing allele frequency $0.6 for the mapping-by-introgression dataset), because we were interested only in those genes showing a consistent signal across multiple datasets.
By integrating all these results, we generated a set of
“high confidence”candidates (Table 4) that mediate or are modulated by either the effect of genotype (sdE3 vs. wild type) or an interaction between genotype and wild-type ge-netic background. Not surprisingly, some well-known genes that interact with or are regulated by SD, such asvg,bi/Omb, fj, Dll, and chico, are found among these candidates. More
generally we observed overrepresentation of genes involved withDrosophilawing development (Figure S6) for both the main and background-dependent interaction effects. There was also modest enrichment of microtubule-associated genes for genotypic effects, and RAS GTPases and intracellular membrane-bounded organelle genes for the interaction effects, although it is currently unclear whether these distinctions re-flect a true difference among the types of gene products that mediate background dependence.
Discussion
The genomic context in which an allele finds itself can profoundly influence that allele’s phenotypic consequences. Here, we have integrated genomic data from multiple experi-ments to examine how that context modulates the phenotypic effects of a specific mutation, the scallopedE3allele, on the D. melanogasterwing. Although these datasets did not always yield a congruent signal, we were able to identify several strong candidate regions likely to be involved in mediating the background dependence of this allele’s effects on wing development. Importantly, each dataset in isolation yielded a large set of candidates; only by examining these disparate sources together were we able to identify a robust and prac-tical set of candidates for more focused study.
Mapping by introgression
Using introgression to map the polymorphisms responsible for modulatingsdE3’s consequences on wing phenotypes points to a complex genetic basis for this background dependence. However, pinning this background dependence on specific polymorphisms or even specific regions is complicated by sev-eral difficulties. First, large chromosomal blocks introgressed in many cases, each containing many genes. One possible explanation for this result is selection for multiple linked alleles, which would drag the entire segment tofixation, es-sentially building a long large-effect quantitative trait locus out of many smaller ones. In this case, additional crosses to generate recombination events within these regions may prove fruitful in pinpointing the polymorphisms responsible forsdE3’s background-dependent effects.
An alternative, but not necessarily mutually exclusive, explanation is that the causal polymorphisms lie within poly-morphic inversions, suppressing recombination within these blocks. A related and intriguing hypothesis is that rearrange-ments themselves may be responsible for the background dependence, making it not only impossible but also illogical to map the background modifiers to individual SNPs. By looking for sequence read pairs that mapped to discordant genomic positions, we found little evidence that inversions relative to the referenceD. melanogastergenome are present in these regions, as each putative inversion is supported by only a few discordant read pairs, there are multiple confl ict-ing inversions within each strain, and few putative inversions appear polymorphic between SAM and ORE (Figure S7). We
Table 1 Top 50 genes predicted to be targets of regulation by SD in the SAM and ORE genetic backgrounds
Gene PSAM PORE PDiff
nej 0.001 0.003 0.423
CG3795 0.001 0.001 0.043
5SrRNA-Psi:CR33371 0.001 0.001 0.39
Uch-L5R 0.001 0.004 0.001
cdi 0.002 0.001 0.001
5SrRNA:CR33434 0.001 0.001 0.048
CG14752 0.005 0.001 0.007
Apf 0.002 0.001 0.013
Muc14A 0.001 0.001 0.001
Muc12Ea 0.001 0.001 0.001
na 0.001 0.004 0.001
Cht6 0.001 0.001 0.038
PGRP-LB 0.001 0.001 0.031
CR43211 0.001 0.001 0.008
CG6084 0.002 0.006 0.148
Myo10A 0.003 0.002 0.103
5SrRNA:CR33370 0.002 0.002 0.11
5SrRNA:CR33377 0.002 0.002 0.072
CG32669 0.002 0.003 0.155
CG11180 0.002 0.002 0.03
feo 0.002 0.002 0.05
Hexo2 0.002 0.003 0.09
5SrRNA:CR33433 0.002 0.002 0.091
5SrRNA:CR33445 0.002 0.002 0.156
5SrRNA:CR33447 0.002 0.002 0.135
Trxr-1 0.002 0.003 0.009
rtv 0.005 0.002 0.002
ND75 0.002 0.002 0.006
Reg-2 0.007 0.002 0.005
CG42832 0.002 0.002 0.002
CG31907 0.004 0.002 0.009
CG16742 0.002 0.003 0.163
CG17287 0.002 0.005 0.116
Rcd6 0.004 0.002 0.017
Rab9Fb 0.004 0.002 0.06
CG13917 0.004 0.002 0.032
CG7530 0.007 0.003 0.001
CG14551 0.003 0.004 0.001
snoRNA:Me18S-G962 0.008 0.003 0.001
Bx 0.011 0.003 0.002
Trx-2 0.013 0.003 0.002
sofe 0.003 0.004 0.036
ush 0.004 0.003 0.019
5SrRNA:CR33372 0.003 0.003 0.132
5SrRNA:CR33448 0.003 0.003 0.137
5SrRNA:CR33435 0.003 0.003 0.041
5SrRNA:CR33450 0.003 0.004 0.19
CG17290 0.008 0.003 0.004
CG6481 0.003 0.005 0.073
CG13056 0.003 0.006 0.045
therefore think this hypothesis is unlikely to explain the large introgression blocks.
In a few instances, the same allele becamefixed in both short- and long-winged backcross lines, even though alternate alleles were expected to be selected in these contrasting treatments. These loci may have been influenced by unintended selection for alleles influencing viability, rather than for wing phenotypes. Indeed, such unanticipated genetic effects have
been observed in other studies (e.g., Seidelet al.2008; Ross et al. 2011; King et al. 2012). Moreover, there was some inconsistency among introgression lines. We therefore pro-pose that studies intending to map trait variation using an introgression-and-resequencing approach (e.g., Earley and Jones 2011) must include reciprocal crosses and multiple replicates. A single replicate of this introgression in only a single direction, for instance, would have missed some introgression
Table 2 Genes showing evidence of genotype-dependent allelic imbalance in SAM/ORE“hybrid”wild-type andsdE3mutantflies
Gene
ORE count (mut. 1)
SAM count (mut. 1)
ORE count (mut. 2)
SAM count (mut. 2)
ORE count (WT 1)
SAM count (WT 1)
ORE count (WT 2)
SAM count
(WT 2) P q
CG6308 0 115 0 109 96 0 0 0 5.13E-87 6.50E-84
Reg-2 92 2 69 5 33 36 52 34 7.51E-20 4.76E-17
CG12708 2 117 0 0 38 31 0 0 5.17E-19 2.18E-16
CG3632 1 41 0 55 26 31 30 28 2.39E-18 7.57E-16
CG6739 7 1 9 2 0 17 0 21 8.79E-13 2.23E-10
mthl10 8 0 9 0 0 5 0 6 9.05E-10 1.91E-07
mtm 9 0 5 0 0 7 0 5 2.09E-09 3.78E-07
CG4452 14 8 5 12 22 0 17 0 3.72E-09 5.89E-07
CG33785 2 5 5 7 19 0 15 0 1.81E-08 2.52E-06
CG6310 75 82 85 75 50 102 30 102 1.99E-08 2.52E-06
CG2147 13 0 19 0 26 0 0 25 2.73E-08 3.14E-06
CG9281 0 14 0 17 7 9 8 3 6.49E-08 6.85E-06
CG1908 16 3 16 4 4 27 11 12 9.89E-08 9.64E-06
Spt5 93 45 74 55 81 105 73 111 1.66E-07 1.45E-05
mth 65 13 0 0 49 57 63 51 1.72E-07 1.45E-05
CG1140 30 6 21 5 8 13 10 20 2.16E-07 1.71E-05
CG1542 10 14 14 15 33 3 22 4 3.03E-07 2.26E-05
CG6051 15 2 8 3 5 25 11 17 1.03E-06 6.89E-05
U3-55K 0 0 32 62 42 22 34 14 1.03E-06 6.89E-05
CG5704 4 0 2 0 0 7 0 6 1.13E-06 7.14E-05
CG32202 1 8 0 9 12 1 11 9 2.31E-06 1.39E-04
CG5626 1 19 1 18 9 12 11 8 2.42E-06 1.39E-04
CG16888 0 2 0 3 7 0 7 0 2.87E-06 1.58E-04
scaf6 0 3 0 3 3 0 7 0 4.20E-06 2.22E-04
CG16799 0 18 0 12 7 8 5 9 6.75E-06 3.42E-04
RpL7-like 0 0 345 239 0 0 279 325 8.50E-06 4.14E-04
CAH2 4 10 0 0 13 0 8 1 1.04E-05 4.90E-04
CG4908 21 6 15 10 5 19 6 13 1.62E-05 7.33E-04
CG1673 0 2 0 5 2 0 4 0 2.27E-05 9.94E-04
CG2260 0 0 120 34 122 69 106 88 2.63E-05 1.09E-03
Chc 4 0 7 0 10 13 2 8 2.66E-05 1.09E-03
RpL7-like 5 1 5 3 0 7 2 16 2.94E-05 1.16E-03
CG30286 0 6 0 5 2 0 2 0 3.03E-05 1.16E-03
CG9005 0 3 0 5 0 0 5 0 3.15E-05 1.17E-03
Pep 1 3 3 8 10 0 0 0 3.94E-05 1.43E-03
CG12424 3 0 5 1 2 22 5 10 4.53E-05 1.51E-03
Khc-73 2 0 4 0 0 3 0 3 4.53E-05 1.51E-03
CG13749 0 3 0 3 4 0 2 0 4.53E-05 1.51E-03
CG12009 2 2 2 4 8 0 12 0 4.70E-05 1.53E-03
D12 15 5 0 0 5 19 5 16 5.00E-05 1.56E-03
Aats-glupro 8 1 4 0 1 3 1 7 5.04E-05 1.56E-03
CG5144 3 0 2 0 0 2 0 5 5.40E-05 1.62E-03
Lap1 3 4 10 4 34 2 30 0 5.59E-05 1.62E-03
CG17841 24 4 17 3 15 19 21 16 5.61E-05 1.62E-03
Eip71CD 0 0 9 0 0 0 0 4 6.17E-05 1.70E-03
CG7376 0 0 0 4 5 0 4 0 6.17E-05 1.70E-03
CG10650 4 1 4 0 0 5 0 2 6.67E-05 1.70E-03
CG15382 1 1 6 0 0 5 0 3 6.67E-05 1.70E-03
Not1 4 1 3 0 0 6 0 2 6.67E-05 1.70E-03
CG5189 6 1 6 0 0 1 0 4 6.81E-05 1.70E-03
regions, and some of the identified regions of introgression may have more to do with viability than with the trait of interest.
It is clear that multiple loci are involved, and problems generating multiple replicates of the long-winged backcross line (not shown) may indicate complex epistatic interactions between these loci. Although widely used with great success for Mendelian traits, the mapping-by-introgression approach adopted in thefirst part of our study may not be well suited to mapping trait variation with such a complex genetic basis. Nevertheless, in conjunction with the results of additional experiments such as gene expression data, this approach can still provide useful information that helps identify candidate genes for further investigation.
Majority of background-dependent modifiers cannot be explained by quantitative noncomplementation
An earlier study showed that the majority of thesdE3allele’s modifiers have effects that are background dependent (Chari and Dworkin 2013). Here, we extend that finding by providing evidence that these modifiers’background de-pendence is, in most cases, due to higher-order epistasis— interactions between the focal mutation (in this case,sdE3), the modifier itself (in this case, a deletion), and alleles elsewhere in the genome. This finding is consistent with growing evidence that higher-order epistasis is prevalent (Weinreich et al.2013) and that what may initially seem to be a two-way interaction is often a more complex inter-action involving additional loci or environmental influences (Whitlock and Bourguet 2000; Gerkeet al.2010; Wanget al. 2013b; Lali´c and Elena 2013). To our knowledge this is the first attempt at combining such genetic and genomic data to infer the order of epistatic interactions (or at least to rule out lower-order interactions). While this approach can only be used for genetically and genomically tractable systems, it does allow for making a clear inference even in the absence of the exact identity of some of the interacting partners.
Prior results are consistent with the hypothesis that the background loci altering interactions between sdE3 and its modifiers are the same as those mediating the background dependence of sdE3itself (Chari and Dworkin 2013). Thus, identifying the latter should provide insights into the former, and further experiments can shed light on the precise nature of these interactions.
Binding site analyses
Using the whole-genome sequence data for SAM and ORE, we identified a large number of predicted SD binding sites. More relevant for this study, we also identified a moderate number of genes whose regulatory elements are predicted to bind SD differentially between the SAM and ORE genetic backgrounds. Nearly all of these await experimental valida-tion. In addition, binding predictions were only weakly correlated with expression differences. This result should not be too surprising, as the set of genes whose expression changes in the presence of thesdE3mutation includes both direct and indirect targets of SD. Nevertheless, two vali-dated targets of SD binding were picked by our approach as predicted targets of SD regulation. While one of these was manually found to contain three polymorphisms in the SD binding site, this differential SD binding affinity was missed by our analysis. Moreover, while exploring different binding site prediction methods, we also found that results were highly dependent upon the approach used as well as on the choice of specific position weight matrix (not shown).
Combined, these observations suggest that current binding site prediction approaches may not be specific or sensitive enough to produce completely reliable sets of candidate regulation targets on their own. Even so, they still seem to possess enough predictive power that, when combined with other sources of data, they can strengthen the evidence for the involvement of some genes in a biological process of interest. For instance, several of the candidate genes that were already strongly supported by other sources of data were also predicted to be SD binding targets or to possess polymorphic SD binding sites (Table 4).
Gene expression
Though the direction of effects was mostly consistent, the same genes were not always identified as significant in independent expression datasets. These differences may be explained by the unique technologies used with different biases, as well as distinct experimental designs. For exam-ple, the DGE experiment could only measure the abundance of transcripts containing the restriction sequence (CATG), may have been subject to biases in mapping reads to the reference genome, and our ability to detect background-dependent expression was contingent on the presence of SNPs in our sequence reads derived from SAM-ORE hybrid flies. The microarray datasets, on the other hand, used only flies with either a pure SAM or ORE background, and each array could only measure the expression of the specific transcripts complementary to the arrays’probes, which may
also have been influenced by polymorphisms between the SAM and ORE sequences and the probe sequences.
Allelic imbalance
There was very little overlap between genes showing evidence of allelic imbalance in SAM/ORE hybridflies, genes showing evidence of background-dependent expression levels in pure SAM and ORE flies, and genes containing polymorphic predictedscallopedbinding sites. The lack of overlap between the first two sets of genes is not surprising, because allelic imbalance must be due to cis-regulatory variation, whereas expression differences between pure SAM and OREflies may be due to eithercis- ortrans-regulatory differences. Moreover, our ability to detect allelic imbalance in the DGE dataset was limited by our ability to identify SNPs in our relatively short sequence tags, and by a lack of statistical power for low-abundance transcripts. The comparison between genes show-ing allelic imbalance and genes predicted to have polymorphic SD binding sites is further hindered by imperfect binding site predictions, and because TFBS can reside quite far from the gene they regulate. The lack of strong congruence between these datasets is therefore also unsurprising.
Interestingly, a large proportion of genes displaying evidence of allelic imbalance showed differences between the wild-type and mutant genotypes: many of the genes showing evidence of allelic imbalance in wild-type flies did not show allelic imbalance in mutantflies, and vice versa (Figure 5,Figure S3). Nevertheless, there did not appear to be any consistent bias in the expression of one background’s alleles over the other, nor did there to appear to be any change in the overall degree of allelic imbalance between wild-type andsdE3flies (Figure 5, Figure S3). The latter finding is somewhat sur-prising, given that we might expect reduced SD levels insdE3 flies to minimize the impact of polymorphic SD binding sites on the expression of SD target genes. However, this analysis was also limited by small sample size; we only had poly-morphic sequence tags for a handful of genes, and many of these were expressed at low levels. Larger-scale RNA-seq experiments with longer reads capable of distinguishing alleles will be able to shed more light on this matter. Combined, though, the overall picture that emerges from the binding site
and allelic imbalance analyses suggests that cis-regulatory variants between SAM and ORE contribute little to the back-ground dependence of the sdE3phenotype, and that varia-tion intrans-acting factors may be more important.
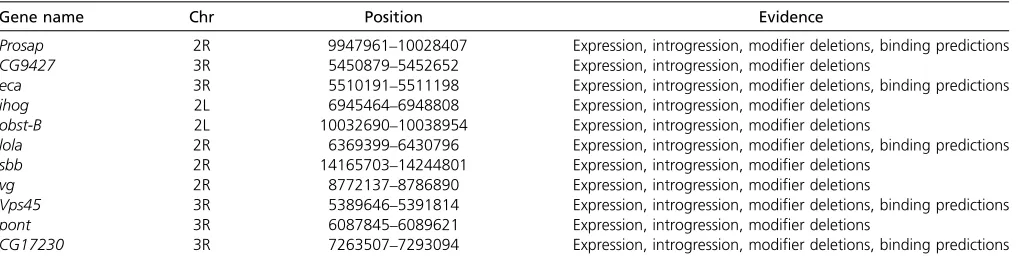
Candidate genes
We identified several loci for further study (Table 4). This list contains a number of genes for which a role in wing phenotypes is logical based on prior evidence (e.g.,vg,sbb, bi/Omb,dlg1,ban), suggesting that our approach is select-ing a reasonable list of candidate genes. The presence of several genes with little or no experimental evidence for a function in wing development (e.g., msk, obst-B) shows that this strategy is also capable of detecting novel candi-dates. This is a key point if our goal is to develop a detailed, unbiased picture of the genetic networks underlying pheno-typic variation.
Conclusions
The genetic basis of variation in the penetrance and expressivity of mutations is likely to be complex. Dissecting the genetic basis of this background dependence will require an integrative approach, because precisely mapping alleles with small quan-titative effects is difficult, even in well-developed model species like D. melanogaster. Drawing on data from multiple experi-ments with distinct approaches, we have identified a robust set of candidate genes for further investigation as possible fac-tors underlying the background dependence of scallopedE3’s variable phenotypic effects on theD. melanogaster wing. This approach should prove useful in understanding how genetic background interacts with specific mutations to influence or-ganismal phenotypes.
Acknowledgments
We thank Casey Bergman, Titus Brown, and Greg Gibson for valuable discussions on analyses and for helpful suggestions on earlier versions of this manuscript. This work was supported by National Science Foundation (NSF) MCB-0922344 (to I.D.). This material is based in part upon work
Table 4 Candidate genes identified by integrative analysis of gene expression, sequence binding predictions, and mapping and modifier datasets
Gene name Chr Position Evidence
Prosap 2R 9947961–10028407 Expression, introgression, modifier deletions, binding predictions
CG9427 3R 5450879–5452652 Expression, introgression, modifier deletions
eca 3R 5510191–5511198 Expression, introgression, modifier deletions, binding predictions
ihog 2L 6945464–6948808 Expression, introgression, modifier deletions
obst-B 2L 10032690–10038954 Expression, introgression, modifier deletions
lola 2R 6369399–6430796 Expression, introgression, modifier deletions, binding predictions
sbb 2R 14165703–14244801 Expression, introgression, modifier deletions
vg 2R 8772137–8786890 Expression, introgression, modifier deletions
Vps45 3R 5389646–5391814 Expression, introgression, modifier deletions, binding predictions
pont 3R 6087845–6089621 Expression, introgression, modifier deletions
supported by the NSF under cooperative agreement no. DBI-0939454. Any opinions, findings, and conclusions or rec-ommendations expressed in this material are those of the author(s) and do not necessarily reflect the views of the National Science Foundation. The authors declare that they have no competing interests.
Literature Cited
Altenburg, E., and H. J. Muller, 1920 The genetic basis of truncate wing,—an inconstant and modifiable character in Drosophila. Genetics 5: 1–59.
Antonov, A. V., 2011 BioProfiling.de: analytical web portal for high-throughput cell biology. Nucleic Acids Res. 39: W323–W327. Atallah, J., I. Dworkin, U. Cheung, A. Greene, B. Inget al., 2004 The
environmental and genetic regulation ofobakeexpressivity: mor-phogeneticfields as evolvable systems. Evol. Dev. 6: 114–122. Bailey, T. L., M. Boden, F. A. Buske, M. Frith, C. E. Grantet al.,
2009 MEME SUITE: tools for motif discovery and searching. Nucleic Acids Res. 37: W202–W208.
Bray, S., 1999 Drosophila development: Scalloped and Vestigial take wing. Curr. Biol. 9: R245–R247.
Burnett, C., S. Valentini, F. Cabreiro, M. Goss, and M. Somogyvári
et al. 2011 Absence of effects ofSir2overexpression on
life-span inC. elegansandDrosophila. Nature 477: 482–485. Cagliero, J., A. Forget, E. Daldello, J. Silber, and A. Zider,
2013 The Hippo kinase promotes Scalloped cytoplasmic locali-zation independently of Warts in a CRM1/Exportin1-dependent manner inDrosophila. FASEB J. 27: 1330–1341.
Campbell, S., M. Inamdar, V. Rodrigues, V. Raghavan, M. Palazzolo
et al., 1992 Thescallopedgene encodes a novel, evolutionarily
conserved transcription factor required for sensory organ differ-entiation inDrosophila. Genes Dev. 6: 367–379.
Cavicchi, S., D. Guerra, V. Natali, G. Giorgi, C. Pezzoli et al., 1989 Developmental effects of modifiers of thevgmutant in
Drosophila melanogaster. Dev. Genet. 10: 386–392.
Chandler, C. H., 2010 Cryptic intraspecific variation in sex deter-mination inCaenorhabditis elegansrevealed by mutations. He-redity 105: 473–482.
Chandler, C. H., S. Chari, and I. Dworkin, 2013 Does your gene need a background check? How genetic background impacts the analysis of mutations, genes, and evolution. Trends Genet. 29: 358–366. Chari, S., and I. Dworkin, 2013 The conditional nature of genetic
interactions: the consequences of wild-type backgrounds on mu-tational interactions in a genome-wide modifier screen. PLoS Genet. 9: e1003661.
Debat, V., A. Debelle, and I. Dworkin, 2009 Plasticity, canalization, and developmental stability of theDrosophilawing: joint effects of muta-tions and developmental temperature. Evolution 63: 2864–2876. Doggett, K., F. A. Grusche, H. E. Richardson, and A. M. Brumby,
2011 Loss of theDrosophila cell polarity regulator Scribbled promotes epithelial tissue overgrowth and cooperation with on-cogenic Ras-Raf through impaired Hippo pathway signaling. BMC Dev. Biol. 11: 57.
Dowell, R. D., O. Ryan, A. Jansen, D. Cheung, S. Agarwalaet al., 2010 Genotype to phenotype: a complex problem. Science 328: 469.
Duveau, F., and M.-A. Félix, 2012 Role of pleiotropy in the evo-lution of a cryptic developmental variation in Caenorhabditis
elegans. PLoS Biol. 10: e1001230.
Dworkin, I., and G. Gibson, 2006 Epidermal growth factor recep-tor and transforming growth facrecep-tor-beta signaling contributes to variation for wing shape in Drosophila melanogaster. Genetics 173: 1417–1431.
Dworkin, I., A. Palsson, K. Birdsall, and G. Gibson, 2003 Evidence thatEgfrcontributes to cryptic genetic variation for photorecep-tor determination in natural populations of Drosophila
mela-nogaster. Curr. Biol. 13: 1888–1893.
Dworkin, I., E. Kennerly, D. Tack, J. Hutchinson, J. Brown et al., 2009 Genomic consequences of background effects on
scal-loped mutant expressivity in the wing of Drosophila
mela-nogaster. Genetics 181: 1065–1076.
Dworkin, I., J. Anderson, Y. Idaghdour, E. Parker, E. Stone et al., 2011 The effects of weak genetic perturbations on the transcrip-tome of the wing imaginal disc, and its association with wing shape inDrosophila melanogaster. Genetics 187: 1171–1184. Earley, E. J., and C. D. Jones, 2011 Next-generation mapping of
complex traits with phenotype-based selection and introgres-sion. Genetics 189: 1203–1209.
Félix, M., 2007 Cryptic quantitative evolution of the vulva intercel-lular signaling network inCaenorhabditis. Curr. Biol. 17: 103–114. Gerke, J., K. Lorenz, S. Ramnarine, and B. Cohen, 2010 Gene-environment interactions at nucleotide resolution. PLoS Genet. 6: e1001144.
Gibson, G., M. Wemple, and S. van Helden, 1999 Potential vari-ance affecting homeoticUltrabithoraxand Antennapedia pheno-types inDrosophila melanogaster. Genetics 151: 1081–1091. Goulev, Y., J. D. Fauny, B. Gonzalez-Marti, D. Flagiello, J. Silber
et al., 2008 SCALLOPED interacts with YORKIE, the nuclear
effector of the hippo tumor-suppressor pathway inDrosophila. Curr. Biol. 18: 435–441.
Guss, K. A., M. Benson, N. Gubitosi, K. Brondell, K. Broadieet al., 2013 Expression and function of scalloped duringDrosophila development. Dev. Dyn. 242: 874–885.
Guss, K. A., C. E. Nelson, A. Hudson, M. E. Kraus, and S. B. Carroll, 2001 Control of a genetic regulatory network by a selector gene. Science 292: 1164–1167.
Halder, G., and S. B. Carroll, 2001 Binding of the Vestigial co-factor switches the DNA-target selectivity of the Scalloped se-lector protein. Development 128: 3295–3305.
Halder, G., P. Polaczyk, M. E. Kraus, A. Hudson, J. Kim et al., 1998 The Vestigial and Scalloped proteins act together to di-rectly regulate wing-specific gene expression in Drosophila. Genes Dev. 12: 3900–3909.
Hofmann, A., A. Keinhorst, A. Krumm, and G. Korge, 1987 Regulatory sequences of the Sgs-4 gene ofDrosophila melanogasteranalysed by P element-mediated transformation. Chromosoma 96: 8–17. Hofmanova, J., 1975 Effect of the genetic background on
recombina-tion frequency in the cn-vgregion of the second chromosome of natural populations ofDrosophila melanogaster. Folia Biol. 21: 50–59. Kim, J., R. Cunningham, B. James, S. Wyder, J. D. Gibson et al., 2010 Functional characterization of transcription factor motifs using cross-species comparison across large evolutionary distan-ces. PLOS Comput. Biol. 6: e1000652.
King, E. G., C. M. Merkes, C. L. McNeil, S. R. Hoofer, S. Senet al., 2012 Genetic dissection of a model complex trait using the
Dro-sophilaSynthetic Population Resource. Genome Res. 22: 1558–1566.
Koontz, L. M., Y. Liu-Chittenden, F. Yin, Y. Zheng, J. Yu et al.,
2013 Thehippoeffectoryorkiecontrols normal tissue growth
by antagonizing scalloped-mediated default repression. Dev. Cell 25: 388–401.
Lali´c, J., and S. F. Elena, 2013 Epistasis between mutations is host-dependent for an RNA virus. Biol. Lett. 9: 20120396. Leips, J., and T. F. C. Mackay, 2002 The complex genetic
archi-tecture ofDrosophilalife span. Exp. Aging Res. 28: 361–390. Li, H., and R. Durbin, 2009 Fast and accurate short read
align-ment with Burrows-Wheeler transform. Bioinformatics 25: 1754–1760.
Processing Subgroup, 2009 The Sequence Alignment/Map for-mat and SAMtools. Bioinforfor-matics 25: 2078–2079.
Lyman, R. F., and T. F. Mackay, 1998 Candidate quantitative trait loci and naturally occurring phenotypic variation for bristle number inDrosophila melanogaster: the Delta-Hairless gene re-gion. Genetics 149: 983–998.
Lyman, R. F., F. Lawrence, S. V. Nuzhdin, and T. F. Mackay, 1996 Effects of single P-element insertions on bristle number and viability inDrosophila melanogaster. Genetics 143: 277–292. Mackay, T. F. C., R. F. Lyman, and F. Lawrence, 2005 Polygenic mutation inDrosophila melanogaster: mapping spontaneous muta-tions affecting sensory bristle number. Genetics 170: 1723–1735. Mackenzie, D. K., L. F. Bussiere, and M. C. Tinsley, 2011 Senescence
of the cellular immune response inDrosophila melanogaster. Exp. Gerontol. 46: 853–859.
McGuigan, K., N. Nishimura, M. Currey, D. Hurwit, and W. A. Cresko, 2011 Cryptic genetic variation and body size evolution in threes-pine stickleback. Evolution 65: 1203–1211.
McKenzie, J. A., M. J. Whitten, and M. A. Adena, 1982 The effect of genetic background on thefitness of diazinon resistance genotypes of the Australian sheep blowfly,Lucilia cuprina. Heredity 49: 1–9. Milloz, J., F. Duveau, I. Nuez, and M.-A. Felix, 2008 Intraspecific evolution of the intercellular signaling network underlying a ro-bust developmental system. Genes Dev. 22: 3064–3075. Morrissy, A. S., R. D. Morin, A. Delaney, T. Zeng, H. McDonaldet al.,
2009 Next-generation tag sequencing for cancer gene expres-sion profiling. Genome Res. 19: 1825–1835.
Nakashima-Tanaka, E., 1967 The effect of temperature and ge-netic background on the phenotypic expression of several Ves-tigial strains ofDrosophila melanogaster. Genetica 38: 447–458. Nicolay, B. N., B. Bayarmagnai, A. B. M. M. K. Islam, N. Lopez-Bigas, and M. V. Frolov, 2011 Cooperation between dE2F1 and Yki/ Sd defines a distinct transcriptional program necessary to bypass cell cycle exit. Genes Dev. 25: 323–335.
Palsson, A., and G. Gibson, 2000 Quantitative developmental ge-netic analysis reveals that the ancestral dipteran wing vein pre-pattern is conserved in Drosophila melanogaster. Dev. Genes Evol. 210: 617–622.
Paumard-Rigal, S., A. Zider, P. Vaudin, and J. Silber, 1998 Specific interactions between vestigial and scalloped are required to pro-mote wing tissue proliferation inDrosophila melanogaster. Dev. Genes Evol. 208: 440–446.
Polaczyk, P. J., R. Gasperini, and G. Gibson, 1998 Naturally oc-curring genetic variation affectsDrosophilaphotoreceptor deter-mination. Dev. Genes Evol. 207: 462–470.
Poon, C. L. C., X. Zhang, J. I. Lin, S. A. Manning, and K. F. Harvey, 2012 Homeodomain-interacting protein kinase regulates Hippo pathway-dependent tissue growth. Curr. Biol. 22: 1587–1594. Ray, A., W. V. D. G. van Naters, and J. R. Carlson, 2008 A
regu-latory code for neuron-specific odor receptor expression. PLoS Biol. 6: e125.
Remold, S. K., and R. E. Lenski, 2004 Pervasive joint influence of epistasis and plasticity on mutational effects inEscherichia coli. Nat. Genet. 36: 423–426.
Ren, F., L. Zhang, and J. Jiang, 2010 Hippo signaling regulates Yorkie nuclear localization and activity through 14–3-3 depen-dent and independepen-dent mechanisms. Dev. Biol. 337: 303–312. Robinson, M. D., D. J. McCarthy, and G. K. Smyth, 2010 edgeR:
a Bioconductor package for differential expression analysis of digital gene expression data. Bioinformatics 26: 139–140. Ross, J. A., D. C. Koboldt, J. E. Staisch, H. M. Chamberlin, B. P.
Guptaet al., 2011 Caenorhabditis briggsaerecombinant inbred line genotypes reveal inter-strain incompatibility and the evolu-tion of recombinaevolu-tion. PLoS Genet. 7: e1002174.
Seidel, H. S., M. V. Rockman, and L. Kruglyak, 2008 Widespread genetic incompatibility in C. elegans maintained by balancing selection. Science 319: 589–594.
Shyamala, B. V., and A. Chopra, 1999 Drosophila melanogaster chemosensory and muscle development: identification and properties of a novel allele of scalloped and of a new locus, SG18.1, in a Gal4 enhancer trap screen. J. Genet. 78: 87–97. Sidor, C. M., R. Brain, and B. J. Thompson, 2013 Mask proteins
are cofactors of Yorkie/YAP in the Hippo pathway. Curr. Biol. 23: 223–228.
Silber, J., 1980 Penetrance of thevestigialgene inDrosophila
mel-anogaster. Genetica 54: 91–99.
Simmonds, A. J., X. Liu, K. H. Soanes, H. M. Krause, K. D. Irvineet al., 1998 Molecular interactions between Vestigial and Scalloped promote wing formation inDrosophila. Genes Dev. 12: 3815–3820. Storey, J. D., and R. Tibshirani, 2003 Statistical significance for genomewide studies. Proc. Natl. Acad. Sci. USA 100: 9440–9445. Tanaka, E., 1960 A study on the difference of temperature re-sponses in several vestigialstrains of Drosophila melanogaster. Jpn. J. Genet. 35: 222–227.
Thompson, J. N., 1975 Studies on the nature and function of poly-genic loci inDrosophila. III. Veinlet modifiers having region-spe-cific effects upon the vein pattern. Genetics 81: 387–402. Threadgill, D. W., A. A. Dlugosz, L. A. Hansen, T. Tennenbaum, U. Lichti
et al., 1995 Targeted disruption of mouse EGF receptor: effect of
genetic background on mutant phenotype. Science 269: 230–234. Vaistij, F. E., Y. Gan, S. Penfield, A. D. Gilday, A. Dave et al.,
2013 Differential control of seed primary dormancy in
Arabi-dopsisecotypes by the transcription factor SPATULA. Proc. Natl.
Acad. Sci. USA 110: 10866–10871.
Varadarajan, S., and K. VijayRaghavan, 1999 scallopedfunctions in a regulatory loop withvestigial andwinglessto pattern the
Drosophilawing. Dev. Genes Evol. 209: 10–17.
Wang, J., D. Duncan, Z. Shi, and B. Zhang, 2013a WEB-based GEne SeT AnaLysis Toolkit (WebGestalt): update 2013. Nucleic Acids Res. 41: W77–W83.
Wang, Y., C. D. Arenas, D. M. Stoebel, and T. F. Cooper, 2013b Genetic background affects epistatic interactions be-tween two beneficial mutations. Biol. Lett. 9: 20120328. Weinreich, D. M., Y. Lan, C. S. Wylie, and R. B. Heckendorn,
2013 Should evolutionary geneticists worry about higher-or-der epistasis? Curr. Opin. Genet. Dev. 23: 700–707.
Whitlock, M. C., and D. Bourguet, 2000 Factors affecting the ge-netic load in Drosophila: synergistic epistasis and correlations amongfitness components. Evolution 54: 1654–1660.
Wu, S., Y. Liu, Y. Zheng, J. Dong, and D. Pan, 2008 The TEAD/ TEF family protein Scalloped mediates transcriptional output of the Hippo growth-regulatory pathway. Dev. Cell 14: 388–398. Xu, J., G. Gontier, Z. Chaker, P. Lacube, and J. Dupont et al.,
2013 Longevity effect of IGF-1R(+/2) mutation depends on ge-netic background-specific receptor activation. Aging Cell 13: 19–28. Zhang, L., F. Ren, Q. Zhang, Y. Chen, B. Wang et al., 2008 The TEAD/TEF family of transcription factor Scalloped mediates Hippo signaling in organ size control. Dev. Cell 14: 377–387. Zhang, X., C. C. Milton, P. O. Humbert, and K. F. Harvey,
2009 Transcriptional output of the Salvador/warts/hippo pathway is controlled in distinct fashions in Drosophila
mela-nogasterand mammalian cell lines. Cancer Res. 69: 6033–6041.
Zhang, X., C. C. Milton, C. L. C. Poon, W. Hong, and K. F. Harvey, 2011 Wbp2 cooperates with Yorkie to drive tissue growth downstream of the Salvador-Warts-Hippo pathway. Cell Death Differ. 18: 1346–1355.
Zhang, Z., B. Hsieh, A. Poe, J. Anderson, K. Ocorr et al., 2013 Complex genetic architecture of cardiac disease in a wild-type inbred strain ofDrosophila melanogaster. PLoS ONE 8: e62909. Zhao, B., X. Ye, J. Yu, L. Li, W. Liet al., 2008 TEAD mediates YAP-dependent gene induction and growth control. Genes Dev. 22: 1962–1971.
GENETICS
Supporting Information http://www.genetics.org/lookup/suppl/doi:10.1534/genetics.113.159426/-/DC1
Causes and Consequences of Genetic Background
Effects Illuminated by Integrative Genomic Analysis
Christopher H. Chandler, Sudarshan Chari, David Tack, and Ian Dworkin