ABSTRACT
PETLICK, JULIE HINSON. Learning and Memory in the Visual, Auditory, and Olfactory Modalities: An Investigation of the Generality of Serial Position Effects. (Under the direction of James W. Kalat and Slater E. Newman.)
Serial position effects have been obtained in species including pigeons, monkeys, and
humans. They have been demonstrated in both young and old humans and non-humans
alike. The research findings have indicated that short retention intervals produce a strong
recency effect whereas longer retention intervals give way to the primacy effect. This
traditional recency-primacy shift is supported by a great deal of empirical research. Much of
the research involves stimuli that can be classified as verbal and in most cases are presented
visually. There are few investigations of the generality of primacy and recency effects at a
strictly sensory level, such as with nonverbal stimuli especially in non-visual modalities. The
few investigations that have been reported have obtained inconsistent findings. This
experiment utilized a serial probe recognition task to investigate recognition memory for
nonverbal stimuli across 5 list positions. The visual, auditory, and olfactory modalities were
tested at both a 3 and 15 second delay. Results indicated the presence of both primacy and
recency effects in the auditory and olfactory modalities at short delay intervals. The shift
from recency to primacy was not obtained when delay was increased from 3 to 15 seconds.
The data suggest that serial position effects are characteristic of memory in general; however,
Biography
Julie Hinson Petlick obtained a B.A. in Psychology from North Carolina State
University, in May of 1994. She entered graduate school in the fall of 1994 and began
investigating the effects of calcium channel blocker on recovery of function. While she was
taking courses in Learning Theory and in Cognition, she became interested in the serial
position effect. She completed a thesis on serial position effects in aged monkey memory
and received her Masters in 1997.
While in graduate school, she taught courses in Biological Psychology, Learning and
Motivation, Adolescent Psychology, Introduction to Psychology, and laboratory sections of
Research Methods and Statistics. She also co-taught a graduate distance education course in
Using Technology for Learning. For the distance education course, she helped to design and
develop a web site, and also co-wrote the content for the course. During her work on this
course she developed her second research interest in the area of using technology to facilitate
learning.
During her time at North Carolina State, she continued her dual interests in learning
and technology and in the serial position effect. She has written tutorials and given
presentations for educators to help facilitate their use of technology as well as their teaching
with technology. For her dissertation, she focused on whether or not the serial position effect
Acknowledgments
I would like to thank my Doctoral Committee members, especially my co-chairs for
the guidance which they provided for me during the course of developing and conducting this
research. Your support and direction helped make this research possible. I would also like to
thank Dr. T.E. LeVere for truly being a mentor to me and for teaching me about the rigor of
conducting experimental research. The knowledge and skills you taught me are invaluable
and I will always be grateful for the wisdom you shared with me. I would also like to thank
Scott Lennon for his statistical advice and most of all for his generous spirit and talent for
turning my commiseration into motivation. Thanks also go to Sara Barker for her assistance
in conducting pilot research and for helping me stay on course throughout the project.
Finally, I greatly appreciate my husband and family for providing me such a supportive
TABLE OF CONTENTS
Page
List of Tables ………. vi
List of Figures ……… vii
1. Introduction ……… 1
2. Literature Review ………... 2
2.1Review of the Serial Position Effect ……… 2
2.2Theoretical Basis of Serial Position Effects ………. 9
2.3Auditory and Olfactory Serial Position Effects ………… 13
3. Methods ……….. 18
3.1Research Design ………... 20
3.2Visual Modality Procedures ……… 21
3.3Auditory Modality Procedures ………. 22
3.4Olfactory Modality Procedures ……… 23
4. Results ……… 24
4.1Overall Analysis ……….. 24
4.2Analyses of Auditory and Olfactory Conditions ………. 26
4.3Summary of Results ………. 31
5. Discussion ……….. 32
5.1Overall Findings ……….. 32
5.2Discussion of Auditory Findings ………. 32
5.3Discussion of Olfactory Findings ……… 33
5.4Discussion of Visual Findings ………. 34
5.5Recency-Primacy Shift Findings ………. 35
5.6Summary of Findings ………... 38
5.7Future Research ……… 39
5.8Concluding Remarks ……… 40
6. List of References ……… 42
Appendix A. Olfactory Stimuli ……….. 46
Appendix B. Visual Stimuli ……… 47
Appendix C. Auditory Stimuli ……… 48
Appendix D. Informed Consent Form ……… 49
Appendix E. Visual Procedure Instructions ……… 51
Appendix F. Presentation Rate and Interstimulus Interval ……. 52
Appendix G. Auditory Procedure Instructions ……… 53
Appendix H. Olfactory Procedure Instructions ……… 54
Appendix I. Pilot Test of Visual Stimuli ………. 55
Appendix J. Pilot Test Discriminability Instrument ……… 56
Appendix K. Summary of Pilot Test and Results ……… 59
LISTOFTABLES
Page
Table 1 ANOVA summary table for auditory performance as a function of list position for a 3-second delay
interval ……… 26
Table 2 Tukey post-hoc test for auditory performance as a function of list position for a 3-second delay
interval ……… 27
Table 3 ANOVA summary table for auditory performance as a function of list position for a 15-second delay
interval ……… 27
Table 4 Tukey post-hoc test for auditory performance as a function of list position for a 15-second delay
interval ……… 28
Table 5 ANOVA summary table for olfactory performance as a function of list position for a 3-second delay
interval ……… 29
Table 6 Tukey post-hoc test for olfactory performance as a function of list position for a 3-second delay
interval ……… 29
Table 7 ANOVA summary table for olfactory performance as a function of list position for a 15-second delay
interval ……… 30
Table 8 Tukey post-hoc test for olfactory performance as a function of list position for a 15-second delay
interval ……… 31
Table 9 ANOVA summary table for auditory pilot ………. 60
LIST OF FIGURES
Page
Figure 1. Counterbalancing sequences ……… 21
Figure 2. Mean correct for each modality across list position
with 3-second delay ………. 24
Figure 3. Mean correct for each modality across list position
With 15-second delay ……….. 25
Figure 4. Auditory task – Pilot test performance ……… 61
Learning and Memory in the Visual, Auditory, and Olfactory Modalities: An Investigation of
the Generality of Serial Position Effects
Introduction
Serial position effects are a pervasive characteristic of human memory and have had a
considerable impact on the study of memory. Serial position effects (SPE’s) refer to the
differences in recall of items based upon location in a list. Items that occur at the beginning
of a list (primacy), and items that occur at the end of a list (recency), are more likely to be
recalled than items located in the middle. The U-shaped serial position function is a robust
finding and is well documented in the literature. Also well documented is a recency-primacy
shift when the retention interval is increased. Typically, if list memory is tested following a
short retention interval, the recency effect is the more prominent effect; however, as the
retention interval increases, the primacy effect becomes more prominent. SPE’s and the
recency-primacy shift are easily recognizable when inspecting graphed data from both recall
and recognition studies.
Although SPE’s have been supported by a long history of empirical research and
under a variety of conditions, most research has utilized stimuli that can be classified as
verbal material (e.g. words, nameable pictures and objects). It has also been the case that
much of the research presented stimuli visually. SPE’s and the recency-primacy shift have
been reliably obtained in humans and non-human animal models. On the basis of the vast
majority of the research findings, it is tempting to conclude that primacy and recency and the
level (nonverbal stimuli) either have been unable to obtain primacy and recency effects or
have obtained inconsistent results. The research procedures utilized in this experiment
provide an investigation of the generality of the primacy and recency effect and of the
recency-primacy shift at a more basic sensory level.
Literature Review
The study of serial learning was first introduced by Ebbinghaus, who began by
arranging nonsense materials into serial lists and measuring the number of trials to criterion
as well as savings following an imposed delay interval. Modifications of his basic
methodology have allowed researchers to extend the study of memory to what it has become
today. The nonsense syllable provided researchers with one of the earliest means of
conducting empirical investigations of memory. One of the ways early researchers, including
Ebbinghaus, studied memory was by comparing the number of trials required to learn
meaningful material versus nonsense material.
One oft-cited experiment on serial position effects is that of McCrary and Hunter
(1953), who used the serial anticipation method and examined rates of learning for 14
nonsense syllables versus 14 familiar names. The number of errors was plotted by list
position. Bow-shaped curves were obtained for both conditions with the majority of errors
occurring in the middle of the list. Although more errors occurred in the middle of the list,
this tendency was considerably reduced when the stimuli were familiar names instead of
nonsense syllables.
Other researchers using different methodologies also obtained similar findings
regarding differences in memory based upon an item’s location in a list. Murdock, Jr. (1962)
allowed 1 1/2 minutes for free-recall. The data were plotted as probability of recall based
upon the item’s serial position. Items at the beginning of the list (primacy) had a high
probability of recall as did items occupying the last few positions in the list (recency).
Probability of recall was poorest for items occupying the middle portion of the list. The
probability curves were bow-shaped with somewhat of an S shape at the end or recency
portion of the list. Murdock presented the experimental findings in conjunction with other
work reported in the literature and essentially provided a detailed description of the SPE
under free recall conditions. Worth noting are his concluding remarks in which he suggested
a possible theoretical basis for SPE’s as being due to proactive and retroactive interference.
The basic notion of interference theory is that the retrieval of information results from
competition or interference among stimuli. With regard to serial lists, early list items could
become confused with or displaced by the presentation of subsequent list items, which would
be an example of retroactive interference (RI). Likewise, items that occur during the latter
portion of the list, could be interfered with by preceding list items thus demonstrating
proactive interference (PI). Since the first list item is not preceded by an item, nor is the last
item followed by another item, the items presented in these positions are less susceptible to
proactive interference and retroactive interference respectively. Items occupying the middle
segment of the list, however, are vulnerable to both PI and RI. Due to the greater amount of
interference for items in the middle portion of the list, probability of recall is lowest in the
middle portion. This is one explanation as to why serial learning experiments yield
bow-shaped memory curves.
Another early theoretical account of the serial position effect is the two-store theory.
primacy and recency effects. Glanzer and Cunitz proposed that the U shaped serial position
curve was actually two curves. Each curve represented output from one of two separate
storage systems. Primacy was purported to derive from output from a long-term store and
recency was purported to derive from output from short-term storage. To test these
hypotheses, Glanzer and Cunitz conducted two experiments using free recall to see if they
could manipulate variables in such a way as to impact one of the effects while leaving the
other unaffected.
In the first experiment Glanzer and Cunitz manipulated the presentation rate of the
list items. The lists consisted of twenty, one-syllable nouns. List items were presented via
tape recordings with presentation rates of 3, 6 or 9-seconds per item. Participants were given
two minutes for free recall. The results indicated that as presentation rate increased, the
probability of recall was greater for items occurring early in the list whereas items occurring
later in the list were unaffected.
In the second experiment, the delay between list presentation and recall was
manipulated. Glanzer and Cunitz presented 15-item word lists using a slide projector and in
addition the experimenter read each word aloud as it appeared. List presentation was
followed by a delay interval of 0, 10, or 30-seconds. During the 10-second and 30-second
delay intervals the participants counted aloud. Following the delay interval the participants
were instructed to free-recall the items. The results indicated that as the delay interval
increased, the probability of recall decreased for items occurring late in the list but early list
items remained unaffected. The decrease in recall of the later list items was used to support
the notion that recency was a function of short-term memory and therefore susceptible to
factors could affect different aspects of the curve while leaving the other portion unaffected
and therefore the results supported the two-storage theory.
The research and the theoretical account of Murdock, Jr. (1962) and Glanzer and
Cunitz (1966) represent some of the early work regarding verbal memory and the serial
position effect. Their research demonstrates the existence of the primacy effect and the
recency effect using the method of free recall. Furthermore, Glanzer and Cunitz’s research
demonstrates that primacy and recency can be obtained using verbal stimuli presented aurally
(Experiment 1). In addition, the results of Experiment 2 also demonstrate the relationship
between increasing retention interval and the recency effect (i.e. the recency-primacy shift).
Since that time, verbal memory and the SPE have received considerable attention.
Indeed, numerous experiments have obtained primacy and recency effects using verbal
material under a wide variety of different conditions establishing the robustness of the SPE
(e.g., Sands & Wright, 1980b; Roberts & Kraemer, 1981; Brown & Brown, 1982; Wright,
Santiago, Sands, Kendrick & Cook, 1985; Korsnes & Gilinsky, 1993; Neath & Knoedler,
1994). SPE’s have been found for both recall and recognition of items. They have been
demonstrated using free recall, and serial probe recognition methodologies. Some variables
that have been shown to affect SPE’s are retention interval (Wright, et al.,1985), semantic
category (Cole, Frankel & Sharp, 1971), age (Korsnes & Gilinsky, 1993) and dementia
(Massman, Delis & Butters, 1993). Thus, the data would seem to suggest that SPE’s are a
consistent characteristic of human memory in general.
The prominence of SPE’s in memory affords them the utility of being used as a
benchmark for memory comparisons. For example, some investigators use SPE’s to study
Rosene & Peters, 1988; Korsnes & Gilinsky, 1993). One example of such research is an
experiment in which Massman, Delis, and Butters (1993) compared the serial position curves
for individuals with Huntington’s disease (HD) and Alzheimer’s disease (AD) with that of
normal age-matched controls to investigate memory differences. Participants were orally
presented with a 16-item word list (list A) for five trials. The list consisted of four
categories (fruit, spices, clothing, and tools) each containing four items. Items from the same
category were not adjacent to one another. Following each trial the participant was allowed
free recall. An interference list (list B) was orally presented after the fifth trial followed by
free recall. Twenty minutes later, a free recall test, category cued recall test, and a yes/no
recognition test containing the 16 list items along with 28 distracters was administered for the
original list (list A).
The HD and AD groups had impaired performance on the primacy portion of the list
compared to the normal age-matched controls on tests of immediate free recall, category
cued recall, and delayed recall. However, on the recognition test, the HD participants did not
differ significantly from normal age-matched controls on the primacy portion but the AD
participants scored significantly worse. The HD and AD both showed immediate free recall
for recency items equivalent to that of the normal age-matched controls. As testing
progressed from trial one to trial five, the AD participants performed significantly worse than
the controls. Both the HD and AD participants performed worse than their matched
counterparts on the delayed recall and recognition tests for recency items.
While some researchers have used SPE’s to investigate memory changes related to
different dementias, animal researchers have used SPE’s to investigate similarities between
recognition (SPR) performance of a 4-year old rhesus monkey with that of an adult human
(22 years) on the same task. Ten-item lists were used which consisted of photographs of
common objects such as fruits and flowers. Items (photographs) were displayed onto a
screen using a projector, for 1-second each, and separated by 0.8-second delay. A 1-second
delay interval was used followed by presentation of a single probe item. The participant
responded by pressing a lever to the right to indicate if the item was the same as one of the
list items and to the left to indicate if the item was different from the list items. Primacy and
recency effects were obtained for both the rhesus and human.
Sands & Wright (1980b) conducted two additional experiments comparing human
and monkey memory. Experiment one was a replication of their earlier research (1980a) in
which they tested a monkey and a human using a 10-item list followed by a 1-second delay
interval. Experiment two extended the research by lengthening the list to include 20-items.
Once again the results indicated the presence of primacy and recency effects. These findings
provide further support for the pervasiveness of primacy and recency effects. Sands and
Wright’s findings not only demonstrate that primacy and recency effects are characteristic of
both human and monkey memory, but they also demonstrate that primacy and recency effects
can be obtained using a serial probe recognition task and can be obtained with stimuli which
consist of photographs of common objects.
Numerous additional experiments have since demonstrated primacy and recency
effects in many species including pigeons (Wright et al, 1985), squirrel monkeys (Roberts &
Kraemer, 1981), and rhesus monkeys (Castro & Larsen, 1992) providing further empirical
evidence that primacy and recency effects are characteristic of memory in general. In
across species, other research has presented evidence suggesting that the recency-primacy
shift might also be a general memory characteristic.
Glanzer and Cunitz (1966) found decreasing recency effects when the delay interval
between list presentation and test was increased. Korsnes and Gilinsky (1993) presented
groups of younger (aged 25-35, M=27 years.) and older (aged 65-75, M=71.6 years.) adults
with 4-item lists followed by a delay interval of 1, 50, or 100-seconds. A serial probe
recognition task was used to compare the memory performance of younger and older adults.
The recency effect was most prominent at the lowest delay interval and gave way to a
primacy effect as the delay interval was increased. Most noticeable was the finding that older
adults experienced the shift from recency to primacy earlier than young participants when
delay was increased.
Wright et al. (1985) tested pigeons, monkeys and humans using a serial probe
recognition task. Four-item lists were used in conjunction with varying delay intervals to
compare memory performance on serial lists across the three species. Delay intervals ranged
from 0 seconds up to 100 seconds. The results indicated the presence of a strong recency
effect at the lower delay intervals and a primacy effect at the longer delay intervals. The shift
from recency to primacy occurred for all three species. An interesting finding, one that is
also similar to that found by Korsnes and Gilinsky (1993), was that the three species differed
in the amount of increase necessary to bring about the shift. Pigeons required the least
amount of increase prior to shifting and humans required the largest increase prior to shifting.
The reported findings provide empirical support for the traditional recency-primacy shift as
being characteristic of memory for species including pigeons, monkeys, young and older
Although SPE’s have been reliably obtained under a wide range of conditions, the
research has been dominated by the use of verbal material. For humans, the visual stimuli
are often words and occasionally images (pictures) (Neath & Knoedler, 1994). For
experiments involving animals, the visual stimuli have often been pictures (Castro & Larsen,
1992). SPE’s for nonverbal and non-visual stimuli have not been as thoroughly investigated.
The auditory, olfactory and tactile modalities have been largely overlooked with respect to
SPE’s and using nonverbal stimuli would allow these modalities to be investigated. Due to
the lack of research in these other modalities, there is currently not sufficient evidence as to
whether SPE’s are characteristic of memory in general or whether they are specific to verbal
material. At present the most that can be said with any certainty is that they are characteristic
of verbal material and of the visual modality.
Theoretical Basis of SPE’s
Much like the way in which verbal stimuli have dominated the study of the serial
position effect, complex mathematical models that are somewhat narrow in focus dominate
contemporary theories of SPE’s. For example, Farrell and Lewandowsky (2002) propose the
SOB (serial-order-in-a-box) model of ordering in serial recall. The model describes a
network architecture that involves a “weight matrix.” Vectors of features represent each item,
and the weight matrix consists of these vectors. List items and the connections among them
(their features) are what make up the model. Retrieval is based upon nonlinear iterative
dynamics in which the vector of an item must fall within a “basin of attraction” (Farrell &
Lewandowsky, 2002). The complexity of the model makes its application by researchers
mathematical modeling, the underlying principles of the theory are also not generalizable to
serial probe recognition tasks.
The basic premise of the theory rests on two assumptions, a primacy gradient and
response suppression. The primacy gradient assumption asserts that retrieval of an item
decreases across list position, because of a decline in attention or due to a rehearsal trade-off,
both reflecting strategies useful for recalling early list items (Farrell & Lewandowsky, 2002).
This assumption is often represented in theoretical models by using weighting parameters
that are reduced for items occurring later in the list. The primacy gradient is used to account
for superior recall of initial list items compared to list items occurring in the middle portions
of the list.
Response suppression is the assumption that after an item is recalled, it becomes
temporarily suppressed and no longer available for recall. This assumption is necessary to
explain recency effects. According to Farrell and Lewandowsky (2002), “as more and more
items are recalled - and hence suppressed – fewer response alternatives remain.” The reason
fewer response alternatives remain is that once an item is recalled it is suppressed, and
therefore, response suppression explains why performance is higher at the end of the list
compared to the middle (i.e. recency effects).
In a serial probe recognition task, such as the one utilized in the current experiment,
response suppression cannot be used to account for recency effects. On a given trial, a list is
presented and memory for only one list position is tested by using two probes, one of which
is a new novel cue and the other a repeated list item. On the next trial, a different list is
presented and memory for a different list position is tested. In addition, the positions are not
suppression can occur on that trial, and therefore, response suppression cannot account for
why recognition is better for items occurring at the end of the list (recency) compared to
items occurring in the middle of the list.
It is possible that superior recognition of items occurring early in the list (primacy) is
due to decreased attention during list presentation of later items. Therefore, the primacy
gradient, as presented in Farrell and Lewandowsky’s SOB model, could be used to explain
primacy effects. However, the SOB model relies on the primacy gradient and response
suppression, as well as the interplay between the two, to be a useful model. For these
reasons, the SOB model is not applicable to the serial probe recognition paradigm used in
this experiment.
There are some important differences between serial recall and serial probe
recognition worth noting. The delay between learning and recall may not have the same
influence in serial recall as it does in serial probe recognition. For example, in a serial recall
task the participant is required to recall list items in their original order. If a 5-item list of
words were presented at a rate of 1 word per second followed by a 3-second delay, then
7-seconds would pass before recall of item 1. Assuming the participant recalls the items at a
rate of 1 item per second; 7-seconds would also pass between learning item 5 and recall of
item 5. The delay between learning an item and recall is essentially constant for all items.
This is not the case in a serial probe recognition paradigm (SPR). In a SPR task, after
presentation of list items, a delay ensues followed by a probe item. The participant must
indicate if the probe item was also a list item for that trial (two-choice forced alternative) or
is new. On each trial only one serial position is tested. So for a 5-item list with a
last list position (position #5) then only 3 seconds would have elapsed between learning and
recognition. However, if the probe item were for list position one, 7-seconds would have
elapsed between learning and recognition. Since the temporal nature of the two tasks differs,
only serial learning theories that incorporate values that reflect temporal differences would be
applicable to both serial recall and serial recognition tasks.
A recent serial learning theory that incorporates temporal values is the dimensional
distinctiveness model (Neath, 1993a). The basic premise of this theory is that list stimuli
vary with regard to their distinctiveness along a temporal dimension. Calculation of an
item’s distinctiveness includes the item’s position in the list, the inter-item presentation (IPI),
and the retention interval. Since this theory takes such variables into account, it is more
accommodating or generalizable than the SOB model. However, much like other serial
learning theories, this theory also involves numerous equations and calculations that likely
limit its application by researchers outside of modeling. This theory has proved useful for
serial probe recognition experiments.
Neath and Knoedler (1994) used the theory to make predictions regarding serial
position curves obtained from using a SPR task. Four-item lists comprised of images of
snowflakes were presented to participants at a rate (IPI) of 1-second each. Following
presentation of the last item in the list was a retention interval of 0, 2, or 5-seconds. A probe
item was displayed after the retention interval and participants indicated if the probe
snowflake was “old” or “new”.
Recognition was better for items occurring at the beginning and end of the list
(primacy and recency). As retention interval increased, there was a shift from recency to
Although using a model to make predictions regarding serial recognition is beyond the scope
of this experiment, once more data regarding the generality of serial position effects are
available; the dimensional distinctiveness model might provide a useful theoretical
framework from which one could continue exploration.
Auditory and Olfactory SPE’s
Within the contents of this literature review, an assortment of experiments has been
presented to both indicate the robustness of the serial position effect and to represent the
dominance of the utilization of verbal stimuli. It is undeniable that primacy and recency are
characteristic aspects of memory for verbal stimuli. Experiments with young and aged
humans and non-human animal models have yielded the well-known U-shaped serial
position curve. Since SPE’s are representative of verbal memory for much of the lifespan
and across species, it is tempting to generalize them to all aspects of memory. However, one
must resist this temptation until experimental methods have yielded such findings. Memory
within the olfactory and auditory modalities has largely been overlooked with regard to
uncovering fundamental characteristics of memory. The few undertakings have yielded
findings that are inconsistent and not indicative of the true nature of memory within these
modalities.
Two recent experiments, Wright (1998) and Knoedler, Hellwig and Neath (1999),
have investigated serial position effects in the auditory modality. One of the experiments
used rhesus monkeys and the other used human participants. The results from the two
experiments are not in agreement.
Wright (1998) tested the auditory memory of two rhesus monkeys. The monkeys
interval of either 0, 1, 10, or 20-seconds. After the retention interval, a probe sound was
played and the animal responded by touching one of two speakers to indicate whether the
probe sound was one of the list items (same) or a new item (different). Primacy and recency
effects were obtained; however, the primacy effect was most prominent at the short delay,
and as the delay increased the recency effect became the more prominent. Although SPE’s
were obtained, they are opposite of what is typically found with increasing the retention
interval. Wright was cautious in his conclusions but noted that the data he obtained indicated
that visual and auditory serial position functions for monkeys are in opposition to one
another. In the visual modality for both humans and non-humans, typically, the recency
effect is most noticeable at short delays whereas the primacy effect generally becomes more
prevalent with increasing delays. (Glanzer & Cunitz, 1966; Wright et al., 1985; Korsnes &
Gilinsky, 1993)
With knowledge of Wright’s findings, Knoedler et al. (1999) conducted an
experiment using human participants to investigate the shift from recency to primacy when
delay interval is increased. They conducted several experiments, one of which tested the
auditory modality. In the first two experiments, Knoedler et al. (1999) presented visual
stimuli consisting of a mixture of pictures and words. Four visual stimuli were presented one
at a time during the study trial. During the probe test trial, the stimulus was also a picture or
word. The investigators were testing to see if changing the physical form of a stimulus from
study to test would affect recall. They found that performance was more accurate when the
physical form of the stimulus matched from study trial to test trial. They also found that for
short delays recall was better for items that occurred at the end of the list (recency) and as the
(primacy). These results demonstrate the typical serial position effect that is normally
obtained from tests of visual memory.
For experiment three, Knoedler et al. (1999) used the same procedure as described
above with the addition of having each participant pronounce the words out loud as they
were presented on screen. The retention intervals tested were 1 and 3-seconds. The results
indicated an interaction between serial position and retention interval. They concluded that
when people were tested within the auditory modality, the recency effect is present at short
delays and the primacy effect becomes more prominent at longer delays. These results are
congruent with the typical recency-primacy shift and contrary to the results obtained by
Wright (1998).
In Knoedler et al’s procedure, there are two possible reasons as to why the
investigators might have found the typical recency-primacy shift. The most obvious is that
Knoedler et al. were testing humans rather than monkeys. This explanation is not likely
given the fact that the animal data for serial position effects for visual stimuli directly parallel
those from humans. A second and more likely explanation is based on the differences
inherent in the methodologies of the two experiments. Wright (1998) used sounds as the
stimuli. Knoedler et al. (1999) in experiment three presented stimuli (words) visually and the
participants had to say the word aloud. One reason the results might be different from
Wright’s, and instead more in line with what is typical of visual memory, is that the
participants could have relied on the visual stimulus (seeing the word) since it was also
present during the task. It is also the case that Knoedler et al’s stimuli were verbal and
One of the objectives of the current experiment was to investigate whether serial
position effects could be obtained using solely auditory presentation of nonverbal stimuli. In
addition, if SPE’s were obtained, what effect would increasing retention interval have on the
shape of the serial position curves? If SPE’s are characteristic of memory in general, then
one would predict that items presented aurally would have a higher rate of recall if they
occupied the first and last list positions. One would also expect a shift from recency to
primacy to occur as retention interval is increased.
In comparison to the visual modality, the olfactory modality has received little
attention with regard to serial memory processes. One of the reasons for this is the
complexity of testing within this modality. People habituate after prolonged exposure to an
odor. Also, various odors can linger and mix with one another and therefore contaminate the
testing environment. Testing within this modality is limited by these factors that do not
apply in other modalities. Due to these limitations, if testing for serial position effects within
the olfactory modality, any list would need to be relatively small in size and delay intervals
both between item presentation and list presentation would need to be sufficient to prevent
habituation or contamination. Much like the data regarding audition, there are contradictory
results that have been reported regarding serial position effects within the olfactory modality
(White & Treisman, 1997; Reed, 2000).
White and Treisman (1997) conducted an experiment in which participants were
presented with a list consisting of five odors. Odors were presented for 500ms followed by
2750ms of fresh air. A pair of 500 Hz tones was presented 2750ms after presentation of the
500 Hz tone pair. The participants’ task was to indicate whether the probes were included in
the list or were new. The results obtained indicated a recency effect but no primacy effect.
Reed (2000) conducted several experiments concerning serial position effects for
olfactory memory. Noting the failure to obtain primacy by White and Treisman, and the
possibility of odors interfering with each other, Reed modified the methodology used by
White and Treisman. Rather than presenting three probes, Reed presented two probe odors,
one of which was from the list, and the other a new odor. For the first experiment, Reed
presented participants with five odors, each odor exposure lasting 3-seconds with a 2-second
delay interval between the odors. After the five odors were presented, a 3-second retention
interval ensued followed by presentation of the two probe odors. The participants were to
select the odor that had been contained within the list. Results indicated both primacy and
recency effects were present.
For experiment two, Reed tested participants on lists containing seven odors. In
addition, participants were divided into two groups with one group being tested using the
3-second retention interval (as in experiment one) and the 3-second group tested using a
30-second retention interval. At a 3-30-second retention interval both primacy and recency effects
were present. This finding is consistent with the findings of experiment one, and in addition
demonstrates that SPE’s can be obtained with lists as long as seven olfactory items.
However, at the 30-second retention interval there was no difference in performance across
any of the list positions.
Reed’s findings provide some indication that SPE’s may be characteristic of memory
in general rather than specific to the visual modality or to verbal material. Although Reed
shift from recency to primacy with increasing delays was not obtained. In keeping with the
objectives stated regarding the auditory modality, the current experiment additionally
investigated whether SPE’s would be obtained in the olfactory modality. And of additional
interest, if SPE’s were obtained, what effect would increasing retention interval have on the
shape of the serial position curves?
In summary, there is much research reporting SPE’s under various conditions within
the visual modality and for verbal material. There are fewer results regarding SPE’s in the
auditory (nonverbal) and olfactory modalities. The auditory and olfactory research findings
that are reported are contradictory and do not provide a basis for determining whether SPE’s
are characteristic of memory in general or whether they are specific to visual memory and
verbal material. The present research presented human participants with visual, auditory, and
olfactory lists comprised of non-verbal stimuli. In addition, performance was tested under
two different retention intervals to determine whether or not SPE’s would be obtained and
what changes, if any, occurred as a result of an increased retention interval.
Method Participants
Ninety-six students enrolled in an Introductory Psychology course at North Carolina
State University served as participants in partial fulfillment of their course requirements.
Participants ranged in age from 18 – 26 years (M=19.28 years). The 3-second delay
condition contained 30 males and 18 females, as did the 15-second delay condition. Each
participant engaged in list learning tasks that were distributed across three modalities: visual,
and olfactory abilities (or corrected to normal by eyewear). All participants were
non-smokers.
Apparatus & Materials
A Windows/Intel computer with Flash version 5.0 was used to control presentation of
visual and auditory stimuli. Visual stimuli were displayed on a 15” monitor, and auditory
stimuli were delivered via Sennheiser closed-back noise-reducing headphones. Olfactory
stimuli were manually presented in 2” black plastic vials. Each vial had identical white
labels with numbers indicating the particular stimulus. The olfactory stimuli were kept
behind a screen and at no time did participants view them.
The olfactory stimuli consisted of a pool of commercially available odors purchased
from The Body Shop (Appendix A). During presentation of olfactory stimuli, participants sat
facing a computer monitor displaying a white screen, while the experimenter sat beside the
participant but facing perpendicular. A table containing a screen was placed behind the
participant, and the olfactory stimuli were placed behind the screen. During presentation of
olfactory stimuli the experimenter would reach behind the screen and manually place the vial
of odor directly under the participant’s nose for three- seconds.
The visual stimuli consisted of 10 snowflakes (Appendix B). Six hundred sixty-two
snowflakes were obtained from Ian Neath, Purdue University (see Neath & Knoedler, 1994)
and a pilot test was conducted to ensure selection of stimuli judged to be discriminable from
one another (see Appendix I & J).
Auditory stimuli consisted of 10 tones (see Appendix C) created using Test-Tone
Generator version 3.3 software (Esser, 2002). Tones ranged from 75 hz – 559 hz and starting
Procedure Research Design
The experimental methodology was derived from the olfactory research conducted by
Reed (2000). A mixed design was utilized in which performance for two groups of
participants was compared across three modalities. Participants in Groups One and Two
were tested across three modalities (visual, auditory, olfactory) using retention intervals of 3
and 15 seconds respectively.
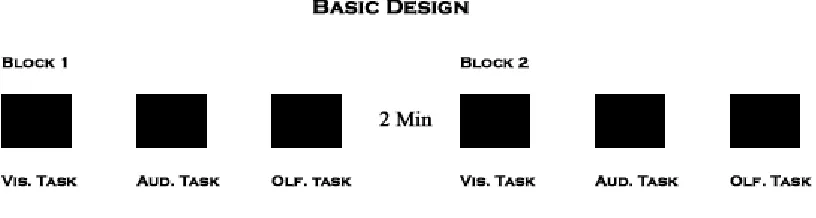
Participants were tested individually across two blocks for a total of 30 trials, 10
within each modality. Blocks were separated by a two-minute rest period. For each block of
trials, each stimulus appeared a total of 7 times, once serving in each of the 5 list positions
and twice serving as probes. The order in which participants were tested across modalities
was balanced (Figure 1). Although the order of testing was balanced, the order in which
participants were assigned to treatment conditions was quasi-random. The overall goal was
Figure 1. Counterbalancing sequences
Participants were tested in a well-ventilated room containing a fan blowing directly
towards them throughout the entire experiment. Additionally, participants wore headphones
throughout the experiment. The primary reason for testing across modalities within a block
of trials, rather than testing within a modality consecutively, was to guard against
overloading the olfactory system and therefore preventing olfactory habituation.
Visual Modality Procedure
Upon entering the laboratory, all participants were thanked for coming and instructed
Appendix D). Participants were instructed to direct a table fan so that it was blowing directly
onto their face and to put on the pair of headphones. Participants were next given the
instructions regarding the task (see Appendix E).
When the participant indicated readiness to begin, the experimenter initiated the trial
by double clicking the correct HTML file. The word “START” was displayed on the screen
for 3-seconds followed 2-seconds later by sequential presentation of the visual stimuli
(snowflakes). Each stimulus was presented for 3-seconds with a 3-second inter-stimulus
interval (ISI) occurring between list items. Following the last list item, a retention interval of
3 or 15-seconds ensued. During the retention interval, 1-second after the last item, a red light
was displayed for ½ -second signaling the end of the learning phase and the beginning of the
test phase. Following the retention interval, probe #1 was displayed for 3-seconds followed
3-seconds later by probe #2 (see Appendix F).
The task for the participant was to indicate orally, which one of the probe items had
also been presented as a list item for that trial. Participants were instructed to indicate their
response by saying aloud either “probe 1” or “probe 2.” Additionally, participants were
instructed to wait and respond only after both probes had been presented (see Appendix E).
During block one, participants were tested for 5 visual trials. Each of the 5 list positions was
tested once across the trials. A 1-minute inter-trial interval (ITI) was used to separate the
trials. In creating the computer files for presentation of visual stimuli, a random numbers
table was used to determine the order in which list positions were tested.
Auditory Modality Procedure
The auditory procedure was the same as described for the visual modality with the
Appendix F). Participants were read the same instructions as given in the visual procedure
with the word “tones” substituted in place of the word “images.” Participants were further
instructed that although this was an auditory task they should remain focused on the screen
because the word “START” would still appear, as would the labels “Probe 1” and “Probe 2”
in conjunction with the tones (see Appendix G).
Olfactory Modality Procedure
The olfactory procedure followed the same design as that of the visual and auditory
modalities (see Appendix H for participant instructions). A few minor differences resulted
from the task being manual rather than automated. The participant sat facing the monitor that
displayed a white screen. The experimenter sat beside the participant but faced
perpendicular. Odors were contained in 2” black plastic vials. In the visual and auditory
tasks a trial began when the word “START” was displayed on screen. In the olfactory
procedure the experimenter said aloud the word “START.” Odors were manually presented
and placed directly underneath a participant’s nose for approximately 2-3 seconds each. An
ISI of 3 seconds occurred between the odors. Following presentation of all five odors a delay
ensued followed by presentation of probe odors. During presentation of probe 1 the
experimenter said aloud “Probe 1” and three seconds later said “Probe 2” during its
presentation. The olfactory procedure was the same as the visual and auditory procedures
except that the presentation was manual, and the words “START, Probe 1 and Probe 2” were
Results
Overall Analysis
Accuracy of recognition was analyzed using a 5 (position) by 3 (modality) by 2
(delay) mixed factorial ANOVA with repeated measures on two factors (modality &
position). There was a main effect of position [F (4, 376) = 30.13, p<.0001], of modality [F
(2, 188) = 64.95, p<.0001], and an interaction between modality and position [F (8, 752) =
8.40, p<.0001]. No other effects were found to be significant (p>.05).
3-second delay
0 0.2 0.4 0.6 0.8 1 1.2 1.4 1.6 1.8 2
1 2 3 4 5
position
mean nu
mber correct
Aud Olf Vis
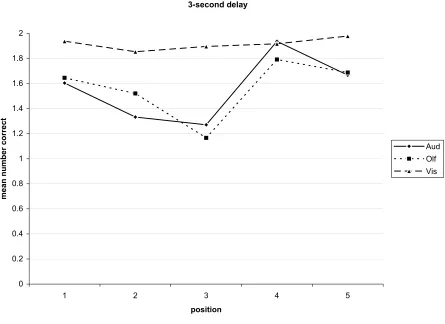
Figure 2 depicts the mean number correct for recognition at each of the list positions
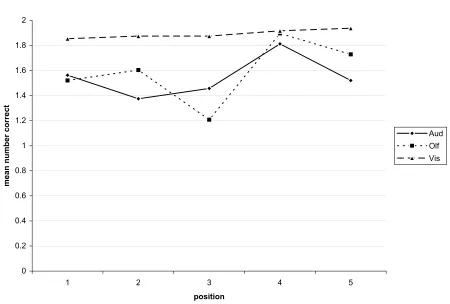
for each modality following a delay interval of 3-seconds. Figure 3 depicts the mean number
correct at each list position following a delay interval of 15-seconds.
15-second delay
0 0.2 0.4 0.6 0.8 1 1.2 1.4 1.6 1.8 2
1 2 3 4 5
position
mean nu
mber correct
Aud Olf Vis
Figure 3. Mean correct for each modality across list position with 15-second delay
Notice in both figures that performance on auditory and olfactory recognition varies across
list position, but visual recognition performance on all five positions is close to perfect and
the line is essentially flat suggesting a ceiling effect. The visual task was apparently too easy
and therefore did not provide a sensitive enough measure to detect any effects of position on
was conducted to determine whether primacy and recency effects occurred in the auditory
and olfactory conditions for each delay interval.
Analysis for Auditory and Olfactory Conditions
Individual analyses were conducted on the data for each modality at each delay
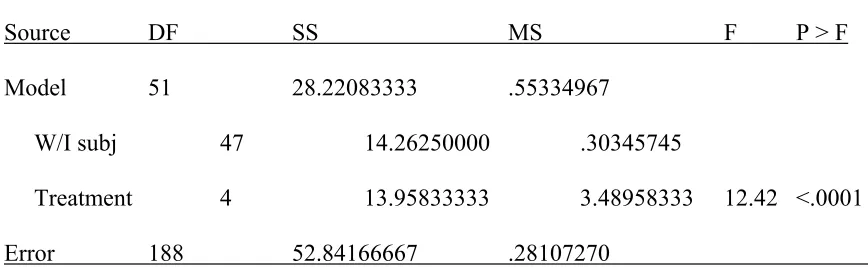
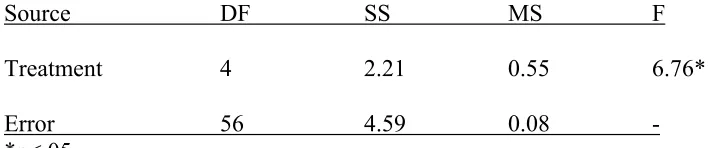
interval in conjunction with post-hoc tests. A one-way repeated measures ANOVA was
conducted on the auditory data at the 3-second delay (see Table 1). Recognition was not
equal across list positions [F (4,188) = 12.42, p<.0001].
Table 1. ANOVA summary table for auditory performance as a function of list position for a 3-second delay interval
Source DF SS MS F P > F
Model 51 28.22083333 .55334967
W/I subj 47 14.26250000 .30345745
Treatment 4 13.95833333 3.48958333 12.42 <.0001
Error 188 52.84166667 .28107270
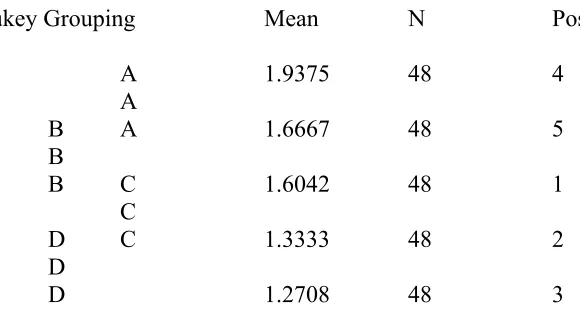
A post-hoc test (Tukey) indicated that recognition was significantly higher at the
beginning and end of the list compared to the middle (results are depicted in Figure 2).
Performance at positions 4 & 5 was not significantly different from one another but position
4 performance was significantly higher than performance at the remaining three positions.
Likewise, performance at positions 1 and 5 did not differ from one another but position 5 was
significant compared to positions 2 and 3. Also, performance at positions 1 and 2 was not
significantly different but position 1 performance was significantly higher than position 3.
and lowest in the middle of the list (see Table 2). These findings suggest that primacy and
recency are obtainable in the auditory modality when nonverbal stimuli are used.
Table 2. Tukey post-hoc test for auditory performance as a function of list position for a 3-second delay interval
Tukey Grouping Mean N Position
A 1.9375 48 4
A
B A 1.6667 48 5
B
B C 1.6042 48 1
C
D C 1.3333 48 2
D
D 1.2708 48 3
Note: means with the same letter are not significantly different
An additional one-way repeated measures ANOVA was conducted for the auditory
data at the 15-second delay (see Table 3). Recognition was significantly different across list
positions [F (4,188) = 4.58, p<.0015].
Table 3. ANOVA summary table for auditory performance as a function of list position for a 15-second delay interval
Source DF SS MS F P > F
Model 51 21.92083333 .42982026
W/I subj 47 16.69583333 .35523050
Treatment 4 5.22500000 1.30625000 4.58 <.0015
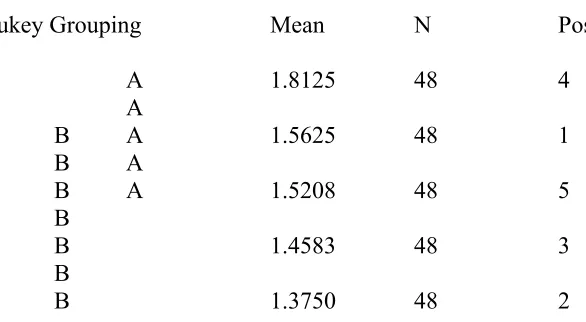
A post-hoc test (Tukey) indicated that recognition was significantly higher at position 4
compared to positions 2 and 3. Recognition at positions 1, 4 and 5 did not differ from one
another. However, recognition at positions 1 and 5 also did not differ from recognition at
positions 2 and 3 (see Table 4).
Table 4. Tukey post-hoc test for auditory performance as a function of list position for a 15-second delay interval
Tukey Grouping Mean N Position
A 1.8125 48 4
A
B A 1.5625 48 1
B A
B A 1.5208 48 5
B
B 1.4583 48 3
B
B 1.3750 48 2
Note: means with the same letter are not significantly different
A one-way repeated measures ANOVA was used to analyze recognition across list position
for the olfactory data at a delay interval of 3 seconds (see Table 5). Recognition was
Table 5. ANOVA summary table for olfactory performance as a function of list position for a 3-second delay interval
Source DF SS MS F P > F
Model 51 45.0708333 .8837418
W/I subj 47 33.86250000 .72047872
Treatment 4 11.20833333 2.80208333 9.41 <.0001
Error 188 55.9916667 .2978280
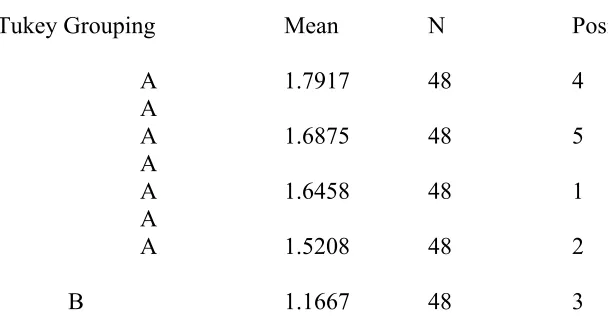
A post-hoc test (Tukey) indicated recognition was equivalent at positions 1, 2, 4, and 5, but
was significantly greater than recognition at position 3 (see Table 6).
Table 6. Tukey post-hoc test for olfactory performance as a function of list position for a 3-second delay interval
Tukey Grouping Mean N Position
A 1.7917 48 4
A
A 1.6875 48 5
A
A 1.6458 48 1
A
A 1.5208 48 2
B 1.1667 48 3
Note: means with the same letter are not significantly different
An additional one-way repeated measures ANOVA was used to analyze recognition
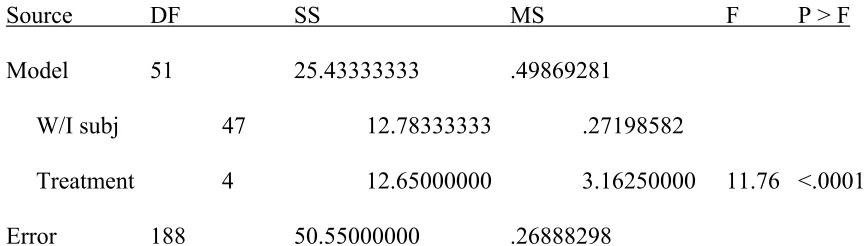
Table 7. ANOVA summary table for olfactory performance as a function of list position for a 15-second delay interval
Source DF SS MS F P > F
Model 51 25.43333333 .49869281
W/I subj 47 12.78333333 .27198582
Treatment 4 12.65000000 3.16250000 11.76 <.0001
Error 188 50.55000000 .26888298
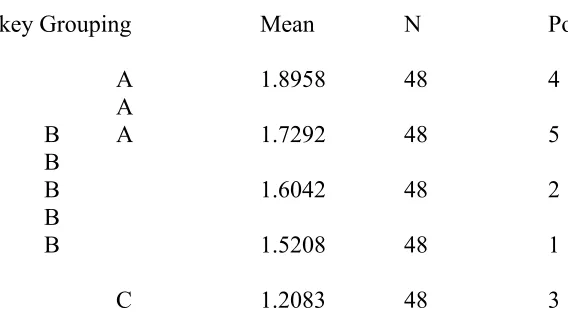
Recognition was significantly different with regard to list position [F (4, 188) = 11.76, p<
.0001]. A post-hoc test (Tukey) indicated recognition at position 4 was significantly higher
than all other positions except position 5. Recognition at positions 1, 2, 4 and 5 were all
Table 8. Tukey post-hoc test for olfactory performance as a function of list position for a 15-second delay interval
Tukey Grouping Mean N Position
A 1.8958 48 4
A
B A 1.7292 48 5
B
B 1.6042 48 2
B
B 1.5208 48 1
C 1.2083 48 3
Note: means with the same letter are not significantly different
Summary of Results
Overall the results indicate that primacy and recency effects are obtainable when
testing in the auditory modality. At the 3-second delay, both primacy and recency effects
were present. There was no shift from recency to primacy as delay interval was increased.
In fact, at the 15-second delay interval, the primacy effect was no longer present. There was
some evidence of a recency effect at the 15-second delay due to superior performance at
position 4; however, performance at position 5 (which would be the most recent list position
presented prior to testing) was not significantly different from performance in the middle of
the list (position 3).
Olfactory results indicate that primacy and recency effects were present at both the
3-second and 15-3-second delay intervals. However, there was no evidence of a shift from
The visual results indicate that performance was at or near a ceiling effect in both the
3-second and 15-second delay interval conditions. No differences were found in
performance across any of the positions at either delay.
Discussion
Overall findings
This experiment examined the generality of serial position effects. Performance
across list positions was tested in three modalities and the overall findings extend the
generality of the serial position effect. Although both primacy and recency effects have been
obtained with visually presented verbal material, results for other modalities using nonverbal
stimuli have been inconsistent at best. The data obtained in this experiment indicate the
presence of primacy and recency effects in both the auditory and olfactory modalities. A
general discussion of the findings is presented for each modality, followed by a separate
discussion regarding the recency-primacy shift.
Discussion of Auditory Findings
Although Knoedler et al. (1999) reported primacy and recency effects within the
auditory modality, their stimuli were verbal in nature and the visual stimuli were also present.
The current experiment provides a more rigorous test of auditory memory in that the stimuli
were nonverbal and no corresponding visual stimuli were present during the auditory test.
Using auditory nonverbal stimuli did result in recognition being best for stimuli presented at
both the beginning and end of the list. This suggests that primacy and recency are indeed
obtainable in auditory memory.
However, this finding was only obtained for data collected using a 3-second delay
compared to all other positions, which is suggestive of a recency effect. However,
performance at all other positions was equivalent. Position 5 represents the position that
would be most recent prior to testing. Therefore, before concluding that the recency effect is
obtainable at a 15-second delay, one must determine why performance for position 4 was
superior and performance for position 5 was no different than performance in the middle or
beginning of the list.
One possibility is that the finding represents an artifact. A random numbers table was
used in the creation of the sequences for presenting stimuli. Each list position was tested
twice (once in each block) for each modality. On one of the two auditory trials for which list
position 4 was being tested, the stimuli that served as probes happened to be at the two ends
of the range. One of the probes for the trial was 75 Hz and the other probe was 559 Hz. The
correct probe (the one that was also presented within the list) was the 75 Hz tone. Since the
559 Hz tone did not occur during the trial, it might have been more distinctive in the context
of the trial, and therefore, could have been easier to rule out as the correct response, thereby
elevating performance at that position. Further research within the auditory modality is
clearly needed before one can state with any certainty that SPE’s are present at long delay
intervals.
Discussion of Olfactory Findings
Primacy and recency effects were present at both the 3-second and 15-second delay
intervals. In fact, regardless of delay interval, performance was better at the beginning and
end of the list compared to the middle portion. The data for the 3-second delay are also
consistent with Reed’s (2000) finding of primacy and recency in the olfactory modality, and
memory. Although Reed was unable to obtain serial position effects using a delay of
30-seconds, the present findings demonstrate primacy and recency can be obtained using a delay
interval of 15-seconds.
Discussion of Visual Findings
The data for visual recognition were disappointing and uninformative with regard to
the hypothesis of interest due to an unexpected ceiling effect. A pilot study suggested that
the list length, presentation rate, ISI and retention interval could have been appropriate to
detect deficits in recognition (see Appendix K & L). However, the pilot study was conducted
using classroom populations in a group setting that may have had various sources of
interference. During the actual experiment, individuals were tested individually in a
controlled environment and this could have facilitated performance.
Although the visual data were disappointing with regard to serial position effects,
information collected during debriefing provided some feedback regarding their
appropriateness as nonverbal stimuli. The visual stimuli were snowflakes, which were
obtained from Ian Neath, Purdue University. Neath utilized these snowflake stimuli in
several experiments (Knoedler et al. (1999); Neath, & Knoedler, 1994). The protocols used
by Neath were such that the stimuli were selected for presentation on a random basis.
For the current experiment a pilot experiment was conducted to ensure that
participants could reliably discriminate each of the snowflakes from all of the others (see
Appendix I & J). The pilot study was done to rule out the possibility of recognition failures
being due to participants’ inability to discriminate rather than to their not being able to
remember. Although ensuring that stimuli can be discriminated from one another was a
helped facilitate performance. As can be seen from inspecting the data, visual performance
was at or near a ceiling effect.
Of more interest, was that it was also the case that during the current experiment,
participants all reported naming the snowflakes. During debriefing, all participants were
asked what strategies, if any; they had used to help them be successful on the three tasks.
Names commonly reported were “tree (Christmas tree, pine needles, tree limbs), leaf (oak
leaf, leaves), star (Ninja star), guitar (guitar strings, broken guitar), arrow, fan (ceiling fan),
and flower”. Since such a large number of participants reported naming the stimuli as the
strategy they used to facilitate performance, and since there was quite a bit of commonality
among the names generated by the participants, the visual stimuli possibly did not provide a
rigorous test of visual memory for nonverbal stimuli. Therefore, future research efforts
should be directed toward developing stimuli that are more like their nonverbal counterparts
utilized in the auditory and olfactory modalities. Development and use of such stimuli would
provide a more rigorous examination of visual memory for nonverbal materials and allow for
a stronger case when comparing performance across the three modalities.
Recency-Primacy Shift Findings
Previous research using verbal stimuli presented visually and research using
nonverbal stimuli has demonstrated that the recency effect is more prevalent at short delays
and that the primacy effect becomes more prevalent at long delays. Knoedler et al.’s (1999)
Experiment 1 (1999) use of black and white line drawings and their corresponding names as
stimuli in conjunction with a SPR task is an example of research demonstrating the recency
effect at short delays and the primacy effect at longer delays. Korsnes and Gilinsky (1993)
- 75, M=71.6 years) adults tested on a SPR task with slides consisting of black and white
patterns and colored abstract paintings. Wright et al. (1985) demonstrated the finding using
pigeons, monkeys and humans using kaleidoscope travel slides in conjunction with a SPR
task. In each of these experiments, the recency effect was present at short delays and gave
way to the primacy effect as the delay interval increased. These findings suggest that the
recency-primacy shift with increased delay is characteristic of visual memory for both verbal
and nonverbal stimuli. The findings also suggest that the recency-primacy shift occurs across
species.
The present experiment also employed a SPR task yet there was no indication of a
recency-primacy shift. The 5 x 3 x 2 mixed factorial ANOVA with repeated measures
detected no significant effects of delay (i.e. no main effect and no interaction effects). Since
the visual data were near or at a ceiling effect, to test for the possibility of the visual data
masking any additional effects, a second analysis was performed to provide more insight
regarding the nature of performance within the olfactory and auditory modalities. A 5 x 2 x 2
mixed factorial ANOVA was conducted (the visual data were dropped) and once again, there
were no significant main effects and no significant interaction effects of delay (p>.05). In
fact, for the olfactory data, recognition was consistently better at the beginning and end of the
list compared to performance on the middle portion regardless of delay interval. This finding
is consistent with Reed’s (2000) results at his short (3-seconds) but not at his long
(30-second) delay.
For the auditory data, performance was better at the beginning and end of the list at
the 3-second delay interval, but, as noted earlier, performance did decline at the 15-second
methodological concerns (probes represented opposite ends of range) and therefore drawing
conclusions regarding the nature of SPE’s at longer delays is premature. Additionally,
although Knoedler et al. (1999) report a recency-primacy shift within the auditory modality
based upon a significant interaction between serial position and delay, the methodology used
in their experiment is also cause for concern (Their participants stated out loud a name for
each stimulus as it appeared on the screen). Their method is confounded with presentation of
a visual stimulus, which was verbal in nature and therefore did not provide a rigorous test of
memory within the auditory modality. In light of the methodological concerns brought about
by both experiments, additional research should explore methodologies, which would
provide a purer test of memory for auditory stimuli. At present, the most that can be stated
regarding primacy and recency effects within the auditory modality is that they can be
obtained at short delay intervals, but the nature of the effects of longer delay intervals is not
yet known.
One point regarding the recency-primacy shift worth noting is the many ways
researchers have tested to determine whether or not the shift is present. Korsnes and
Gilinsky (1993) provide descriptive evidence as support for the recency-primacy shift. They
graph mean memory performance for the first and last list items as a function of delay
interval and note where the performance lines cross. For the older participants, the lines
crossed between the 1-sec and 50-second delay intervals, whereas for the young participants
the lines crossed between the 50-sec and 100-second delay intervals. This, in conjunction
with graphs of performance across list positions, is presented as evidence that older
participants shift from recency to primacy earlier than do their younger counterparts with
Wright et al. (1985) used polynomial trend analyses regarding changes in serial
position function as a basis for concluding that shifting from recency to primacy occurs
earliest in pigeons, then monkeys, and finally humans. Knoedler et al. (1999) reported a
significant interaction between serial position and retention interval to support the conclusion
that participants shifted from recency to primacy with increased retention interval. The
current experiment conducted a 5 x 3 x 2 mixed factorial ANOVA and found no significant
effects of delay. An additional 5 x 2 x 2 mixed factorial ANOVA was conducted and once
again, no significant effects of delay were found. Therefore, with regard to the findings in
general, the present results indicate no shift from recency to primacy with increased delay for
the olfactory modality. Additional testing is needed to address the possibility of a
recency-primacy shift with increased delay in the auditory modality.
Summary of findings
The present olfactory results, along with those of Reed (2000), indicate that primacy
and recency effects can be obtained within the olfactory modality. However, although SPE’s
can be obtained at a short delay, the lack of a recency-primacy shift when delay interval is
increased, suggests that SPE’s may not be directly comparable to those observed in the visual
modality.
The auditory results also indicate primacy and recency effects can be obtained within
the auditory modality. These results taken together with the olfactory results extend the
generality of the SPE. However, due to methodological concerns, no conclusions can be
drawn regarding the recency-primacy shift with increased delay interval in the auditory