University of Windsor University of Windsor
Scholarship at UWindsor
Scholarship at UWindsor
Electronic Theses and Dissertations Theses, Dissertations, and Major Papers
1-1-2005
Experimental studies and numerical simulations of continuous
Experimental studies and numerical simulations of continuous
and discontinuous chip formation during orthogonal cutting.
and discontinuous chip formation during orthogonal cutting.
Xiaodong Song University of Windsor
Follow this and additional works at: https://scholar.uwindsor.ca/etd
Recommended Citation Recommended Citation
Song, Xiaodong, "Experimental studies and numerical simulations of continuous and discontinuous chip formation during orthogonal cutting." (2005). Electronic Theses and Dissertations. 7113.
https://scholar.uwindsor.ca/etd/7113
EXPERIMENTAL STUDIES AND NUMERICAL
SIMULATIONS OF CONTINUOUS AND DISCONTINUOUS
CHIP FORMATION DURING ORTHOGONAL CUTTIING
b y
XIAODONG SONG
A Thesis
Submitted to the Faculty of Graduate Studies and Research
through Engineering Materials
in Partial Fulfillment of the Requirements for
the Degree of Master of Applied Science
at the University of Windsor
Windsor, Ontario, Canada
2005
1*1
Library and
Archives Canada
Published Heritage
Branch
395 W ellington Street Ottawa ON K 1A 0N 4 Canada
Bibliotheque et
Archives Canada
Direction du
Patrimoine de I'edition
395, rue W ellington Ottawa ON K 1A 0N 4 Canada
Your file Votre reference ISBN: 978-0-494-42292-2 Our file Notre reference ISBN: 978-0-494-42292-2
NOTICE:
The author has granted a non
exclusive license allowing Library
and Archives Canada to reproduce,
publish, archive, preserve, conserve,
communicate to the public by
telecommunication or on the Internet,
loan, distribute and sell theses
worldwide, for commercial or non
commercial purposes, in microform,
paper, electronic and/or any other
formats.
AVIS:
L'auteur a accorde une licence non exclusive
permettant a la Bibliotheque et Archives
Canada de reproduire, publier, archiver,
sauvegarder, conserver, transmettre au public
par telecommunication ou par Nntemet, preter,
distribuer et vendre des theses partout dans
le monde, a des fins commerciales ou autres,
sur support microforme, papier, electronique
et/ou autres formats.
The author retains copyright
ownership and moral rights in
this thesis. Neither the thesis
nor substantial extracts from it
may be printed or otherwise
reproduced without the author's
permission.
L'auteur conserve la propriete du droit d'auteur
et des droits moraux qui protege cette these.
Ni la these ni des extraits substantiels de
celle-ci ne doivent etre imprimes ou autrement
reproduits sans son autorisation.
In compliance with the Canadian
Privacy Act some supporting
forms may have been removed
from this thesis.
While these forms may be included
in the document page count,
their removal does not represent
Conformement a la loi canadienne
sur la protection de la vie privee,
quelques formulaires secondaires
ont ete enleves de cette these.
/ 0 2 1 2 - 9 V
ABSTRACT
The research performed in this thesis has been focused on the experimental and
numerical studies o f continuous chip formation o f commercially pure copper and
aluminum (1100 Al). Serrated chip formation o f vacuum high-pressure die cast aluminum
A380 alloy was also investigated.
To study deformation structures developed during continuous chip formation,
metallographic studies were performed on commercially pure copper and aluminum
workpieces subjected to dry orthogonal cutting experiments under different feed rates,
from 0.25 mm/rev to 0.8 mm/rev, while other machining parameters were kept constant.
Equivalent plastic strains in the primary and secondary deformation zones in the material
ahead o f the tool tip were determined by measuring displacements o f copper grain
boundaries and the orientation change o f flow lines in aluminum samples. The variations
o f local flow stresses were estimated from the microhardness measurements. A single
Voce type exponential stress-strain curve for each material was determined for different
feed rates. An Eulerian type finite element formulation in the explicit FE code LS-DYNA
was used to predict strain and stress distributions in the material ahead o f the tool tip.
The simulations were based on an elastic-plastic hydrodynamic material model.
Experimentally determined Voce type stress-strain relationship was used in the
development o f the material model.
For discontinuous chip formation, metallographic studies were performed on
A380 samples. Dry orthogonal cutting experiment were done at a constant feed rate o f
0.30 mm/rev and a cutting speed o f 0.4 m s'1. Equivalent plastic strains were determined
material ahead o f the tool tip. The variations o f local flow stresses were estimated from
the microhardness measurements. Local temperature increases due to deformation were
calculated by estimated plastic strains and flow stresses in the workpiece.
Metallographic observations on the cross-sections o f continuous chips and
numerical predictions showed that the chip thickness, the depth o f the deformed layer,
and the widths o f the primary and secondary deformation zones increased with the
increase o f the feed rate. Parametric analyses showed that the cutting force and the energy
consumption also increased with the feed rate. Formation o f adiabatic shear bands was
shown to be the main reason for serrated chip formation during cutting o f A3 80 alloy.
Flow localization in serrated chip formation may be attributed to the destabilizing effects
o f thermal softening, which can outweigh the effects o f strain and strain rate hardening in
To my parents
and
my husband Qingwu and my daughter Am y
ACKNOWLEDGEMENTS
I would like to express my sincere gratitude to m y supervisors Dr. Ahmet Alpas
and Dr. William Altenhof for their supervision, instructions and encouragement. Their
expertise has been o f great assistance throughout m y graduate studies.
M y sincere thanks to our group members: Dr. V. Stoilov, Dr. X. Nie, Dr. A.
Edrisy, Mr. M. Elmadagli, Mr. S. Akarca, Mr. E. Konca, Mr. H. Wang, Ms. A. Raczy, Ms.
H. Yu, Ms. M. Chen, Mr. L. Inci, Mr. M. Shafiei, and Mr. M. Yazdanian for their support
and friendship. I would like to extend m y thanks to Dr. T. Perry and Dr. Y. T. Cheng, o f
General Motors Research and Design Center, for their discussions and suggestions. Mr. J.
Robinson’s technical assistance and Ms. Q. T u’s (administrative assistant to NSERC/GM
IRC) and Ms. B. L. Denomey’s (secretary to Engineering Materials Program)
administrative assistance during my graduate studies are also gratefully acknowledged.
The financial assistance provided by NSERC (Nature Science and Engineering
Research Council o f Canada), General Motors o f Canada Limited through an Industrial
Research Chair Program under Dr. A.T. Alpas is gratefully acknowledged.
Finally, I would like to thank my husband, Qingwu, for his support and
encouragement throughout my graduate studies, and my daughter, Amy, who has become
TABLE OF CONTENTS
A BSTRACT...iii
DEDICATION...v
ACK NO W LEDG EM ENTS...vi
LIST OF T A BL E S... xii
LIST OF FIG U R ES... xiiv
LIST OF A PPEN D IC ES... xxi
NOM ENCLATURE...xxii
CHAPTER 1: Introduction... 1
1.1 Objectives o f the Studied Problem ... 1
1.2 Outline o f the T h e s is ...3
CHAPTER 2: Literature R ev iew ... 6
2.1 Basics o f Machining Operations and Theories...6
2.1.1 Types o f Machining Processes...6
2.1.2 Deformation Zones in the W orkpiece... 7
2.1.3 Principal Chip Types... 8
2.1.3.1 Continuous Chips...8
2.1.3.2 Continuous Chip with Built-up Edge...9
2.1.3.3 Discontinuous C hips... 9
2.1.4 Theoretical Models o f Chip Form ation... 10
2.1.4.1 Ernst and M erchant T h eo ry ... 10
2.1.4.2 Lee and Shaffer T h e o ry ...12
2.1.5 Mechanics o f Chip F orm ation... 13
2.1.5.1 Cutting Forces... 13
2.1.5.2 Stresses in the W orkpiece... 14
2.1.5.3 Strains and Strain R ates...17
2.1.5.4 Energy C onsum ption... 19
2.1.6 Temperature Increase and Its Effects on M achining...21
2.1.8 Mechanics o f Discontinuous (Serrated) Chip Formation... 25
2.2 Finite Element M odelling...31
2.2.1 Introduction...31
2.2.2 Comparison o f Lagrangian, Eulerian, and ALE Element Form ulations 32 2.2.3 Researches on Metal Cutting Using Finite Element M odelling... 33
2.2.3.1 Lagrangian Element Form ulation...33
2.2.3.2 Eulerian Element Form ulation... 41
2.2.3.3 ALE Element Formulation...43
2.3 Machining Parameters and Their Influences on Cutting P rocess...47
2.3.1 Rake Angle... 47
2.3.2 Cutting Speed... 48
2.3.3 Feed R a te ...50
CHAPTER 3 : Experimental and Numerical Studies on the Deformation State of Copper (the Effect o f Feed R a te)... 52
3.1 Test Materials and Orthogonal Cutting T e sts...52
3.2 Experimental Determination o f Deformation State o f the W orkpiece... 52
3.2.1 Deformation Microstructures o f the Workpiece M aterial Ahead o f the Tool Tip... 52
3.2.2 Strain and Stress Measurements Ahead o f Tool Tip in the Workpiece M aterial... 58
3.2.3 Determination o f Strain and Stress Distributions in the Workpiece Material Ahead o f the Tool T ip ...61
3.2.4 Stress-Strain Curve for the Cu Workpiece in Orthogonal C u ttin g...6 6 3.3 Finite Element Simulations...6 8 3.3.1 Geometry and Finite Element M e sh ...6 8 3.3.2 Workpiece and Tool Material M odeling... 71
3.3.3 Workpiece-tool C ontact...73
3.3.4 Boundary C onditions...73
3.4.1 Chip Thickness Predictions by Numerical Simulations... 73
3.4.2 Numerical Simulation Results o f Strain and Stress Distributions in the Workpiece Material Ahead o f the Tool T ip ... 75
3.4.3 Comparisons o f Computed Strain Distributions with Experimental Strains... 84
3.4.4 Comparisons o f Computed Stress Distribution with Experimental Stresses... 85
3.4.5 Comparison o f the Widths o f the Primary Deformation Zones between Experimental and Simulation R esults...8 8 3.4.6 Variations o f the Cutting Force and Energy Consumption with Feed R a te ...8 8 3.4.7 Temperature Distribution in the Workpiece M aterial Ahead o f the Tool T ip ...92
CHAPTER 4: Experimental and Numerical Studies on the Deformation State of 1100 Aluminum (the Effect o f Feed R ate)...95
4.1 Test Materials and Orthogonal Cutting T ests...95
4.2 Experimental Determination o f Deformation State o f the W orkpiece... 95
4.2.1 Deformation Microstructures o f the Workpiece M aterial Ahead o f the Tool Tip... 95
4.2.2 Strain and Stress Measurements Ahead o f Tool Tip in the Workpiece M aterial... 100
4.2.3 Determination o f Strain and Stress Distributions in the Workpiece Material Ahead o f the Tool T ip ...100
4.2.4 Stress-Strain Curve for the A1 Workpiece in Orthogonal C utting...108
4.3 Finite Element Simulations... 110
4.3.1 Geometry and Finite Element M e sh ... 110
4.3.2 Workpiece and Tool Material M odeling... 110
4.4 Predictions o f Workpiece Properties by Numerical Simulations and
Comparisons with Experim ents... 112
4.4.1 Chip Thickness Predictions by Numerical Simulations...112
4.4.2 Numerical Simulation Results o f Strain and Stress Distributions in the Workpiece Material Ahead o f the Tool T ip ... 114
4.4.3 Comparisons o f Computed Strain Distributions with Experimental Strains... 122
4.4.4 Comparisons o f Computed Stress Distribution with Experimental Stresses... 123
4.4.5 Comparison o f the Widths o f the Primary Deformation Zones between Experimental and Simulation R esults... 126
4.4.6 Variations o f the Cutting Force and Energy Consumption with Feed R a te ...126
4.4.7 Temperature Distribution in the Workpiece M aterial Ahead o f the Tool T ip ...130
CHAPTER 5: Experimental Studies of Discontinuous Chip Formation in A380 A llo y ...133
5.1 Orthogonal Cutting Tests and M etallographic Sample Preparation...133
5.2 Metallographic A nalysis...134
5.2.1 Phase Identification...134
5.2.2 Deformation Microstructure o f the W orkpiece...137
5.3 Strain Measurements and Distribution...144
5.4 Flow Stress Measurements and D istributions...146
5.5 Temperature D istribution... 148
5.6 D iscussion... 150
CHAPTER 6: General Discussion...153
6.1 Generalization o f Stress-Strain State o f Ductile Material Subjected to Orthogonal C u ttin g ...153
6.2.2 Widths o f the Primary and Secondary Deformation Z o n e s... 155
6.2.3 Strain and Stress... 158
6.2.4 Cutting Force and Energy Consumption...159
CHAPTER 7: Conclusions and Suggestions for Future W ork... 161
7.1 Conclusions... 161
7.2 Suggestions for Future W o rk... 165
REFERENCES...166
APPENDICES...176
PUBLICATIO NS... 191
LIST OF TABLES
Chapter 3:
Table 3.1 Flow stress versus equivalent plastic strain data points used in hydrodynamic material m o d e l... 72
Table 3.2 The calculated specific work o f plastic deformation under three different feed ra te s... 92
Chapter 4:
Table 4.1 Flow stress versus equivalent plastic strain data points used in hydrodynamic material m o d e l... I l l
Table 4.2 The calculted specific work o f plastic deformation under three different feed ra te s... 129
Chapter 6:
Table 6.1 Comparison o f strain values in the workpiece o f copper and aluminum ahead o f the tool tip ...158
Table 6.2 Comparison o f flow stress values in the workpiece o f copper and aluminum ahead o f tool t i p ...159
LIST OF FIGURES
CHAPTER 2:
Figure 2.1 (a) Schematic diagram o f the turning process, and (b) workpiece and tool geometry during the process o f orthogonal metal cutting, where tc is the chip thickness, a is the rake angle, 7 is the clearance angle, vc is
the cutting speed, and t is uncut chip thickness... 7
Figure 2.2 Schematic diagram o f deformation zones on a cross-sectioned workpiece undergoing orthogonal cutting, where <|> is the prim ary shear plane angle...8
Figure 2.3 Force diagram developed by Ernst and M erchant [6], with the assumption o f a single shear plane...11
Figure 2.4 Lee and Shaffer’s slip-line field model for orthogonal cutting [9, 10]... 13
Figure 2.5 Model o f stress distribution 011 tool during cutting [5]...17
Figure 2.6 Schematic representation o f shear strain in metal cutting process [17]... 18
Figure 2.7 Equivalent strain distribution in the material (6061 Al) ahead o f the tool tip, obtained from the work o f Zhang and Alpas [18]...19
Figure 2.8 Rate o f plastic work as a function o f shear angle, obtained from W right’s work [19]... 21
Figure 2.9 The work o f plastic deformation per unit volume o f Cu workpiece material (MJ-nT3) between each increment o f equivalent strain, obtained from the work o f Elmadagli and Alpas [2]... 23
Figure 2.10 Temperature distribution o f Cu workpiece subjected to orthogonal cutting, obtained from the work o f Elmadagli and Alpas [2]...23
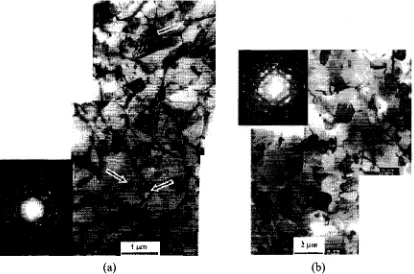
Figure 2.11 TEM micrographs o f 1100 Al workpiece subjected to dry orthogonal machining: (a) TEM micrograph showing the microstructure formed in the primary deformation zone; (b) TEM micrograph showing the microstructure formed in the secondary deformation zone. Obtained from the work o f N i, Elmadagli, and Alpas [24]... 25
Figure 2.12 Serrated chip due to the shear localization in chips [26]...26
Figure 2.14 (a) Transformed shear band in hot rolled titanium alloys, and (b) deformed shear band in a 7039 aluminum alloy [29]... 28
Figure 2.15 Thermal diffusivity at room temperature o f different metals plotted against their resistance to adiabatic shear localization [29]...29
Figure 2.16 Comparison o f Lagarangian, Eulerian, and ALE mesh [35]... 32
Figure 2.17 Geometrical separation method: (a) before node separation; (b) after node separation, obtained from Lin and Lo’s w ork [38]...35
Figure 2.18 Contours o f equivalent plastic strain and stress in simulating orthogonal machining o f mild steel, obtained from the work o f Mamalis [39]... 35
Figure 2.19 Effect o f friction on the cutting force and maximum temperature for various rake angle values, obtained from the work o f Shi, Deng, and Shet. [42]... 38
Figure 2.20 Stress distributions (MPa) during (a) continuous and (b) segmental chip formation, obtained from the work o f N g and Aspinwall [48]...40
Figure 2.21 Deformed mesh and distribution o f effective plastic strain using ALE formulation during numerical simulation o f steel, obtained from the work o f Olovsson, Nilsson, and imonsson. [59]...44
Figure 2.22 Simulation results from Pantal© [61] representing cutting 42CrMo4 steel using ALE formulation: (a) Chip formation and temperature field in 2D modelling; Von Mises stresses distribution at time t = 0.4 ms and time t = 1.5 ms in 3D modelling...46
Figure 2.23 Plastic strain (1) and effective stress (2) contours during steady-state orthogonal cutting process under different rake angles: (a) a = -2°, (b)
a = 0°, (c) a = 5°, (d) a = 15°, obtained from the w ork o f Shih [63]... 49
Figure 2.24 Chip morphology: (a) experimental results; (b) simulation results, obtained from the work o f Hua and Shivpuri [65]... 50
CHAPTER 3:
Figure 3.2 Optical cross-sectional micro structures o f workpiece material (Cu) ahead o f the tool tip, which have undergone orthogonal cutting: (a) feed rate = 0.25 mm/rev, (b) feed rate = 0.50 mm/rev, and (c) feed rate = 0.80 m m/rev... 55
Figure 3.3 The variation o f the microhardness o f the material (Cu) ahead o f the tool tip under three different feed rates: (a) feed rate = 0.25 mm/rev, (b) feed rate = 0.5 mm/rev, and (c) feed rate=0.80 m m /rev... 59
Figure 3.4 Strain distributions in the workpiece material(Cu) ahead o f the tool tip under three different feed rates from experimental results: (a) feed rate = 0.25 mm/rev, (b) feed ra te - 0.50 mm/rev, and (c) feed rate = 0.80 mm/rev...62
Figure 3.5 Stress distributions in the workpiece material(Cu) ahead o f the tool tip under three different feed rates from experimental results: (a) feed rate = 0.25 mm/rev, (b) feed rate = 0.50 mm/rev, and (c) feed rate = 0.80 mm/rev...64
Figure 3.6 (a) Stress-strain relationship o f commercial purity copper subjected to orthogonal cutting, and (b) Variation o f the work hardening rate with the flow stress... 67
Figure 3.7 Schematic diagram o f the finite element model o f the tool and the workpiece (Cu): (a) 3D view showing the geometry o f specific parts o f the finite element model and xy symmetry planes; (b) cross-sectional view showing element distribution... 70
Figure 3.8 Cross-sectional chip (Cu) geometry under different depths o f cut at time o f 15 ms: (a) depth o f cut t = 0.25 mm; (b) depth o f cut t = 0.5 mm; (c) depth o f cut t = 0.8 mm. Chip thicknesses are (a) 0.95 mm, (b)1.7 mm, and (c) 2.4 mm respectively...74
Figure 3.9 Comparison o f chip (Cu) thickness between experimental and simulation results under different feed rates (depths o f cut)... 75
Figure 3.10 Strain contours in the workpiece material (Cu) ahead o f the tool tip under different depths o f cut from LS-POST when simulation time was
15 ms: (a) depth o f cut = 0.25 mm; (b) depth o f cut = 0.5 mm; (c) depth o f cut = 0.8 m m ... 77
Figure 3.12 Strain distributions in the workpiece material (Cu) ahead o f the tool tip under different depths o f cut from simulation predictions : (a) depth o f cut = 0.25 m m ; (b) depth o f cut = 0.5 mm; (c) depth o f cut = 0.8 m m ... 80
Figure 3.13 Stress distributions in the workpiece material (Cu) ahead o f the tool tip under different depths o f cut from simulation predictions : (a) depth o f cut = 0.25 mm; (b) depth o f cut = 0.5 mm; (c) depth o f cut = 0.8 m m 82
Figure 3.14 Comparison o f plastic strain between experimental and simulation results (Cu) under different feed rates (depths o f cut) along the primary shear plane: (a) 0.25 mm; (b) 0.50 mm; (c) 0.80 m m ...8 6
Figure 3.15 Comparison o f flow stress between experimental and simulation results (Cu) under different feed rates (depths o f cut) along the primary shear plane: (a) 0.25 mm; (b) 0.50 mm; (c) 0.80 mm. Unit: M P a ...87
Figure 3.16 Comparison o f the width o f primary deformation zone calculated from experimental observations and simulation results under three different feed rates (depths o f cut)(Cu workpiece)...8 8
Figure 3.17 The cutting force versus time curves under different depths o f cut for copper from simulation results...90
Figure 3.18 Variations o f the cutting force and energy consumption with depth o f cut from simulations (Cu)... 90
Figure 3.19 Temperature distributions in the workpiece material(Cu) ahead o f the tool tip under three different feed rates from experimental results: (a) feed rate = 0.25 mm/rev, (b) feed rate = 0.50 mm/rev, and (c) feed rate = 0.80 mm/rev... 93
CHAPTER 4:
Figure 4.1 Optical cross-sectional microstructures o f workpiece material (Al 1 1 0 0) ahead o f the tool tip, which have undergone orthogonal cutting: (a) feed rate = 0.25 mm/rev, (b) feed rate = 0.50 mm/rev, and (c) feed rate = 0.80 mm/rev...97
Figure 4.2 The variation o f the microhardness o f the material (Al 1100) ahead o f the tool tip cut using different feed rates: (a) feed rate = 0.25 mm/rev, (b) feed rate = 0.5 mm/rev, and (c) feed rate = 0.80 m m /rev...102
rates: (a) feed rate = 0.25 mm/rev, (b) feed rate = 0.50 mm/rev, and (c) feed rate = 0.80 mm /rev... 104
Figure 4.4 Experimentally determined stress distributions in the workpiece material (1100 Al) ahead o f the tool tip cut using different feed rates from experimental results: (a) feed rate = 0.25 mm/rev, (b) feed rate = 0.50 mm/rev, and (c) feed rate = 0.80 mm/rev...106
Figure 4.5 (a) Stress-strain relationship o f 1100 aluminum subjected to orthogonal cutting, and (b) Change o f the work hardening rate with the flow stress...109
Figure 4.6 Cross-sectional chip (1100 Al) geometry under different depths o f cut at time o f 15 ms: (a) depth o f cut t = 0.25 mm; (b) depth o f cut t = 0.5 mm; (c) depth o f cut t = 0.8 m m ... 113
Figure 4.7 Comparison o f chip (1100 Al) thickness between experimental and simulation results under different feed rates (depths o f cut)...113
Figure 4.8 Strain contours in the workpiece material (1100 Al) ahead o f the tool tip under different depths o f cut from LS-POST when simulation time was 15 ms: (a) t = 0.25 mm; (b) t = 0.50 mm; (c) t = 0.80 m m ...115
Figure 4.9 Stress (in kPa) contours in the workpiece material (1100 Al) ahead o f the tool tip under different depths o f cut from LS-POST when simulation time was 15 ms: (a) t = 0.25 mm; (b) t = 0.50 mm; (c) t = 0.80 m m ...116
Figure 4.10 Numerically determined strain distributions in the workpiece material (1100 Al) ahead o f the tool tip under different depths o f cut: (a) t = 0.25 mm; (b) t = 0.50 mm; (c) t = 0.8 m m ...118
Figure 4.11 Numerically predicted stress distributions in the workpiece material (1100 Al) ahead o f the tool tip under different depths o f cut: (a) t = 0.25 mm; (b) t = 0.50 mm; (c) t = 0.80 m m ... 120
Figure 4.12 Comparison o f plastic strain between experimental and simulation results (1100 Al) under different feed rates (depths o f cut) along the primary shear plane: (a) 0.25 mm; (b) 0.50 mm; (c) 0.80 m m ... 124
Figure 4.14 Comparison o f the width o f primary deformation zone (PDZ) calculated from experimental observations and simulation results under three different feed rates (depths o f cut) (workpiece: 1100 A l) 126
Figure 4.15 The cutting force versus time curves under different depths o f cut for 1100 aluminum from simulation results... 127
Figure 4.16 Variations o f the cutting force and energy consumption with feed rate (depth o f cut) from simulations (workpiece: 1100 A l)... 128
Figure 4.17 Temperature distributions in the workpiece material(Cu) ahead o f the tool tip under three different feed rates from experimental results: (a) feed rate = 0.25 mm/rev, (b) feed rate = 0.50 mm/rev, and (c) feed rate = 0.80 mm/rev...131
CHAPTER 5:
Figure 5.1 (a) and (b) Back scattered SEM images and phases o f A 3 8 0 ... 135
Figure 5.2 EDS spectrum o f A380: (a) EDS spectrum o f the aluminium matrix; (b) EDS spectrum o f silicon phases; (c) EDS spectrum o f AI2CU in light gray color; (d) EDS spectrum o f an iron-rich phase with a composition o f A li5(Fe, M n)3Si2; (e) EDS spectrum o f an iron-rich phase with a composition o f A li2(Fe, Mn, Cr)3Si2 in light gray colour;
(f) EDS spectrum o f Fe-Cu-Si phase in needle shape...136
Figure 5.3 Optical cross-sectional microstructure o f A380 (as-cast condition) ahead o f the tool tip, which have undergone orthogonal cutting, where cutting speed was 800 m/min, and feed rate was 0.30 m m /rev...139
Figure 5.4 Optical cross-sectional microstructure o f A380 (solution treated at 480 °C for 12 hours and water quenched) ahead o f the tool tip, which have undergone orthogonal cutting, where cutting speed = 800 m/min, and feed rate - 0.30 mm/rev... 140
Figure 5.5 Optical images o f workpieces at the tool tip, which show the particle flows in the workpiece at the tool tip: (a) A 380 (as-cast); (b) A380 (solution treated at 480 °C for 12 hours + water quench)...141
Figure 5.6 (a) Optical micrograph o f A380 as-cast condition microstructure (aspect ratio = 3.7, sphericity = 0.35 ) ...142
80m/min, and feed rate = 0.25 mm/rev. Pictures were take from the elliptic area in Figure 5.5... 143
Figure 5.8 Schematic drawing o f equivalent plastic strain measurement... 145
Figure 5.9 Schematic drawing o f the shear displacement within the shear band ds and the thickness o f the shear band ts... 145
Figure 5.10 Strain distribution o f A380 (solution treated) ahead o f the tool tip 146
Figure 5.11 Microhardness o f A380 (solution treated) ahead o f the tool tip... 147
Figure 5.12 Stress distribution o f A380 (solution treated) ahead o f the tool tip 148
Figure 5.13 Temperature distribution o f A380 (solution treated) ahead o f the tool tip...149
Figure 5.14 Al-Si binary phase diagram, the Si content for A380 is 7.5-9.5 %. [81]... 150
Figure 5.15 SEM image showing voids and fractured particles in A380 (solution treatment): (a) near the tool tip, and (b) near the adiabatic shear band (taken from the square area in Figure 5.7)...152
CHAPTER 6:
Figure 6.1 Stress-strain relationship o f commercial purity copper and aluminum subjected to orthogonal cutting... 154
Figure 6.2 Variation o f the work hardening rate with the flow stress for copper and aluminum... 154
Figure 6.3 Comparison o f chip thicknesses between copper and aluminum from (a) experimental and (b) simulation results under three different feed rates (depths o f cut)... 156
Figure 6.4 Comparison o f the width o f the primary deformation zone (PDZ) between copper and aluminum from experimental and simulation results under three different feed rates (depths o f cut)... 157
Figure 6 .6 Comparison o f cutting force and energy consumption between copper and aluminum from simulation results under three different depths o f cut...160
Appendices:
LIST OF APPENDICES
APPENDIX A Introduction to Finite Element Analysis...176
APPENDIX B LS-DYNA Fundamentals... 179
APPENDIX C Sample LS-DYNA Input File for Copper Using Eulerian
Formulation... 182
APPENDIX D Sample LS-DYNA Input File for Al 1100 Using Eulerian
Formulation... 186
NOMENCLATURE
a Rake angle: the angle between the rake face o f the tool and the direction
perpendicular to the cutting direction
y Clearance angle: angle between the clearance face o f the tool and the cutting
direction
f Feed rate: the lateral distance traveled by the tool during one revolution
during turning process
vc Cutting speed: the surface speed o f the lathe rotation in a turning operation
tc Chip thickness: distance between the tool rake face and the free surface o f
the chip
t Depth o f cut or uncut chip thickness: distance between the machined surface
exposed in the current tool pass and previous tool pass
w Width o f the chip that equals to the depth o f cut in turning process
<j) Shear (plane) angle: angle between the cutting direction and the shear plane
p Coefficient o f friction between the tool and the workpiece
R Resultant tool force acting at the tool cutting edge
Fc Cutting force: force measured along the cutting direction
Ft Thrust force: force measured along a direction perpendicular to the cutting
direction
Fs Shear force measured along the shear plane
Ff Friction force measured along the rake face o f the tool
N s Normal force measured along a direction perpendicular to the shear plane
Nf Normal friction force measured along a direction perpendicular to the rake
face
/3 Mean chip-tool friction angle on tool face and given by arctan Ff/N f
7S Shear stress at the shear plane
7f Shear stress at the tool-chip interface
fff Normal stress on the rake face
omax Maximum normal stress at the tool tip
y Shear strain
y Shear strain rate
P Total energy consumption during the metal cutting process
Wp The rate o f plastic deformation work done in the prim ary shear zone
Ws The rate o f plastic deformation work done in the secondary shear zone
1 Chip-tool contact length
p Density
E Young’s modulus
G Shear modulus
v Poisson’s ratio
H Hardness
gP or g Equivalent plastic strain
£ Equivalent plastic strain rate
0 Deformation angle
a Flow stress accumulated in a material
0’s Saturation stress: stress at which the work hardening becomes zero
O'o Yield stress at which the work hardening becomes zero
Cp Specific heat capacity o f a material
k Thermal diffusivity o f a material
T Temperature
Tmeit Melting temperature o f a material
Tamb Ambient temperature
r| The fraction o f plastic work converted to heat
Sjj Deviatoric stress tensor
£>p Plastic component o f the deformation rate tensor
C Bulk sound speed
Si, S2, S3 Linear, quadratic, and cubic coefficients relating material shock velocity to
particle velocity respectively
y0 Griineisen gamma
a The first order volume correction to yo
ds Shear displacement within the shear band
CHAPTER 1
Introduction
1.1 Objectives o f the Studied Problem
Metal cutting is a manufacturing process by which unwanted material is removed
to obtain the desired shape, dimensions and surface roughness. Although extensive
research has been carried out on the development o f a general theory o f the machining
process, only a few o f the output parameters o f practical machining operations, such as
cutting force and power consumption, could be quantitatively predicted because o f the
complexity o f the interactions between various parameters. The cutting tool, and
workpiece properties as well as the combinations o f operation parameters exert different
influences on the workpiece-tool-cutting conditions. These in turn determine the
efficiency o f a given machining process as well as the quality o f the surface finish and
dimensional accuracy. Cutting fluids have often been utilized in the machining process to
increase tool life and improve surface finish. Due to increasing government demands for
environmentally safe handling o f cutting fluids, dry machining is becoming an
increasingly important way to seeking benefits o f cutting fluids cost savings and
environmental safety.
Metallographic studies on the plastic deformation behaviour o f selected workpiece
materials during the chip formation process have been conducted by Zhang [1] and
Elmadagli and Alpas [2]. A method using the microstructural information was developed
to determine the shear angles and to calculate the strain and stress distributions during
machining parameters, previous work has been extended and parametric studies were
performed experimentally and numerically for the first time in this research.
The direct experimental approach to study the metal cutting process is expensive
and time consuming, especially when a wide range o f parameters needs to be studied,
such as tool geometry, materials, cutting conditions. Therefore, modelling o f cutting
process using finite element analysis programs has become an effective alternative. The
versatility o f the finite element method is its ability to take into account large deformation,
strain rate effect, tool-chip contact and friction, local heating and temperature effect,
different boundary conditions, and other phenomena encountered in metal cutting
problems. The challenge in modelling metal cutting processes is that although various
studies have been made to investigate the material behaviour in the machining process,
there is still no satisfactory materials constitutive model as a function o f strain, strain rate,
and temperature to properly describe the material behaviour during the cutting process.
The m ajority o f the research has utilized the Lagrangian formulation to model metal
cutting process. However, during modeling o f ductile materials, severe mesh distortion
occurs due to large strains and strain rates generated during metal cutting resulting in a
degradation o f the simulation accuracy, chip separation criterion and mesh adaptivity are
among the common techniques used to compensate for mesh distortion and disintegration,
which is not an accurate representation o f the actual behaviour o f material deformation.
In the Eulerian approach, the material can “flow” through the stationary Eulerian mesh.
Therefore, no severe mesh distortion occurs and chip separation criterion is not needed. It
has been successfully used to predict the deformation state o f copper ahead o f the tool tip
The objective o f this study is to extend previous experimental and numerical work
to investigate the role o f one o f the most important parameters (feed rate) affecting
cutting force and energy consumption at the tool tip. This research were focused on
experimental and numerical studies o f continuous and discontinuous chip formation in
selected workpiece materials subjected to orthogonal machining. This study has been
undertaken to understand details o f metal deformation state and energy expenditure due to
localized plastic deformation, which is essential to find optimum conditions in machining.
The methods used in the study o f discontinuous chip formation provide some new
insights in the orthogonal cutting process.
1.2 Outline o f the Thesis
The thesis is organized into seven chapters. Chapter I provides an introduction to
the problem studied and the layout o f the thesis.
Chapter II reviews previous studies on metal cutting processes. Theoretical
investigations, experimental and numerical studies on chip formation, cutting force
measurement, strain, stress, and temperature distributions in the workpiece material ahead
o f the tool tip are reviewed. Research on the investigation o f the parameters that influence
cutting process is also introduced.
Chapter III describes the experimental studies and numerical simulations o f the
effect o f feed rate on the deformation state o f copper subjected to orthogonal cutting.
Equivalent plastic strains in the primary and secondary deformation zones were
determined by measuring displacements o f grain boundaries in the material ahead o f tool
measurements. A single Voce type relationship between flow stress and equivalent plastic
strain generated in the deformed material ahead o f tool tip under three different feed rates
was established. An Eulerian finite element formulation that uses the explicit FE code LS-
DYNA was adopted for numerical simulations o f the metal cutting process. Numerical
results, which included predicted strain and stress distributions, cutting forces, and energy
consumptions are presented and compared with experimental measurements in this
chapter.
Chapter IV presents the experimental studies and numerical simulations o f the
effect o f feed rate on the deformation state o f commercial purity aluminum (1100 Al)
subjected to orthogonal cutting. The procedures and method performed on aluminum are
the same as copper.
Chapter V describes the experimental studies o f discontinuous (serrated) chip
formation o f A380 alloy, which contains 7.5-9.5 wt % Si particles. Equivalent plastic
strains were determined by measuring the orientation changes o f the alignment o f
fractured particles in the material ahead o f the tool tip. The variations o f local flow
stresses were estimated from the microhardness measurements. Deformation induced
temperature distributions ahead o f the tool tip were calculated by estimated plastic strains
and flow stresses in the workpiece. The deformed material was also studied by SEM and
characteristics in discontinous chip formation in A380 alloy are also presented.
Chapter VI is an overall discussion o f the results. It presents a general discussion
o f the stress-strain relationship o f ductile materials subjected to orthogonal cutting. In this
consumptions o f copper and aluminum under three different feed rates are compared and
discussed.
The conclusions drawn from experimental and numerical observations are
presented in Chapter VII. The original contributions o f this work are emphasized and
CHAPTER 2
Literature Review
Machining covers a large collection o f manufacturing processes to obtain the
desired shape, dimension and surface roughness. During machining, unwanted material is
removed, usually in the form o f chips. Machining is a highly non-linear deformation
process coupled with thermomechanical events. Most o f the mechanical work is
converted into heat through the plastic deformation during chip formation as well as
frictional work between the tool, chip and workpiece. A good understanding o f machining
process is very important in order to control the product dimensions, the workpiece
surface characteristics and the tool life, hi this section, the literature on the theoretical
models and mechanics o f chip formation is presented. Research work on the finite
element modelling o f metal cutting is introduced. The previous studies on machining
parameters and their influences on cutting process are also reviewed.
2.1 Basics o f Machining Operations and Theories
2.1.1 Types of Machining Processes
The three most widely used machining operations are: i) turning, ii) milling, and
iii) drilling [4]. Turning is a process that uses a single point tool to remove unwanted
material to produce a surface o f revolution. The operation is accomplished on a lathe.
Milling is a process for producing flat and curved surfaces using multipoint cutting tools
by a milling machine. Drilling operation is a complex process and uses a rotating drill to
A schematic o f the turning process is show in Figure 2.1. The two dimensional
orthogonal cutting process is the most widely used method in machining research because
o f its simplicity. Orthogonal cutting uses a single cutting edge. The most important
characteristic o f this configuration is that the velocity o f the workpiece is orthogonal to
the cutting edge. Models o f the orthogonal machining are useful for understanding the
basic mechanics o f machining and can be extended to modelling o f the production
processes. These models will be reviewed in section 2.1.4.
V-Workpiece
ix
T o o l
% !i§ p
free surface rake face
chip root chip
tool tip
workpiece
cutting direction — Vc
Figure 2.1 (a) Schematic diagram o f the turning process, and (b) workpiece and tool geometry during the process o f orthogonal metal cutting, where tc is the chip thickness, a is the rake angle, y is the clearance angle, vc is the cutting speed, and t is uncut chip thickness.
2.1.2 Deformation Zones in the Workpiece
The basic mechanism involved in metal cutting is that o f a localized shear
deformation o f the work material immediately ahead o f the cutting edge o f the tool [5].
The relative motion between the tool and the workpiece during cutting compresses the
deformation zone, PDZ) at the base o f the chip. The chip passes over the rake face o f the
cutting tool and receives additional deformation (called the secondary deformation zone,
SDZ) because o f the shearing and sliding o f the chip against the tool [5] (Figure 2.2),
large strains and strain gradients are generated in these areas.
Chip
Primary Deformation Zone Secondary Deformation Zone
Tool Tip
Workpiece Machined Surface
Figure 2.2 Schematic diagram o f deformation zones on a cross-sectioned workpiece undergoing orthogonal cutting, where <j) is the prim ary shear plane angle.
2.1.3 Principal Chip Types
2.1.3.1 Continuous Chins
This type o f chip tends to generate in ductile material such as brass, low carbon
steels, or ductile aluminum alloys machined at high speeds and small feeds and depths o f
cut [4,5]. Chips o f this type are severely deformed and have a characteristic “curly”
geometry. These long chips are difficult and dangerous to handle because they m ay wrap
2.1.3.2 Continuous Chip with Built-up Edge
A built-up edge (BUE) forms when some work material that is deposited on the
rake face near the cutting edge. A BUE modifies the geometry o f the tool and also causes
generation o f high localized temperatures at the tool - chip interface. A BUE tends to
grow until it reaches a critical size and then passes o ff with the chip. Build-up edge
formation can often be eliminated or minimized by reducing the depth o f cut, increasing
the cutting speed, using positive rake tools, or applying coolant [4,5,10].
2.1.3.3 Discontinuous Chips
Discontinuous chips are characterized by the chip breaking into small segments.
Fracture is a dominant mechanism in forming discontinuous chips. As a result, chips
continuously break and re-form because the material is unable to undergo large amounts
o f plastic deformation. It occurs in brittle materials, such as cast iron, machined at low
cutting speed or at high tool-chip friction and large feed and depth [4,5].
Serrated chips are partially discontinuous chips in which cracks do not penetrate
the chip thoroughly, or completely break the chip. It is the consequence o f localization
shear into shear bands (also called adiabatic shear, see section 2.1.8), which results from
competition o f thermal softening and strain hardening mechanisms in the primary shear
zone. This type o f chips are likely to form during the machining o f materials with poor
thermal properties and high hardness, such as titanium alloys, and some hardened alloy
2.1.4 Theoretical Models o f Chip Formation
There have been extensive attempts in the past to derive a complete chip
formation theory from different points o f view. Unfortunately, there is no theory that can
accurately predict this complicated process because various oversimplified assumptions
that had to be made. Among them, the single shear plane theory o f Ernst and Merchant
[6,7,8], and the slipline theory o f Lee and Shaffer [9, 10] are most commonly referred to
in the literature.
2.1.4.1 Ernst and Merchant Theory
Ernst and Merchant developed a cutting force diagram [6] with the assumption
that strains are localized on a single shear plane (Figure 2.3). In their analysis, the chip is
assumed to behave as a rigid body held in equilibrium by the action o f the forces
transmitted across the chip-tool interface and across the shear plane in Figure 2.3. R is the
resultant tool force acting at the tool cutting edge. It is resolved into two components: i)
the cutting force, Fc, and ii) the thrust force, Ft. R is also resolved into Fs and N s as the
shear and normal forces on the shear plane, and Ff and Nf as the friction and normal
forces on the rake face, (j) is the shear angle and a is the rake angle o f the cutting tool. P is
the mean chip-tool friction angle on the tool face and given by arctan Ff /Nf.
The Ernst and M erchants’ theory suggested that the shear angle, (j), would take up
a value that would reduce the work done in cutting to a minimum. The required value is
given by:
Merchant also assumed that the dependence o f the shear stress, r s, on the normal stress, <JS,
at the shear plane by a relationship as given by:
+ kas (2-2)
which indicates that the shear strength o f the material xs increases linearly with an
increase in the normal stress cts, on the shear plane. To is the shear flow stress at zero
plastic strain. It is also assumed that k and To are constants for the particular work
material. Incorporating the force relations and after some conversions, the resulting
expression is
2(|) + p - a = C (2-3)
where C is given by arccot k and is a constant for the work material.
Chip
Shear Plane
Tool
N f
Workpiece
Figure 2.3 Force diagram developed b y Ernst and M erchant [6], w ith the assum ption o f a
2.1.4.2 Lee and Shaffer Theory
The theory o f Lee and Shaffer [9,10] was the result o f studies aimed at applying
the plasticity theory to the problem o f orthogonal metal cutting. The following
assumptions were made: 1) the material behaves as an ideal plastic, which does not strain-
hardened; 2) the shear plane represents a direction o f maximum shear stress.
The slip-line field proposed by Lee and Shaffer for orthogonal cutting o f a
continuous chip is shown in Figure 2.4. It can be seen that like Merchant, Lee and
Shaffer [9, 10] have employed the idealized single shear plane model o f cutting, where all
the deformation takes place in a plane extending from the tool cutting edge to the point o f
intersection o f the free surfaces o f the work and chip. The triangular region ABC is
plastically rigid and subjected to a uniform state o f stress, which equals to the yield
strength o f the workpiece material. Both sets o f slip lines are straight in the stress field,
being parallel with AB and DC respectively. If the boundaries o f this triangular zone are
considered, it is clear that the shear plane AB must give the direction o f one set o f slip
lines since the maximum shear stress must occur along the shear plane. Also, since no
forces act on the chip after it has passed through the boundary AC, no stresses can be
transmitted across this boundary. Thus, AC can be regarded as a free surface, and since
the directions o f maximum shear stress always meet a free surface at u/4, the angle CAB
is equal to 7t/4. Finally, assuming that the stresses acting at the chip-tool interface are
uniform (an unreasonable assumption, as shown in section 2.1.5.2), the principal stresses
at the boundary BC will meet this boundary at angle P and p + tc/2. Directions o f
maximum shear stress lie at rt/4 to the directions o f principle stress, and thus the angle
which is the required shear angle solution.
Because the workpiece was assumed to be rigid and perfectly plastic, it can not
reflect the reality that the yield strength changes with changes in strain, strain rate, and
temperature.
Figure 2.4 Lee and Shaffer’s slip-line field model for orthogonal cutting [9, 10]
2.1.5 Mechanics o f Chip Formation
2.1.5.1 Cutting Forces
Fc and Ft can be measured by a dynamometer mounted in the tool holder [5], then
the relationship between the various forces can be easily derived from the force
equilibrium diagram assumption [7] (Figure 2.3).
^ B
Shear force on shear plane:
Fs = Fc • (cos<|>) - Ft- (sin(|>) (2-5)
Normal force on shear plane:
N s = Fc- (sin4») + Ft- (cos(|)) (2-6)
Friction force on rake face:
Ff = Fc- (sina) + F t- (cosa) (2-7)
Normal force on rake face:
Nf = Fc- (cosa) - Ft- (sina) (2-8)
These results are valid for the perfect orthogonal cutting process only, where the
radial force is zero, only the cutting force is exerted on the sharp tool, and the forces
along the shear plane are uniformly distributed.
2.1.5.2 Stresses in the Workpiece
(1) Stresses on the Shear Plane
The shear plane is generally modeled to have uniform distributions o f both shear
and normal forces over its entire area. Thus, the shear stress xs and normal stress a s can be
computed as [5]:
x = Fc • cosc|) - Ft • sin(|) s t • w/sin<|)
Fc smj, + F ,.c o s f t • w
where t is the uncut chip thickness (see Figure 2.1) that equals to the feed rate, and w is
the width o f the chip that equals to the depth o f cut in turning process. The results o f the
cutting processes, especially when the strain is higher than 1 and the strain rate is around
103 to 105 s'1 [11].
(2) Stresses Distributions on the Rake Face
The nature o f the tool/chip interface and the distribution o f the shear and normal
stresses are critical in understanding the cutting process and the performance o f cutting
tools. The high stresses, coupled with the high temperatures and large strains in the chip
adjacent to the tool face, make the secondary shearing process difficult to model.
A typical analysis o f the forces and stresses on the rake face assumes that
Columbic sliding friction is present, and that the stresses are uniformly distributed [5].
The coefficient o f friction is velocity dependent: increasing speeds result in lower friction.
The shear stress at the interface, i f , and the normal stress on the rake face, fff, can be
written as [5]:
Fp • sina + N«, • cosa .. „..
xf = - w • 1r (2_11)
Fr - c o s a - N , -sin a _ _
0 f = -5 - s (2-12)
w • 1
where 1 is the length o f sliding contact. A value o f 215 M Pa normal stress on the rake face
was calculated in Zhang’s work [12] for a 6061 aluminum sample. The measured cutting
force and thrust force were 410 N and 240 N respectively. The rake angle was -5° and the
shear angle was 15°. The length o f sliding contact was 200 pan, and the width o f the chip
was 3.0 mm.
Above models have been found to be useful approximations o f the behaviour o f
the chip as it slides over the tool. However, when cutting metals and alloys, over a large
to such an extent that normal sliding cannot occur. This condition is termed “seizure” [9],
In most modem industrial machining operations, high compressive stress, very large
amounts and high rates o f strain, the cleanliness o f the work material in contact with the
tool leads to the prediction that the seizure at the interface could not be avoided [13].
Such studies have revealed two major regions on the rake face with respect to flow:
seized region and sliding region (Figure 2.5). Because o f the high interface temperatures
i.e. 650-900 °C when cutting steel [14], and pressures, i.e. 1000-1500 M Pa [14], the
material adjacent to the tool surface is almost stationary, and relative shearing takes place
in the chip. As originally developed by Zorev [15], the variation o f normal stress C7f along
the rake face is determined by a power law:
^max (2-13)
1
where a max is the maximum normal stress at the tool tip (i.e. x = 1), 1 is the total length o f
contact o f the chip on the tool, x is the distance from the point at which the chip leaves
the tool to the point o f interest, and n is the exponent which dependent on the material and
tool properties.
It was suggested that the shear stress xf has a constant value over the seizure
region because the chip material shears internally. Over the sliding region, the shear and
normal stresses are related by the Coulomb law o f friction [16]:
Workpiece
Normal stress, (Jt
Chip Shear stress, x
Point at which chip leaves tool
Seized region, Is Sliding region, If
Tool
Figure 2.5 Model o f stress distribution on tool during cutting [5].
2.1.5.3 Strains and Strain Rates
Strain and strain rates generated during metal cutting were first calculated by
Merchant [17] (Figure 2.6). The results o f the analysis are as follows:
Shear angle: (j) = tan 1/ r - c o s a N l - r - s i n a v
t Where r = —
t
Shear strain: y = tan(<j)-a)+cot(|) or y = c o sa sin § • cos((|) - a )
Shear strain rate: y = cosa
(2-15)
(2-16)
(2-17) cos((p - a) Ay
where Ay is the thickness o f the shear band (narrow band that produce a lamellar structure
cutting tool, the rake face angle a is a constant. Ay depends on the material properties and
the stress distribution. The cutting speed vc is a constant. Under this circumstance, strains
and strain rates are monolithic functions o f shear angle <j>. However the strain and strain
rate remain constant only if the shear angle is assumed to have a fixed value. This is not
the case from the experimental work o f Zhang and Alpas [18] and Elmadagli and Alpas
[2]. The shear strains generated during cutting o f the 6061 A1 in the chip formation area
exhibit nonlinear distributions [18] (Figure 2.7). In the material immediately ahead o f the
tool tip, the equivalent strain has a value o f 2.5. The strains gradually decreased from the
tool tip value o f 2.5 to 0.8 at the chip root. Therefore, all the stress, strain and strain rate
are actually nonlinearly distributed in the deformation areas.
Chip
A x
Shear direction
Tool
W orkpiece
4.0-
33-m
2.0
-hip root
4W 400 -200 -STO 100 200 300
Distances from the cutting line, pm
Figure 2.7 Equivalent strain distribution in the material (6061 Al) ahead o f the tool tip, obtained from the work o f Zhang and Alpas [18].
2.1.5.4 Energy Consumption
The total power P, or energy, required to complete the machining process is the
combination o f energy required 1) to deform the material, 2) to create new fresh surfaces,
and 3) to move the chip along the rake face o f the cutting tool. The conventional method
to analyze energy consumption rate is usually calculated by the product o f cutting speed
vc and cutting force Fc [5]:
P = Fc - v c (2-17)
From equation (2-17), it can be seen that the power consumption is directly related to the
According to W right’s work, the rate o f plastic deformation work done in the
primary shear zone, Wp (assuming a discrete parallel-sided shear zone) can be calculated
as [19] :
Wp = k - u p -sp (2-18)
where k, up and sp are the yield strength o f the material, the shear velocity along the zone
and the length o f the primary shear zone, respectively. Similarly, in the secondary shear
zone, the rate o f plastic deformation energy is [19]:
Ws = X - k - u c -1
where the shear strength is multiplied by a constant X<1 to account for the fact that some
sliding occurs at the end o f the contact length, and uc is the shear velocity or chip
form ation speed and 1 is the length o f the chip-tool contact length.
W right [19] has shown that the total power curve (W p + W S ) has a minimum
value corresponding to a specific shear angle (Figure 2.8). if a = 6°, the minimum power
o f prim ary shear Wp arises when <j) is away from 48°, provided that the tool is firictionless,
i.e. W s = 0. However, as W s is increased as schematically shown, the minimum in the
4.5
Total enery
3.5
o £ o
Minimum energ' with secondary
zone /
Primary-2.5
M inim um energy when w s = 0
Secondary,
0.5
75 50
25 0
Shear angle, degrees
Figure 2.8 Rate o f plastic work as a function o f shear angle, obtained from W right’s work [19].
2.1.6 Temperature Increase and Its Effects on Machining
It was found that the cutting mechanism varies widely with the workpiece
temperature. The amount o f heat that causes the temperature rise depends on the
operation parameters as well as the physical, mechanical properties o f the workpiece and
the tool materials. During the process o f machining, heat is generated from three sources
[20]:
2) Secondary shear zone where the newly formed chip suffers from secondary
deformation by friction between chip and tool rake face.
3) Secondary friction zone where the friction is between the worn surface on
the tool flank face and the freshly machined surface.
All these heat components may transfer away from the heat sources, either by the
moving chip, by conduction into the bulk o f the workpiece, or into the cutting tool. The
heat transferred and dissipated depends on the physical and thermal properties o f the tool
and the workpiece such as the density, p and the specific heat, Cp. In the machining o f
metals, most o f the heat is dispersed by the moving chip (about 80% o f current cutting
operation [20]).
Elmadagli and Alpas calculated strain distribution in commercially pure copper
subjected to orthogonal cutting by shear angle measurements as well as temperature
distribution from estimating the conversion o f deformation energy to heat within the
workpiece [2] (Figure 2.9 and Figure 2.10). The temperature increased from 25 °C to
137 °C at the base o f the chip along the primary shear plane. The highest temperature
calculated was 857 °C, which occurred immediately ahead o f the tool tip.
The increased temperature can reduce the strength o f the metal at the chip-tool
interface, causing the decrease o f cutting force. High temperature can cause the metal in
the chip experience recovery and recrystallization or phase transformation in some alloys
[21], affecting the chip formation. Recrystallization studies on interrupted cut specimens
by Ramalingan and Black [2 2 ] showed that chip formation occurred by a process
dominant in shear in a thin shear front, as soon as a balance is attained between strain
Dista
nce
fr
om
to
ol
t
ip
,
300
(1*8* i
-300
-200 200 400 600 800 1000 1200 1400 1600 1800
Distance from tool tip , u m
Figure 2.9 The work o f plastic deformation per unit volume o f Cu workpiece material (MJ-nT3) between each increment o f equivalent strain, obtained from the work o f Elmadagli and Alpas [2],
300 iilF
200
TOOl
.6 6—
-100
-200
-300
200 400 600 800 1000 1200 1400 1600 1800
Distance from tool tip , pm
-200
2.1.7 Deformation Microstructures of W orkpiece Subjected to Dry Machining
It is important to understand the development o f the deformation microstructures
in the workpiece material in order to rationalize the energy expenditure process during
machining operations. TEM (Transmission electron microscopy) and SEM (Scanning
electron microscopy) investigations on the plastically deformed zone at the root o f the
chips in steels and non-ferrous materials were conducted by Ramalingam and Black [23].
This provided evidence for the formation o f dense dislocation tangles in the primary
deformation zone, which were oriented in a direction parallel to the direction o f shear.
Ni, Elmadagli, and Alpas [24] also used TEM to investigate the deformation structures
developed in the workpiece (1100 aluminum) ahead o f the tool tip when subjected to dry
machining. The undeformed grains were equiaxed with relatively dislocation free
interiors and had an average size o f 4.6 ± 0.5 pm. The deformation microstructure in the
primary deformation zone was characterized by the formation o f an elongated subgrain
structure. The average thickness o f the subgrains was 380 nm, and their width was
730 nm. Grain growth occurred in the secondary deformation zone, resulting in an
(a) (b)
Figure 2.11 TEM micrographs o f 1100 A1 workpiece subjected to dry orthogonal machining: (a) TEM micrograph showing the microstructure formed in the primary deformation zone; (b) TEM micrograph showing the microstructure formed in the secondary deformation zone. Obtained from the work o f Ni, Elmadagli, and Alpas [24].
2.1.8 Mechanics of Discontinuous (Serrated) Chip Formation
M ost o f the previous investigations on metal cutting were focused on continuous
chip formation because it is relatively stable and simple to analyze. Discontinuous or
serrated chip formation that involves adiabatic shear deformation has been observed in
certain difficult to machine materials such as the titanium base and the nickel base
superalloys, which have poor thermal properties and high strength at elevated temperature.
Also other materials, such as the hardened AISI 4340 steel at high speed [25] show
discontinuous chip formation.
Adiabatic shear deformation is a term used to describe the localization o f plastic
plastic strains, for example in ballistic impact and machining. It usually manifests itself as
zones o f intense shear deformation and /or micro structural modification o f the original
material up to hundreds o f micrometers wide, interspersed between regions o f relatively
lower and homogeneous deformation [26] (Figure 2.12).
Chip
Low sh ear strain — .
High sh sa r strain Tool
Figure 2.12 Serrated chip due to the shear localization in chips [26].
The material behaviour during the formation o f shear bands in the chip is very
complicated and there has been no confirmed model to describe the behaviour o f
workpiece material during the machining process to date. A schematic representation o f
shear localization and the onset o f shear band formation are presented in Figure 2.13 [27].
Labelled points on the curve are associated with the various stages o f deformation o f the
block o f material. The material begins to strain (a), and then exhibits uniform deformation
C D
1A
Plastic
Shear
S train
(y)
TJ?!!!?5S588!5M 5!52M 225” 5M 5?»gg;*»***!**t»
i f w m N r n M i M M f i f f f f M i t c M i i f i r f f i M f i i i f M
Figure 2.13 Schematic representations o f the shear localization process and an accompanying stress-strain curve [27].
Nakkalil [28] studied the localized adiabatic shear band formation in an eutectoid
![Figure 2.3 Force diagram developed by Ernst and Merchant [6], with the assumption of a single shear plane.](https://thumb-us.123doks.com/thumbv2/123dok_us/1486035.1181814/36.616.210.434.370.572/figure-force-diagram-developed-ernst-merchant-assumption-single.webp)
![Figure 2.4 Lee and Shaffer’s slip-line field model for orthogonal cutting [9, 10]](https://thumb-us.123doks.com/thumbv2/123dok_us/1486035.1181814/38.615.209.435.301.509/figure-lee-shaffer-slip-field-model-orthogonal-cutting.webp)
![Figure 2.5 Model of stress distribution on tool during cutting [5].](https://thumb-us.123doks.com/thumbv2/123dok_us/1486035.1181814/42.616.152.505.67.315/figure-model-stress-distribution-tool-cutting.webp)
![Figure 2.6 Schematic representation of shear strain in metal cutting process [17].](https://thumb-us.123doks.com/thumbv2/123dok_us/1486035.1181814/43.616.200.468.358.561/figure-schematic-representation-shear-strain-metal-cutting-process.webp)
![Figure 2.7 Equivalent strain distribution in the material (6061 Al) ahead of the tool tip, obtained from the work of Zhang and Alpas [18].](https://thumb-us.123doks.com/thumbv2/123dok_us/1486035.1181814/44.616.216.450.78.365/figure-equivalent-strain-distribution-material-obtained-zhang-alpas.webp)
![Figure 2.8 Rate of plastic work as a function of shear angle, obtained from Wright’s work [19].](https://thumb-us.123doks.com/thumbv2/123dok_us/1486035.1181814/46.617.186.472.70.430/figure-rate-plastic-function-shear-angle-obtained-wright.webp)
![Figure 2.9 The work of plastic deformation per unit volume of Cu workpiece material (MJ-nT3) between each increment of equivalent strain, obtained from the work of Elmadagli and Alpas [2],](https://thumb-us.123doks.com/thumbv2/123dok_us/1486035.1181814/48.617.113.507.391.676/figure-deformation-workpiece-material-increment-equivalent-obtained-elmadagli.webp)
![Figure 2.22 Simulation results from Pantale [61] representing cutting 42CrMo4 steel using ALE formulation: (a) Chip formation and temperature field in 2D modelling; Von Mises stresses distribution at time t = 0.4 ms and time t = 1.5 ms in 3D modelling.](https://thumb-us.123doks.com/thumbv2/123dok_us/1486035.1181814/71.614.133.530.83.568/simulation-representing-formulation-formation-temperature-modelling-distribution-modelling.webp)
![Figure 2.23 Plastic strain (1) and effective stress (2) contours dining steady-state orthogonal cutting process under different rake angles: (a) a = -2°, (b) a =0°, (c) a = 5°, (d) ct = 15°, obtained from the work of Shih [63],](https://thumb-us.123doks.com/thumbv2/123dok_us/1486035.1181814/74.618.124.501.74.584/figure-plastic-effective-contours-orthogonal-cutting-different-obtained.webp)
