ABSTRACT
KNIGHT, ALEXANDRA MARIE. Impact of Nitrogen Source, Rate and Weed Removal Time on Nitrogen Availability to Corn. (Under the direction of Dr. Wesley Everman).
Impact of Nitrogen Source, Rate, and Weed Removal Time on Nitrogen Availability to Corn
by
Alexandra Marie Knight
A thesis submitted to the Graduate Faculty of North Carolina State University
in partial fulfillment of the requirements for the degree of
Master of Science
Crop Science
Raleigh, North Carolina 2013
APPROVED BY:
_______________________________ ______________________________ Dr. Wesley J. Everman Dr. David Jordan
Committee Chair
DEDICATION
BIOGRAPHY
Alexandra Knight grew up on a beef cattle farm in east central Ohio in the town of Cadiz. Here, her family raised black Angus cattle, Polypay sheep and grew hay. Alexandra was born the eldest daughter of Anthony and Mary Knight and had a love for agriculture instilled in her at a young age. In 2007, Alexandra graduated with honors as Valedictorian of Harrison Central High School. The following year, she finished her 14th and final year in 4-H and received her American FFA Degree. During Alexandra's undergraduate career she was a member of the Science Club, the student founder of the Walsh University Chapter of the Sigma Zeta Honor Society, and a member of the University Honors Program. Alexandra also held a two year research internship at the Ohio Agricultural Research and Development Center where she worked under the direction of Dr. Parwinder Grewal in Entomology. She completed her senior honors thesis titled, "Active Carbon as a Useful Predictor of Urban Soil Quality and Plant Growth" under the direction of Drs. Jennifer Clevinger at Walsh University and Dr. Parwinder Grewal at Ohio State University. She graduated in the spring of 2011 with University Honors and Magna Cum Laude with a B.S. in Biology and minors in
ACKNOWLEDGMENTS
I would first like to thank my committee members Drs. Everman, Jordan, Smyth and Heiniger for their willingness to both serve on my committee and provide their expertise in this experiment. I cannot thank them enough for their help and encouragement.
I would also like to acknowledge the "weeds group" members both past and present who helped to make this research project a success. This group has both challenged me and provided me with an immense amount of laughter. For these reasons and many others I would like to thank the following, Eric Paynter, Tommy Batts, Zack Taylor, Thierry Besancon, Bryan Hicks, Kim Whitley, Jamie Hinton, Ranjit Riar, and Caleb Williams.
I would also like to acknowledge both the Upper Coastal Plain Research Station and Central Crop Research Station staff for their help and efforts in making this project a success.
TABLE OF CONTENTS
LIST OF TABLES...vi
LITERATURE REVIEW...1
DIFFERENT NITROGEN SOURCES, RATES, AND WEED REMOVAL TIMING IMPACT NITROGEN CONTENT IN CORN AND WEEDS...19
Introduction...20
Materials and Methods...25
Results and Discussion...28
Effects of treatment on Palmer amaranth nitrogen...28
Effects of treatment on large crabgrass nitrogen...28
Effects of treatment on corn nitrogen...29
Effects of treatment on leaf and stalk nitrogen...30
Effects of treatment on corn yield...32
Source of Materials...34
Literature Cited...35
DIFFERENT NITROGEN SOURCES, RATES, AND WEED REMOVAL TIMING IMPACT NITROGEN CONTENT IN SOILS...67
Introduction...68
Materials and Methods...73
Results and Discussion...75
Source of Materials...79
LIST OF TABLES
DIFFERENT NITROGEN SOURCES, RATES, AND WEED REMOVAL TIMING IMPACT NITROGEN CONTENT IN CORN AND WEEDS
Table 1: Density of Palmer amaranth and large crabgrass removed at 8 or 16 cm
at Clayton in 2011 as influenced by nitrogen source and rate.………...…...…..41 Table 2: Density of Palmer amaranth and large crabgrass removed at 8 or 16 cm
at Rocky Mount in 2011 as influenced by nitrogen source and rate………...…...42 Table 3: Density of Palmer amaranth and large crabgrass removed at 8 or 16 cm
at Clayton in 2012 as influenced by nitrogen source and rate………...43 Table 4: Density of Palmer amaranth and large crabgrass removed at 8 or 16 cm
at Rocky Mount in 2012 as influenced by nitrogen source and rate………...…….44 Table 5: Temperature, Precipitation, and Irrigation Data for Clayton and Rocky Mount in 2011 and 2012………..………...…….45 Table 6: ANOVA for Nitrogen Content in Palmer amaranth and large crabgrass at Clayton and Rocky Mount in 2011 and 2012...………46 Table 7: ANOVA for Corn nitrogen content in whole corn plants, corn ear leaves, corn stalks as well as corn yield at Clayton and Rocky Mount in 2011 and 2012...…..47 Table 8: Nitrogen content in Palmer amaranth as impacted by the combination of weed removal time and nitrogen rate applied………...………48
Table 9: Nitrogen content in large crabgrass as influenced by environment and weed
Table 10: Large crabgrass as impacted by environment, nitrogen source, nitrogen rate, and weed removal height…...50
Table 11: Corn nitrogen content at sampling date 1 as impacted by environment, nitrogen source, nitrogen rate, and weed removal height………...…52
Table 12: Corn nitrogen content at sampling date 2 as impacted by environment, nitrogen source, nitrogen rate, and weed removal height.…...…54 Table 13: Nitrogen content in corn leaves as impacted by nitrogen rate applied...………..56 Table 14: Nitrogen content in corn ear leaves as influenced by the combination of
environment, nitrogen source, and nitrogen rate…...57
Table 15: Nitrogen content in corn stalks as influenced by the combination of environment, nitrogen source, and nitrogen rate…...59
Table 16: Nitrogen content in corn stalks as impacted by the combination of nitrogen source, nitrogen rate, and weed removal height...61 Table 17: Corn yield as impacted by nitrogen rate applied...63 Table 18: Corn yield as impacted by weed removal height………...….64 Table 19: Corn yield as influenced by the combination of environment, nitrogen source and nitrogen rate………...65
Table 20: Pearson correlations of nitrogen content and weed density...…67 DIFFERENT NITROGEN SOURCES, RATES, AND WEED REMOVAL TIMING IMPACT NITROGEN CONTENT IN SOILS
Table 22: ANOVA for soil samples taken at sample date 1 and 2 in 2011 and
LITERATURE REVIEW
Two of the greatest management factors impacting production and yield in corn systems, after genetics, are nitrogen availability and crop-weed competition. Nitrogen is one of the most important nutrients supplied to corn, if not the most important. The importance of this nutrient exists partially in its characteristic mobility (Kurtz et al. 1952). A study done by Kurtz et al. (1952) demonstrated the idea that nitrogen was the greatest limiting factor for corn systems. Yields were improved in systems where nitrogen was applied with or without controlled moisture in the study. The effect of added water varied occasionally showing no yield difference for the corn while the addition of nitrogen continually showed a difference (Kurtz et al. 1952). Multiple studies have also shown how the addition of nitrogen will lead to greater corn growth (Adeli et al. 2012; Dharmakeerthi et al. 2006; Liu and Wiatrak 2012). This has been shown in leaf length and width, corn ear height, and overall stalk height (Liu and Wiatrak 2012). One study in particular showed approximately 9% increase in plant height with a 180 kg N treatment (Liu and Wiatrak 2012). Availability of nitrogen to the plant will impact the uptake of nitrogen, movement of nitrogen in the plant, and
and 47 kg per hectare during the two years of the study (Crozier et al. 1998). The authors in Dharmakeerthi et al. (2006) also agreed that nitrogen uptake slowed right before silking and this was at the driest period of the season. In a study by Nelson et al. (2010), the importance of nitrogen uptake in corn is shown with application source and timing. This study indicated that applying nitrogen anytime after crop emergence has the possibility of negatively
impacting yield due to the burning of leaves and other negative impacts caused by nitrogen application onto the corn (Nelson et al. 2010). Loss of nitrogen in a cropping system is most often attributed to rainfall which may cause leaching, denitrification, or the lack of may cause volatilization of ammonia (Wilkison and Blevins 1999). Leaching is dependent on many factors including soil type where soils with higher sand content, such as loamy sands, are more prone to leaching (Gehl et al. 2005). Volatilization, however, may be reduced by incorporating the fertilizer upon application (Kamprath 1986; Nelson et al. 2010). However, it should also be noted that when moisture levels are too low, or simply when conditions are dyer, overall nitrogen concentration will decrease and negatively impact yield of the crop (Dharmakeerthi et al. 2006). With adequate rainfall and an optimal rate of nitrogen, on the other hand, corn may yield between 10,000 and 11,000 kg/ha (Kamprath 1986). Kamprath (1986) suggests this optimal rate of nitrogen in the North Carolina coastal plain to be 168 kg N/ha.
will increase with temperature until it reaches a threshold at which point nitrification will rapidly approach zero. The soil NO3-N quickly depleted in the greatest amount during the season between 200 and 600 growing degree days after emergence in all site-years except one and this timing corresponded with that of the greatest increase in biomass of corn and weeds (Lindquist et al. 2010). The movement of nitrogen in the soil was minimal during the grain fill period and there was a slight increase in soil nitrogen after harvest which was attributed to nitrogen rendered immobilized earlier in the season or the mineralization of any plant remnants left in the field (Lindquist et al. 2010). In a study comparing crimson clover crop as a nitrogen source in a tilled system and ammonium nitrate as a nitrogen source in a no-till system, the results showed that nitrate levels in the soil were only greater in the ammonium nitrate system at five weeks after planting and this was at a depth of between 15 and 30 centimeters in the soil (Crozier et al. 1998).
The uptake efficiency of nitrogen is dependent upon many factors including soil types, crop type, and the amount of N fertilizer applied (O'Neill et al. 2004; Weih et al. 2011). The efficient use of the nutrient N will indicate how well fertilizer applied is used and along the same lines, how N used can result in environmental contamination for the
al. 2012). Within inorganic nitrogen sources a difference in yield is still observed where yields of time release fertilizers are greater than those from a urea source (Noellsch et al. 2009). Nitrogen leaching potential increases with any fertilizer source when the amount of nitrogen required by the crop is less than plant available nitrogen within the system (Cassman et al. 2002).
The uptake of NH4+ and NO3- are important considering these are the two primary forms of nitrogen involved in nitrogen assimilation by plant roots (Cassman et al. 2002). It is important to understand the nitrogen uptake process, as well as nitrogen recovery within a plant in order to determine a more accurate nitrogen application rate and time for fertilizer applications (Mussaddak 2008). In a study by Reddy and Reddy (1993) it was shown that a corn system in a North Carolina Piedmont soil had no significant difference in NH4+ and NO3- uptake however, the NO3- source did not have as large a portion accounted for in the system (Reddy and Reddy 1993). The negative charge on NO3- makes it more difficult to be taken up by plant roots, and due partially to the fact more energy or ATP is required for uptake. The uptake of NO3- into the plant is driven by a proton gradient at the root cell wall which helps provide the energy necessary for its movement. Transport of this form of
Ammonium movement into a plant is different from that of nitrate. Movement of ammonium in the system is said to be by a high affinity saturable carrier-mediated system which is regulated by negative feedback inhibition and at high concentrations of the ammonium ion a linear nonsaturating component (DiTomaso 1995).
Tillage has also been identified as a factor causing change in the uptake and
movement of nitrogen (Dharmakeerthi et al. 2004). Conventional tillage systems show more mineralization, less immobilization, less denitrification and less NH3 volatilization than high residue no-till farming situations. A corn study by Dharmakeerthi et al. (2006) showed that a conventional tillage system had improved the nitrogen uptake by plants during the earlier part of the season. However, this result was not consistent from one year to the next and also was not maintained throughout the season. It was also shown in this experiment that any impact tillage has on corn nitrogen uptake will occur by the V6 growth stage, although slight differences will be seen between the V6 and silking stages of growth. These results are all dependent on a field having favorable conditions for crop growth. For example, fields with low levels of organic carbon or inclement weather may not see these advantages
when the source is applied. Eghball and Power (1999) indicated that fresh manure will provide a greater nitrogen use efficiency than a composted manure due to the fact that a greater N/P ratio is observed in fresh manures which allows for greater uptake in the given crop species. In a study using Nitrogen 15 recovery, nitrogen in nutrient pools following application decreased before anthesis and the amount of this nitrogen was increased in the corn. This same study showed that NO3- contributed more greatly than NH4+ to corn. The assumption behind more NO3- being taken up was that nitrification occurred rapidly (Crozier et al. 1998).
Just as no till fields allow less nitrogen to reach the crop, some varieties of corn suffer more from a deficit of nitrogen than others. In a study by O'Neill et al. (2004) the prediction had been that older varieties of corn would be less tolerant of nitrogen deficiencies.
However, the results indicated that the specific era when a variety of corn was introduced did not indicate whether the nitrogen deficiency tolerance of the variety would be greater or lower than previously introduced varieties (O'Neill et al. 2004).
Variance in crop yield based on weed competition has been noted in many studies concerning the critical period of weed control, the period of time crop production will be negatively impacted if weed species are present (Knezevic et al. 2002). Competition occurs between crops and weeds for space, sunlight, and nutrients because the two types of plants have similar key macro- and micronutrient requirements in order to survive (Lindsey et al. 2013).
use efficiency upon receiving irrigation every 2.5 days. Too excess or too little of an
irrigation frequency can inhibit root growth and development of the crop while irrigation too frequently can also lead to leaching of nitrate ions (Hokam et al. 2011).
greater yield than glufosinate, although this has been variable across years (Lindsey et al. 2012). Yield loss due to weeds has shown to be the same across different nitrogen rates in several studies (Barker et al. 2006; Wortman et al. 2011). In a similar way, an intercropping study by Kurtz et al. (1952) showed that when a crop is growing between a corn crop it will compete with the corn for mobile nutrients such as nitrogen and water. That is, it will compete for these nutrients, water included, if they are limiting to the environment. Overall, yield of intercropped corn resulted in a 10 to 15% deficit compared to corn grown without intercropping (Kurtz et al. 1952). Removing weeds from the equation results in a clear correlation where increasing nitrogen rates results in increasing corn yields. In a study by Wortman et al. (2011), velvetleaf was allowed to grow competitively with corn. In soils with a high mineralization potential velvetleaf was more competitive for nitrogen than in the soils with low mineralization potential (Wortman et al. 2011). Lindquist et al. (2001) found when grown in an environment together, weeds and crops will impact the resources available for one another and will do so differently depending on the amount of these resources, nitrogen included. Blackshaw et al. (2005) observed wheat plots infested with broadleaf weed species showed less of a yield impact than those plots where grass weed species served as the
applied than a fertilizer free site (Sweeney et al. 2008). When fertilizer more than 19 kg N ha-1 were added to a field, a decrease in weed seed germination may be observed due to some of the burning among other factors which cause a grower to not apply fertilizers too closely to corn seeds or seedlings (Hoeft et al. 2000).
Models predicting yield have been most accurate when looking at the time of weed emergence, the area of the weed leaves and, the density of the weed (Baghestani et al. 2007). The critical period of weed control is often analyzed in studies by looking at a crop's yield loss in relation to the emergence and/or removal of weeds. This time period is defined by the critical duration of weed interference and the critical weed-free period. These are defined as the minimum length of time which weeds must be absent to prevent yield loss time during which weeds are allowed to grow before yield of the crop is significantly impacted and the time period which weeds may be allowed to remain with a crop and not impact its growth, respectively (Evans et al. 2003; Hall et al. 1992; Nieto et al. 1968; Swanton and Weise 1991). This time period decreased when nitrogen fertilizer application occurs in the crop. This is thought to be due to the earlier leaf growth and corresponding increase in corn leaf area index and, therefore an earlier corn canopy closure (Evans et al. 2003). Along with the critical period of weed control, consideration must also be given to the critical weed-free period which will be the time in which the crop needs to be weed free in order to achieve its optimal potential yield. It should also be noted that the critical period of weed control can be
of 30 cm, however, this was when water was not a limiting factor in the cropping system (Dalley et al. 2006). A study by Hall et al. (1992) indicated that the start of the critical weed free period could be variable in environments but, the ending of this period was consistently shown to be at the 14 leaf stage of corn.
Literature Cited
Adeli, A., H. Tewolde, and J.N. Jenkins. 2012. Broiler litter type and placement effects on corn growth, nitrogen utilization, and residual soil nitrate-nitrogen in a no-till field. Agron. J. 104:43-48.
Aslam, M., R.L. Travis, and R.C. Huffaker. 1992. Comparative kinetics and reciprocal inhibition of nitrate and nitrite uptake in roots of uninduced and induced barley
(Hordeum vulgare L.) seedlings. Plant Phys. 99: 1124-1133.
Blackshaw, R.E. 2005. Nitrogen fertilizer, manure, and compost effects on weed growth and competition with spring wheat. Agron. J. 97: 1612-1621.
Blackshaw, R.E., R.N. Brandt, H.H. Janzen, T. Entz, C.A. Grant, and D.A. Derksen. 2003. Differential response of weed species to added nitrogen. Weed Sci. 51: 532-539. Baghestani, M.A., E. Zand, S. Soufizadeh, and M.A. Beygi. 2007. Evaluation of different
empirical models of crop/weed competition to estimate yield and LAI losses from common lambsquarters. Pakistan Journ. of Biol. Sci. 10: 3752-3761.
Barker, D.C., S.Z. Knezevic, A.R. Martin, D.T. Walters, and J.L. Lindquist. 2006. Effect of nitrogen addition on the comparative productivity of corn and velvetleaf (Abutilon theophrasti). Weed Sci. 54: 354-363.
Bates, T. and S.L. Tisdale. 1957. The movement of nitrate nitrogen through columns of coarse textured soil materials. Soil Sci. Soc. Amer. Proc. 21: 525-528.
Cassman, K.G., A. Dobermann, and D.T. Walters. 2002. Agroecosystems, nitrogen-use efficiency, and nitrogen management. Ambio. 31: 132-140.
Crozier, C.R., L.D. King, and R.J. Volk. 1998. Tracing nitrogen movement in corn production systems in the North Carolina piedmont: a nitrogen-15 study. Agron. Journ. 90: 171-177.
Dalley, C.D., M.L. Bernards, and J.J. Kells. 2006. Effect of weed removal timing and row spacing on soil moisture in corn (Zea mays). Weed Tech. 20: 399-409.
Dharmakeerthi, R.S., B.D. Kay, and E.G. Beauchamp. 2004. Effect of disturbance on N availability across a variable landscape in southern Ontario. Soil Tillage Res. 79: 101-112.
Dharmakeerthi, R.S., B.D. Kay, and E.G. Beauchamp. 2006. Spatial variability of in-season nitrogen uptake by corn across a variable landscape as affected by management. Agron. J. 98: 255-264.
DiTomaso, J.M. 1995. Approaches for improving crop competitiveness through the manipulation of fertilization strategies. Weed Sci. 43: 491-497.
Doyle, A.D. and I.C.R. Holford. 1993. The uptake of nitrogen by wheat, its agronomic efficiency and their relationship to soil and fertilizer nitrogen. Aust. Journ. Agric. 44: 1245-1258.
Eghball, B. and J.F. Power. 1999. Phosphorus- and Nitrogen-based manure and compost applications corn production and soil phosphorus. Soil Sci. Soc. of Amer. 63: 895-901.
Evans, S.P., S.Z. Knezevic, J.L. Lindquist, C.A. Shapiro, and E.E. Blankenship. 2003.
Fausey, J.C., J.J. Kells, S.M. Swinton, and K.A. Renner. 1997. Giant foxtail (Setaria faberi) interference in nonirrigated corn (Zea mays). Weed Sci. 45:256-260.
Gehl, R.J., J.P. Schmidt, L.D. Maddux, and W.B. Gordon. 2005. Corn yield response to nitrogen rate and timing in sandy irrigated soils. Agron. J. 97: 1230-1238. Gower, S.A., M.M. Loux, J. Cardina, S.K. Harrison, P.L. Sprankle, N.J. Probst, T.T.
Bauman, W. Bugg, W.S. Curran, R.S. Currie, R.G. Harvey, W.G. Johnson, J.J. Kells, M.D.K. Owen, D.L. Regehr, C.H. Slack, M. Spaur, C.L. Sprague, M. VanGessel, and B.G. Young.2003. Effect of postemergence glyphosate application timing on weed control and grain yield in glyphosate-resistant corn: results of a 2-yr multistate study. Weed Tech. 17: 821-828.
Hall, M.R., C.J. Swanton, and G.W. Anderson. 1992. The critical period of weed control in grain corn (Zea mays). Weed Sci. 40: 441-447.
Harrison, S.K., E.E. Regnier, J.T. Schmoll, and J.E. Webb. 2001. Competition and fecundity of giant ragweed in corn. Weed Sci. 49: 224-229.
Hoeft, R.G., E.D. Nafziger, R. R. Johnson, and S.R. Aldrich. 2000. Modern corn and soybean production. Champaign, IL: MCSP. 353 p.
Hokam, E.M., S.E. El-Hendawy, and U. Schmidhalter. 2011. Drip irrigation frequency: their effects and the interaction with nitrogen fertilization on maize growth and nitrogen use efficiency under arid conditions. Jour. of Agron. and Crop Sci. 197: 186-201. Hole, D.J., A.M. Emran, Y. Fares, and M.C. Drew. 1990. Induction of nitrate transport in
Kamprath, E.J. 1986. Nitrogen studies with corn on coastal plain soils. NC Agricultural Research Service. 282: 3-15.
Knezevic, S.Z., S.P. Evans, E.E. Blankenship, R.C. Van Ackler, and J.L. Lindquist. 2002. Critical period for weed control: the concept and data analysis. Weed Sci. 50: 773-786.
Kurtz, T., S.W. Melsted, and R.H. Bray. 1952. The importance of nitrogen and water in reducing competition between intercrops and corn. Agron. J. 44:13-17.
Lindquist, J.L. 2001. Mechanisms of crop loss due to weed competition. Pgs. 233-253 in R.K.D. Peterson and L.G. Higley, eds. Biotic Stress and Yield Loss. Boca Raton, FL: CRC Press.
Lindquist, J.L., S.P. Evans, C.A. Shapiro, and S.Z. Knezevic. 2010. Effect of nitrogen addition and weed interference on soil nitrogen and corn nitrogen nutrition. Weed Tech. 24: 50-58.
Lindsey, L.E., D.D. Warncke, K. Steinke, and W.J. Everman. 2013. Fertilizer and population affects nitrogen assimilation of common lambsquarters (Chenopodium album) and redroot pigweed (Amaranthus retroflexus). Weed Sci. 61: 131-135.
Lindsey, L.E., W.J. Everman, A.J. Chomas, and J.J. Kells. 2012. Evaluation of application program and timing in herbicide-resistant corn. Weed Tech. 26: 617-621.
Liu, K. and P. Wiatrak. 2012. Corn production response to tillage and nitrogen application in dry-land environment. Soil and Tillage Res. 124: 138-143.
Mussaddak, Janet. 2008. Response of cotton to irrigation methods and nitrogen fertilization: yield components, water-use efficiency, nitrogen uptake and recovery. Soil Sci. and Plant Anal. 39: 2282-2302.
Nathan, M.V. and G.L. Malzer. 1994. Dynamics of ammonia volatilization from turkey manure and urea applied to soil. Soil Sci. Soc. Am. Journ. 58: 985-990.
Nelson, K.A., P.C. Scharf, W.E. Stevens, and B.A. Burdick. 2010. Rescue nitrogen applications for corn. Soil Sci. Amer. Journ. 75: 143-151.
Nieto, J.N., M.A. Brondo, and J.T. Gonzalex. 1968. Critical periods of the crop growth cycle for competition from weeds. PANS (C) 14: 159-166.
Noellsch, A.J., P.P. Motavalli, K.A. Nelson, and N.R. Kitchen. 2009. Corn response to conventional and slow-release nitrogen fertilizers across a claypan landscape. Agron. J. 101: 607-614.
O’Neill, P.M., J.F. Shanahan, J.S. Schepers, and B. Caldwell. 2004. Agronomic responses of
corn hybrids from different eras to deficit and adequate levels of water and nitrogen. Agron. J. 96: 1660-1667.
Page, E.R., M. Tollenaar, E.A. Lee, L. Lukens, and C.J. Swanton. 2010. Shade avoidance: an integral component of crop-weed competition. Weed Res. 50: 281-288.
Reddy, G.B. and K.R. Reddy. 1993. Fate of nitrogen-15 enriched ammonium nitrate applied to corn. Soil Sci. Soc. Am. Journ. 55: 1616-1621.
Sisson, V.A., T.W. Rufty, and R.E. Williamson. 1991. Nitrogen-use efficiency among flue cured tobacco genotypes. Crop Sci. 31: 1615-1620.
Swanton, C.J. and S.F. Weise. 1991. Integrated weed management: the rationale and approach. Weed Tech. 5: 657-663.
Sweeney, A.E., K.A. Renner, C. Laboski, and A. Davis. 2008. Effect of fertilizer nitrogen on weed emergence and growth. Weed Sci. 56: 714-721.
Tollenaar, M. 1991. Physiological basis of genetic improvement of maize hybrids in Ontario from 1959 to 1988. Crop Sci. 31: 119-124.
Uremis, I., A. Bayat, A. Uludag, N. Bozdogan, E. Aksoy, A. Soysal, and O. Gonen. 2004. Studies on different herbicide application methods in second crop maize field. Crop Prot. 23: 1137-1144.
Vetsch, J.A. and G.W. Randall. 2004. Corn production as affected by nitrogen application timing and tillage. Agron. Journ. 96: 502-509.
Weih, M., L. Asplund, and G. Bergkvist. 2011. Assessment of nutrient use in annual and perennial crops: a functional concept for analyzing nitrogen use efficiency. Plant Soil 339: 513-520.
Wilkison, D.H. and D.W. Blevins. 1999. Observations on preferential flow and horizontal transport of nitrogen fertilizer in the unsaturated zone. Journ. Environ. Qual. 28: 1568-1580.
Xu, Y., L. Nie, R.J. Buresh, J. Huang, K. Cui, B. Xu, W. Gong, and S. Peng. 2010. Agronomic performance of late-season rice under different tillage, straw, and nitrogen management. Field Crops Research. 115: 79-84.
DIFFERENT NITROGEN SOURCES, RATES, AND WEED REMOVAL TIMING IMPACT NITROGEN CONTENT IN CORN AND WEEDS
Alexandra M. Knight, Wesley J. Everman, David Jordan, Ron Heiniger, and T. Jot Smyth ---Formatted for Weed Science---
Two of the greatest management factors, following genetics, impacting production and yield in corn production are fertility and weed management. The uptake efficiency of nitrogen is dependent upon many factors including tillage system, soil type, crop, weeds, and the amount and type of nitrogen fertilizer applied. The relationship and interaction between crops and weeds is important, and determining how North Carolina corn production may be impacted by different fertilizers could improve nitrogen use efficiency and overall corn yields. Field studies were conducted in 2011 and 2012 at the Upper Coastal Plains Research Station near Rocky Mount, NC and at the Central Crops Research Station in Clayton, NC. Treatment factors included N source, N rate, and weed removal time with a factorial
Nomenclature: Corn (Zea mays), Palmer amaranth (Amaranthus palmeri S. Wats.), large crabgrass (Digitaria sanguinalis)
Key Words: Nitrogen, Competition
___________________________________________________________________________ *First, second, third, and fourth authors: Graduate Research Assistant, Assistant Professor, Professor and Professor. Crop Science Department, P.O. Box 7620, North Carolina State University, Raleigh, NC 27695-7620. Fifth author: Professor. Soil Science Department, P.O. Box 7619, North Carolina State University, Raleigh, NC 27695-7620.
arrangement. The N sources included urea ammonium nitrate (UAN), chicken litter (CCL) and sulfur coated urea (SCU) with rates of 0, 68, 135, and 202 kg N/A. Weed removal times were at 0 (weed-free), 8, and 16 cm heights. Palmer amaranth showed a rate by height significance. Large crabgrass showed a significant interaction of environment by source by rate by height. Both corn sampling dates showed a significant interaction of environment by source by rate by height. Corn ear leaf nitrogen content based on environment and a nitrogen source and rate was significant with a large main effect of nitrogen rate. Significant
environment by nitrogen source and rate were observed for corn stalk samples as well as corn yields. Stalks also had a significant source by rate by height interaction and yield hate large main effects of both nitrogen rate and weed removal height. Differences based on
environment were not surprising considering the differences in weather patterns between the locations and seasons as well as the fact that different soil types were observed at the
different fields. Rate was a noted main effect in each plant sampling series with a general trend of greater nitrogen uptake with more nitrogen applied.
Introduction
supply to a plant thus improving Nitrogen Uptake Efficiency and giving significantly higher yields. Nitrogen uptake efficiency is defined as total plant nitrogen per unit of soil nitrogen (Weih et al. 2011) and has been shown to have a strong positive correlation with crop biomass production, kernel number in corn, grain yield and photosynthesis (O’Neill et al.
2004).
It is important to consider what variables in a crop system will impact available nitrogen after application. According to Mussaddak (2008), it is important to understand the nitrogen uptake process, as well as nitrogen recovery within a plant in order to determine an accurate nitrogen application rate and time for fertilizer applications (Mussaddak 2008). Competition for nitrogen between crops and weeds results in reduced available nitrogen for uptake and utilization by the crop, and often alters the crop yield. This has been noted in many studies concerning the critical period of weed control, the period of time crop
production will be negatively impacted if weed species are present (Knezevic et al. 2002). Competition occurs for space, sunlight, and nutrients. Weeds and crops have similar key macro and micronutrient requirements in order to survive (Gower et al. 2003; Lindsey et al. 2013).
have shown no difference in yields where time release fertilizers were applied (Cahill et al. 2007). Nitrogen leaching potential increases with any fertilizer source when the amount of nitrogen required by the crop is less than plant available nitrogen within the system (Cassman et al. 2002).
occurred due to the type of POST herbicide program used with glyphosate programs having greater yield than glufosinate, although this has been variable across years (Lindsey et al. 2012). Yield loss due to weeds has shown to be the same across different nitrogen rates in several studies (Barker et al. 2006; Wortman et al. 2011). In a similar way, an intercropping study by Kurtz et al. (1952) showed competition for mobile nutrients such as nitrogen and water when corn and rye, clover, bromegrass, alfalfa, timothy, or lespedeza were
intercropped. That is, two crop species will compete for these nutrients, water included, if they are limiting to the environment. Overall, yield of intercropped corn resulted in a 10 to 15% deficit compared to corn grown without intercropping (Kurtz et al. 1952). Removing weeds from the equation results in a clear correlation where increasing nitrogen rates results in increasing corn yields. In a study by Wortman et al. (2011), velvetleaf was allowed to grow competitively with corn. In soils with a high mineralization potential velvetleaf was more competitive for nitrogen than in the soils with low mineralization potential (Wortman et al. 2011). Lindquist et al. (2001) found when grown in an environment together, weeds and crops will impact the resources available for one another and will do so differently depending on the amount of these resources, nitrogen included. Blackshaw et al. (2005) observed wheat plots infested with broadleaf weed species showed less of a yield impact than those plots where grass weed species served as the nitrogen competitors. Furthermore, a study by Evans et al. (2003) indicated that weeds will have a lesser impact on crop yield potential when an early nitrogen application occurs even if the application is at half of a normally
recommended rate. Related studies have indicated that earlier nitrogen application
occurring in late May. However, these studies indicate that these patterns may be indicative of things other than nitrogen treatment with possible suggestions including weather patterns and seed germination (Hoeft et al. 2000; Sweeney et al. 2008). Weed biomass will be greater, however, in any site when nitrogen fertilizer is applied than a fertilizer free site (Sweeney et al. 2008). When 19 kg N ha-1 was added to a field, a decrease in weed seed germination may be observed due to some of the same factors which cause a grower to not apply fertilizers too closely to corn seeds or seedlings (Hoeft et al. 2000).
Therefore, it is hypothesized that when weeds are allowed to grow to 8 or 16 cm in height, the nitrogen content in corn plants will be less than those grown in weed free plots and corn yield will be reduced compared to weed-free plots. Additionally, it is hypothesized that corn exposed to greater nitrogen rates will see greater nitrogen uptake in the plant species present and those fertilizers with greatest plant available nitrogen per unit time (urea ammonium nitrate) will have greater nitrogen uptake and therefore greater yield than the organic fertilizer or even over the time release fertilizer.
Materials and Methods
Research was conducted in North Carolina during 2011 and 2012 at the Central Crops Research Station in Clayton (35ᵒ40’6.04”N, 78ᵒ30’7.00”W) and the Upper Coastal Plain Research Station near Rocky Mount (35ᵒ53’38.94”N, 77ᵒ40’47.50”W). Glyphosate-tolerant corn4 was planted on 97 and 92 cm rows in Clayton and Rocky Mount, respectively.
(2012); and Rocky Mount: Goldsboro fine sandy loam, Norfolk loamy sand (2011);
Goldsboro fine sandy loam and Norfolk loamy sands (2012) (Soil Survey Staff, 2012). The experimental design was set up in a random complete block design with treatments in a factorial arrangement with plots 9.1 meters by 3.8 meters in Clayton and 9.14 meters by 3.66 meters in Rocky Mount. Treatments consisted of the combination of three nitrogen fertilizers being composted chicken litter (CCL), urea ammonium nitrate (UAN), and sulfur coated urea (SCU) applied at 68, 135, and 202 kg N/ha and nitrogen free control plots were included for comparison. Rates for nitrogen application were made with plant available nitrogen for the synthetic fertilizers and total nitrogen content for the chicken litter source. Nitrogen
treatments were applied pre-plant incorporated and combined with weed removal timings of 0 cm (weed-free), 8 cm, or 16 cm.
Plant samples were collected from each plot when average weed size in the field reached 8 or 16 cm. These were dates of May 25 and June 1 for Clayton in 2011, May 26 and 31 in Rocky Mount 2011, May 29 and June 5 in Clayton 2012, and June 4 and 7 for the 8 cm and 16 cm weed removal times respectively. On average sample date 1, or the date of 8 cm weed removal was 22 days after planting and sample date 2, or the date of 16 cm weed removal timing, was 28 days after planting. When the weeds reached the desired heights, two random 0.25m2 areas of weeds were hand harvested separated, counted by species, and averaged for each plot’s density (Table 1-4). The predominant weed species collected at
these sites were Palmer amaranth (Amaranthus palmeri S. Wats.) and large crabgrass
(Digitaria sanguinalis). A random sample of each species were collected per plot for
sample date 1 and 2 as well. So not to impact yield, corn was removed from rows (2 and 3) and this still gave the capability of nitrogen readings based on the respective treatment. Corn was collected from weed-free plots on two sample dates which corresponded to the dates for which the weeds were collected with sampling date 1 being the date 8 cm weeds were
removed and sampling date 2 being the date 16 cm weeds were collected. Both fresh and dry weights were taken for each sample. Corn ear leaf samples were taken at silking and, corn stalk samples were taken after black layer formation. Samples were ground to particles of 2 mm or less and processed for total nitrogen content using a model 2400 CHN Elemental Analyzer7 from Perkin Elmer Corporation. Data were collected via a combustion process with pure oxygen. This was conducted by the NCSU Environmental and Agricultural Testing Service Lab. These methods were similar to those described by Yeomans and Bremner (2008). Plots were kept weed free after their respective weed removal timings through a combination of methods including hand-pulling and the spraying of the herbicides glyphosate3, atrazine1, and S-metalochlor6 with a CO2 pressurized backpack sprayer2. Weed free plots were sprayed before weed emergence whereas the 8 and 16 cm plots were sprayed when the weeds reached their respective heights. Herbicide spraying and hand-weeding were continued throughout the season as needed to keep the plots weed-free.
Results and Discussion Palmer amaranth Nitrogen Content
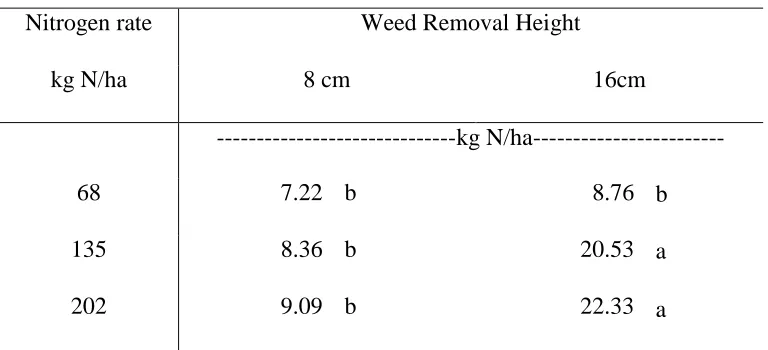
Palmer had a significant nitrogen rate by weed removal height interaction (Table 8). Weeds allowed to remain in the system to 16 rather than only 8 cm had greater nitrogen concentrations while nitrogen concentration in the Palmer amaranth increased with an
increase in nitrogen rate within a given weed removal height. The greatest concentration was observed in the 202 kg N/ha nitrogen rate with the weeds allowed to grow to 16 cm with a concentration of 22.33 kg N/ha and the lowest was 7.22 kg N/ha which was the group
allowed to grow to an 8 cm height and only 68 kg N/ha was applied. Greater yield loss when weeds were allowed to remain in the system longer was indicative of the fact that the weeds could take up more nitrogen when allowed to grow to a larger height (Blackshaw et al. 2003; Lindsey et al. 2013; Swanton and Weise, 1991).
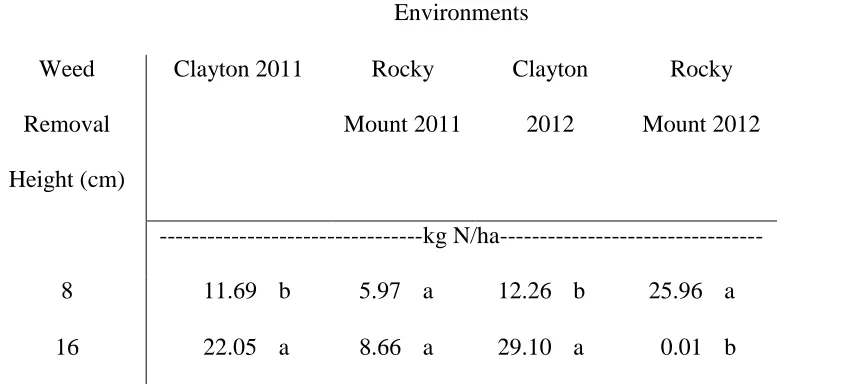
Large crabgrass Nitrogen Content
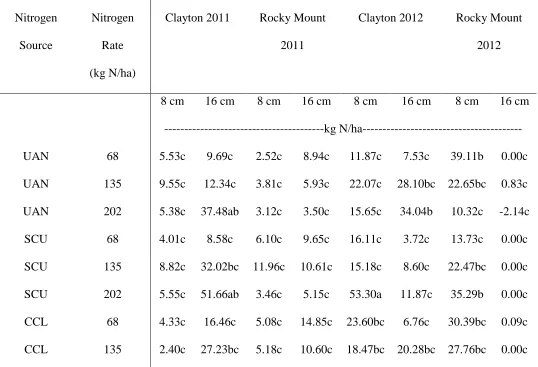
A significant environment by large crabgrass height interaction (Table 9) was observed at as well as an environment by source by rate by height interaction (Table 10). Multiplestudies then note an increase in plant nitrogen content with an increase in nitrogen rates applied (Blackshaw et al. 2003; Blackshaw et al. 2005; Lindsey et al. 2013) and
Corn Nitrogen Content
Corn (Zea mays) samples were taken and analyzed at the time of the 8 centimeter weeds being removed (sample date 1) and 16 centimeter weed removal (sample date 2). Sample date 1 (Table 11) and sample date 2 (Table 12) both showed a significant effect of environment by nitrogen source by nitrogen rate by weed removal height (Table 11). In this data set a general trend of an increase in corn nitrogen concentration with
increase in nitrogen rate per source is evident. However, some of those plots with the 135 kg N/ha application rate had a greater nitrogen concentration than the highest rate which agrees with Kamprath (1986) stating that there is an optimal nitrogen rate above which nitrogen content in the cropping system will not improve. Previous studies have indicated significant interactions based on both weed removal height and nitrogen fertilizer rate. Corn yields have increased with increasing fertilizer rates when other factors were not limiting. These studies also indicated that inorganic fertilizers will yield greater than organic fertilizers (Adeli et al. 2012) with time release fertilizer applications yielding above urea fertilizer applications (Noellsch et al. 2003) or the same as urea fertilizers (Cahill et al. 2007). Competition between weeds and crops has been important in previous studies considering Uremis et al. (2004) found that 38 to 59% of yield loss in corn is caused by weed
2010). These three factors have not previously been discovered to have a significant combined interaction.
Effects of Treatment on leaf and stalk nitrogen
Corn stalk samples had two significant interactions with one being environment by nitrogen source by nitrogen rate (Table 15) and the other being nitrogen source, rate, and weed removal timing (Table 16). Generally the environment by nitrogen source by nitrogen rate interaction shows the Rocky Mount corn stalks to have lower percentages of nitrogen content in both years than that of Clayton. For example the lowest rate of sulfur coated urea had a percentage uptake of 0.36 and 0.31 in Clayton in 2011 and 2012, respectively, while this same treatment had a nitrogen content of 0.22 and 0.23 percent at the Rocky Mount location in 2011 and 2012, respectively. The same trend of increase in nitrogen
concentration with an increase in rate per nitrogen source is present in this data. Corn has shown to grow better with higher nitrogen rates leading to greater nitrogen concentrations (Blackshaw et al. 2003; Blackshaw et al. 2005; Lindsey et al. 2013) and yielding greatest (Noellsch et al. 2009) or the same (Cahill et al 2007) with time release fertilizers followed by urea fertilizers (Noellsch et al. 2009) and organic fertilizers resulting in the lowest yield due to the way in which rates of the litter are calculated (Adeli et al. 2012). The interaction of nitrogen source by nitrogen rate by weed removal height in corn stalks again shows the trend of increasing nitrogen content with increase in nitrogen rate applied per source. In some cases the weed free plots have greater percentages of nitrogen content than those plots where weeds were allowed to remain for a portion of the season. However, these differences are minimal with one example being sulfur coated urea at a rate of 135 kg N/ha where
the corn and weeds as suggested in previous studies (Dalley et al. 2006; Fausey et al. 1997) but, this competition does seem minimal.
Effects of Treatment on corn yield
Pearson correlations (Table 20) indicated that with greater weed densities of Palmer amaranth greater nitrogen content was present in Palmer amaranth. Large crabgrass also showed greater nitrogen content when the large crabgrass densities were greater. Corn sampling date 1 showed a lesser nitrogen concentration with a greater density of either Palmer amaranth or large crabgrass. The correlations with weed density and nitrogen concentrations are expected as more nutrients are needed when more plants are present. The negative relationship between corn and weed densities present seems to further demonstrate the competition that occurs between a crop and weed species (Dalley et al. 2006; Fausey et al. 1997)
Source of Materials 1
Atrazine Herbicide, Syngenta, Wilmington, DE 19810. 2
CO2 Pressurized Backpack Sprayer, Spraying Systems Co., Wheaton, IL 60189. 3
Glyphosate Herbicide, Monsanto, St. Louis, MO 63167. 4
Round-up Ready Field Corn Seed, Monsanto, St. Louis, MO 63167. 5
SAS Statistical Software, Version 9.3, Cary, NC 27513. 6
S-Metolachlor Herbicide, Syngenta, Wilmington, DE 19810. 7
Literature Cited
Adeli, A., H. Tewolde, and J.N. Jenkins. 2012. Broiler litter type and placement effects on corn growth, nitrogen utilization, and residual soil nitrate-nitrogen in a no-till field. Agron. Journ. 104:43-48.
Barker, D.C., S.Z. Knezevic, A.R. Martin, D.T. Walters, and J.L. Lindquist. 2006. Effect of nitrogen addition on the comparative productivity of corn and velvetleaf (Abutilon theophrasti). Weed Sci. 54: 354-363.
Blackshaw, R.E. 2005. Nitrogen fertilizer, manure, and compost effects on weed growth and competition with spring wheat. Agron. Journ. 97: 1612-1621.
Blackshaw, R.E., R.N. Brandt, H.H. Janzen, T. Entz, C.A. Grant, and D.A. Derksen. 2003. Differential response of weed species to added nitrogen. Weed Sci. 51: 532-539. Cahill, S., D. Osmond, C. Crozier, D. Israel, and R. Weisz. 2007. Winter wheat and maize
response to urea ammonium nitrate and a new urea formaldehyde polymer fertilizer. Agron. Journ. 99: 1645-1653.
Cassman, K.G., A. Dobermann, and D.T. Walters. 2002. Agroecosystems, nitrogen-use efficiency, and nitrogen management. Ambio. 31: 132-140.
Campbell, E.G. 1924. Nitrogen content of weeds. Bot. Gazette. 78: 103-115.
Dalley, C.D., M.L. Bernards, and J.J. Kells. 2006. Effect of weed removal timing and row spacing on soil moisture in corn (Zea mays). Weed Tech. 20: 399-409.
DiTomaso, J.M. 1995. Approaches for improving crop competitiveness through the manipulation of fertilization strategies. Weed Sci. 43: 491-497.
Doyle, A.D. and I.C.R. Holford. 1993. The uptake of nitrogen by wheat, its agronomic efficiency and their relationship to soil and fertilizer nitrogen. Aust. Journ. Agric. 44: 1245-1258.
Evans, S.P., S.Z. Knezevic, J.L. Lindquist, C.A. Shapiro, and E.E. Blankenship. 2003.
Nitrogen application influences the critical period for weed control in corn. Weed Sci. 51: 408-417.
Fausey, J.C., J.J. Kells, S.M. Swinton, and K.A. Renner. 1997. Giant foxtail (Setaria faberi) interference in nonirrigated corn (Zea mays). Weed Sci. 45:256-260.
Gower, S.A., M.M. Loux, J. Cardina, S.K. Harrison, P.L. Sprankle, N.J. Probst, T.T.
Bauman, W. Bugg, W.S. Curran, R.S. Currie, R.G. Harvey, W.G. Johnson, J.J. Kells, M.D.K. Owen, D.L. Regehr, C.H. Slack, M. Spaur, C.L. Sprague, M. VanGessel, and B.G. Young.2003. Effect of postemergence glyphosate application timing on weed control and grain yield in glyphosate-resistant corn: results of a 2-yr multistate study. Weed Tech. 17: 821-828.
Harrison, S.K., E.E. Regnier, J.T. Schmoll, and J.E. Webb. 2001. Competition and fecundity of giant ragweed in corn. Weed Sci. 49: 224-229.
Knezevic, S.Z., S.P. Evans, E.E. Blankenship, R.C. Van Ackler, and J.L. Lindquist. 2002. Critical period for weed control: the concept and data analysis. Weed Sci. 50: 773-786.
Kurtz, T., S.W. Melsted, and R.H. Bray. 1952. The importance of nitrogen and water in reducing competition between intercrops and corn. Agron. Journ. 44:13-17. Lindquist, J.L. 2001. Mechanisms of crop loss due to weed competition. Pgs. 233-253 in
R.K.D. Peterson and L.G. Higley, eds. Biotic Stress and Yield Loss. Boca Raton, FL: CRC Press.
Lindquist, J.L., S.P. Evans, C.A. Shapiro, and S.Z. Knezevic. 2010. Effect of nitrogen addition and weed interference on soil nitrogen and corn nitrogen nutrition. Weed Tech. 24: 50-58.
Lindsey, L.E., D.D. Warncke, K. Steinke, and W.J. Everman. 2013. Fertilizer and population affects nitrogen assimilation of common lambsquarters (Chenopodium album) and redroot pigweed (Amaranthus retroflexus). Weed Sci. 61: 131-135.
Lindsey, L.E., W.J. Everman, A.J. Chomas, and J.J. Kells. 2012. Evaluation of application program and timing in herbicide-resistant corn. Weed Tech. 26: 617-621.
Mussaddak, Janet. 2008. Response of cotton to irrigation methods and nitrogen fertilization: yield components, water-use efficiency, nitrogen uptake and recovery. Soil Sci. and Plant Anal. 39: 2282-2302.
O’Neill, P.M., J.F. Shanahan, J.S. Schepers, and B. Caldwell. 2004. Agronomic responses of
corn hybrids from different eras to deficit and adequate levels of water and nitrogen. Agron. Journ. 96: 1660-1667.
Page, E.R., M. Tollenaar, E.A. Lee, L. Lukens, and C.J. Swanton. 2010. Shade avoidance: an integral component of crop-weed competition. Weed Res. 50: 281-288.
Sisson, V.A., T.W. Rufty, and R.E. Williamson. 1991. Nitrogen-use efficiency among flue cured tobacco genotypes. Crop Sci. 31: 1615-1620.
Soil Survey Staff, Natural Resources Conservation Service, United States Department of Agriculture. Official Soil Series Descriptions. Available online at
http://soils.usda.gov/technical/classification/osd/index.html. Accessed (10/9/2012).
Swanton, C.J. and S.F. Weise. 1991. Integrated weed management: the rationale and approach. Weed Tech. 5: 657-663.
Sweeney, A.E., K.A. Renner, C. Laboski, and A. Davis. 2008. Effect of fertilizer nitrogen on weed emergence and growth. Weed Sci. 56: 714-721.
Uremis, I., A. Bayat, A. Uludag, N. Bozdogan, E. Aksoy, A. Soysal, and O. Gonen. 2004. Studies on different herbicide application methods in second crop maize field. Crop Prot. 23: 1137-1144.
Williams, J.D., C.R. Crozier, J.G. White, R.P. Sripada, and D.A. Crouse. 2007. Comparison of soil nitrogen tests for corn fertilizer recommendations in the humid southeastern USA. Soil Sci. Soc. of Amer. Journ. 71: 171-180.
Wortman, S.E., A.S. Davis, B.J. Schutte, and J.L. Lindquist. 2011. Integrating management of soil nitrogen and weeds. Weed Sci. 59: 162-170.
Xu, Y., L. Nie, R.J. Buresh, J. Huang, K. Cui, B. Xu, W. Gong, and S. Peng. 2010. Agronomic performance of late-season rice under different tillage, straw, and nitrogen management. 115: 79-84.
Table 1: Density of Palmer amaranth and large crabgrass removed at 8 or 16 cm at Clayton in 2011 as influenced by nitrogen source and rate.
Nitrogen Sourcea Nitrogen Rate Palmer amaranth large crabgrass 8 cm 16 cm 8 cm 16 cm kgN/ha ---0.25 m2--- Urea-NH4 Nitrate 68 149.25 105.5 83.75 50.5
135 83.5 96 136.75 94.75
202 110 83.25 82.5 108.75
S Coated Urea 68 96.25 75.75 262.5 39
135 104.5 89 87.75 65.75
202 84.5 84.5 359 93
Chicken Litter 68 53 70.75 265 46
135 81 80.75 332.5 60.5
202 68.25 58.5 128.5 79.5
Table 2: Density of Palmer amaranth and large crabgrass removed at 8 or 16 cm at Rocky Mount in 2011 as influenced by nitrogen source and rate.
Nitrogen Sourcea
Nitrogen Rate
Palmer amaranth large crabgrass
8 cm 16 cm 8 cm 16 cm kgN/ha ---0.25 m2---
Urea-NH4 Nitrate 68 88.25 55.5 26.25 17
135 109 43 31.25 21
202 41.5 41.75 11.75 16.25
S Coated Urea 68 72 39.5 28.25 27.25
135 78.25 50 38.25 28.5
202 80.75 45.75 15.75 19
Chicken Litter 68 125 52.25 33 32.5
135 111.75 66.5 34 19.75
Table 3: Density of Palmer amaranth and large crabgrass removed at 8 or 16 cm at Clayton in 2012 as influenced by nitrogen source and rate.
Nitrogen Sourcea Nitrogen Rate Palmer amaranth large crabgrass 8 cm 16 cm 8 cm 16 cm kgN/ha ---0.25 m2--- Urea-NH4 Nitrate 68 153.75 108.75 86.5 52.25
135 86 98.75 141.25 97
202 113.25 85.75 85 111.75
S Coated Urea 68 99.25 78 271 40
135 107.75 92 90.25 68
202 87 86.75 370.25 95.75
Chicken Litter 68 54.5 72.75 273.5 47.25
135 83.25 83.25 343.25 62
202 70 60.25 132.5 82
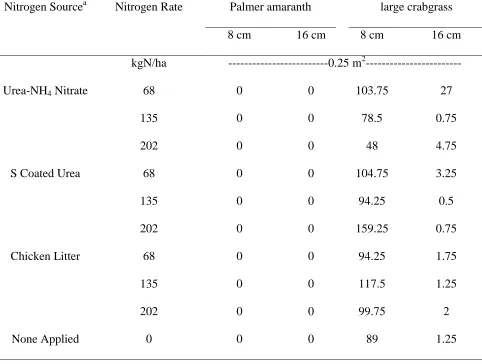
Table 4: Density of Palmer amaranth and large crabgrass removed at 8 or 16 cm at Rocky Mount in 2012 as influenced by nitrogen source and rate.
Nitrogen Sourcea Nitrogen Rate Palmer amaranth large crabgrass
8 cm 16 cm 8 cm 16 cm kgN/ha ---0.25 m2--- Urea-NH4 Nitrate 68 0 0 103.75 27
135 0 0 78.5 0.75
202 0 0 48 4.75
S Coated Urea 68 0 0 104.75 3.25
135 0 0 94.25 0.5
202 0 0 159.25 0.75
Chicken Litter 68 0 0 94.25 1.75
135 0 0 117.5 1.25
202 0 0 99.75 2
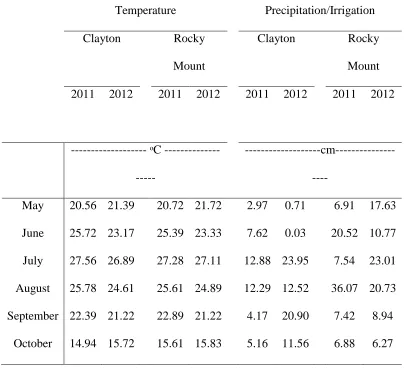
Table 5: Temperature, Precipitation, and Irrigation Data for Clayton and Rocky Mount in 2011 and 2012
Temperature Precipitation/Irrigation Clayton Rocky
Mount
Clayton Rocky Mount 2011 2012 2011 2012 2011 2012 2011 2012
--- ᵒC ---
---cm---
May 20.56 21.39 20.72 21.72 2.97 0.71 6.91 17.63 June 25.72 23.17 25.39 23.33 7.62 0.03 20.52 10.77 July 27.56 26.89 27.28 27.11 12.88 23.95 7.54 23.01 August 25.78 24.61 25.61 24.89 12.29 12.52 36.07 20.73 September 22.39 21.22 22.89 21.22 4.17 20.90 7.42 8.94
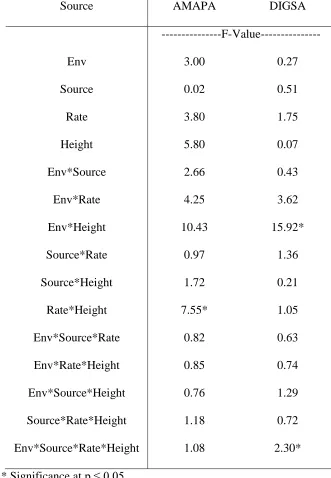
Table 6: ANOVA for Nitrogen Content in Palmer amaranth and large crabgrass at Clayton and Rocky Mount in 2011 and 2012*
Source AMAPA DIGSA
---F-Value---
Env 3.00 0.27
Source 0.02 0.51
Rate 3.80 1.75
Height 5.80 0.07
Env*Source 2.66 0.43
Env*Rate 4.25 3.62
Env*Height 10.43 15.92*
Source*Rate 0.97 1.36
Source*Height 1.72 0.21
Rate*Height 7.55* 1.05
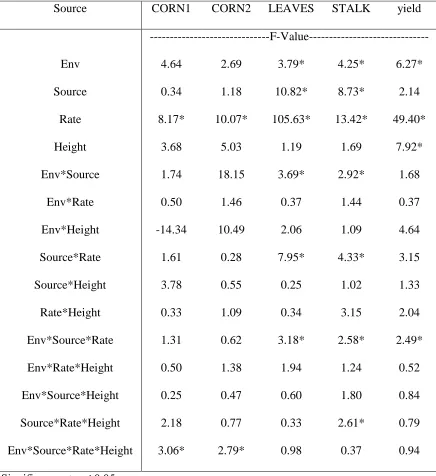
Table 7: ANOVA for Corn Nitrogen Content in whole plants, Corn Ear Leaves, Corn Stalks as well as Corn Yield at Clayton and Rocky Mount in 2011 and 2012*
Source CORN1 CORN2 LEAVES STALK yield ---F-Value---
Env 4.64 2.69 3.79* 4.25* 6.27*
Source 0.34 1.18 10.82* 8.73* 2.14 Rate 8.17* 10.07* 105.63* 13.42* 49.40* Height 3.68 5.03 1.19 1.69 7.92* Env*Source 1.74 18.15 3.69* 2.92* 1.68
Table 8 :Nitrogen content in Palmer amaranth as impacted by the combination of weed removal time and nitrogen rate applieda
Nitrogen rate Weed Removal Height
kg N/ha 8 cm 16cm
---kg N/ha---
68 7.22 b 8.76 b
135 8.36 b 20.53 a
202 9.09 b 22.33 a
a
Table 9: Nitrogen Content in large crabgrass as Influenced by Environment and Weed Removal Heighta
Environments Weed
Removal Height (cm)
Clayton 2011 Rocky Mount 2011
Clayton 2012
Rocky Mount 2012
---kg N/ha--- 8 11.69 b 5.97 a 12.26 b 25.96 a
16 22.05 a 8.66 a 29.10 a 0.01 b
aMeans within a column followed by the same letter are not significantly different according to Fisher’s Protected LSD test at p ≤
Table 10 :Large Crabgrass as Impacted by Environment, Nitrogen Source, Nitrogen Rate and Weed Removal Heightab
Environment
Nitrogen Source
Nitrogen Rate (kg N/ha)
Clayton 2011 Rocky Mount 2011
Clayton 2012 Rocky Mount 2012
8 cm 16 cm 8 cm 16 cm 8 cm 16 cm 8 cm 16 cm ---kg N/ha--- UAN 68 5.53c 9.69c 2.52c 8.94c 11.87c 7.53c 39.11b 0.00c UAN 135 9.55c 12.34c 3.81c 5.93c 22.07c 28.10bc 22.65bc 0.83c UAN 202 5.38c 37.48ab 3.12c 3.50c 15.65c 34.04b 10.32c -2.14c
Table 10 Continued
CCL 202 5.50c 16.24c 11.82c 7.68c 13.65c 31.06bc 31.91bc 0.00c a
Abbreviations: CCL, composted chicken litter; NA, None applied; SCU, sulfur coated urea; UAN, urea ammonium nitrate. bMeans within a column followed by the same letter are not significantly different according to Fisher’s Protected LSD test at p ≤
Table 11: Corn Nitrogen Content at Sampling Date 1 as Impacted by Environment, Nitrogen Source, Nitrogen Rate and Weed Removal Heightab
Environment
Nitrogen Source
Nitrogen Rate (kg N/ha)
Clayton 2011 Rocky Mount 2011 Clayton 2012 Rocky Mount 2012 0 cm 8 cm 0 cm 8 cm 0 cm 8 cm 0 cm 8 cm
Table 11 Continued
CCL 202 3.36cd 2.54d 8.33bc 5.53c 4.30cd 4.02cd 4.94cd 4.21cd a
Abbreviations: CCL, composted chicken litter; NA, None applied; SCU, sulfur coated urea; UAN, urea ammonium nitrate. bMeans within a column followed by the same letter are not significantly different according to Fisher’s Protected LSD test at p ≤
Table 12: Corn Nitrogen Content at Sampling Date 2 as Impacted by Environment, Nitrogen Source, Nitrogen Rate and Weed Removal Heightab
Environments
Nitrogen Source
Nitrogen Rate (kg N/ha)
Clayton 2011 Rocky Mount 2011 Clayton 2012 Rocky Mount 2012
0 cm 16 cm 0 cm 16 cm 0 cm 16 cm 0 cm 16 cm
---kg N/ha---
UAN 68 11.75bcd 7.01de 10.24bcd 9.69cd 6.56de 5.96de 5.81de 3.52e
UAN 135 19.30ab 3.46e 18.24b 9.70cd 11.17bcd 10.01cd 6.25de 4.08de UAN 202 20.54ab 9.69cd 23.73ab 11.32bc 11.12bc 9.01cd 2.67e 4.70de SCU 68 8.85cde 4.54de ---- 7.35cd 9.35c 4.79de 3.22e 2.54e
Table 12 Continued
CCL 135 16.44bcd 6.53de 11.51bcd 8.43cd 11.27bc 7.66cd 6.38de 4.90de
CCL 202 16.58b 7.21d 12.62bcd 9.91cd 11.46bc 10.14cd 8.03cd 5.16de a
Abbreviations: CCL, composted chicken litter; NA, None applied; SCU, sulfur coated urea; UAN, urea ammonium nitrate. b
Table 13: Nitrogen Content in Corn Leaves as Influenced by Nitrogen Rate Applieda Nitrogen rate
(kg N/ha)
---%---
68 1.62 c
135 1.84 b
202 2.10 a
aMeans within a column followed by the same letter are not significantly different according to Fisher’s Protected LSD test at p ≤
Table 14: Nitrogen Content in Corn Ear Leaves as Influenced by the Combination of Environment, Nitrogen Source and Rateab
Environment
Nitrogen Source Nitrogen Rate (kg N/ha)
Clayton 2011 Rocky Mount 2011
Clayton 2012 Rocky Mount 2012
---%---
UAN 68 1.85 c 1.52 c 1.70 c 1.68 c
UAN 135 2.07 bc 2.11 b 2.10 b 1.98 b
UAN 202 2.53 a 2.34 a 2.27 a 2.35 a
SCU 68 1.70 c 1.45 cd 1.69 c 1.51 c
SCU 135 2.14 b 1.32 cd 2.07 b 1.63 c
SCU 202 2.40 a 2.03 b 2.35 a 2.07 b
CCL 68 1.87 c 1.24 d 1.71 c 1.55 c
CCL 135 1.91 bc 1.30 cd 1.85 c 1.54 c
a
Abbreviations: CCL, composted chicken litter; NA, None applied; SCU, sulfur coated urea; UAN, urea ammonium Table 14 Continued
nitrate. b
Means within a column followed by the same letter are not significantly different according to Fisher’s Protected LSD test at p ≤ 0.05.
Table 15: Nitrogen Content in Corn Stalks as Influenced by the Combination of Environment, Nitrogen Source and Ratea
Environments
Nitrogen Source Nitrogen Rate (kg N/ha)
Clayton 2011 Rocky Mount 2011
Clayton 2012 Rocky Mount 2012
---%---
UAN 68 0.45 ab 0.27 c 0.34 b 0.29 bc
UAN 135 0.43 ab 0.38 b 0.42 ab 0.26 bc
UAN 202 0.59 a 0.54 a 0.46 a 0.43 a
SCU 68 0.36 b 0.22 c 0.31 b 0.23 c
SCU 135 0.38 b 0.19 c 0.42 ab 0.25 bc
SCU 202 0.38 b 0.32 bc 0.43 ab 0.32 b
CCL 68 0.32 b 0.19 c 0.34 b 0.25 bc
CCL 135 0.33 b 0.20 c 0.39 ab 0.26 bc
CCL 202 0.33 b 0.21 c 0.43 a 0.25 bc
a
Table 15 Continued a
Table 16: Nitrogen Content in Corn Stalks as Impacted by the Combination of Nitrogen Source, Rate, and Weed Removal Heightab
Nitrogen Source Nitrogen Rate (kg N/ha) Weed Removal Height
0 cm 8 cm 16 cm
---%---
UAN 68 0.32 cd 0.35 c 0.34 c
UAN 135 0.43 b 0.35 c 0.35 c
UAN 202 0.45 b 0.55 a 0.51 ab
SCU 68 0.27 d 0.27 d 0.30 cd
SCU 135 0.32 cd 0.30 cd 0.31 cd
SCU 202 0.42 b 0.31 cd 0.33 cd
CCL 68 0.26 d 0.27 d 0.29 d
CCL 135 0.33 cd 0.27 d 0.29 d
CCL 202 0.33 cd 0.26 d 0.31 cd
a
b
Table 17: Corn Yield as Impacted by Nitrogen Rate Applieda Nitrogen rate (kg N/ha) ---kg N/ha---
68 3497 c
135 4379 b
202 4995 a
a
Table 18: Corn Yield as Impacted by Weed Removal Heighta Weed Removal Height (cm) ---kg N/ha---
0 4763 a
8 4238 ab
16 3868 b
a
Table 19: Corn Yield as Influenced by the Combination of Environment, Nitrogen Source and Rateab
Environments
Nitrogen Source
Nitrogen Rate (kg N/ha)
Clayton 2011 Rocky Mount 2011
Clayton 2012 Rocky Mount 2012
---%---
UAN 68 2272 b 5522 bc 3677 b 2940 bc
UAN 135 2729 ab 7476 ab 4714 ab 4679 ab
UAN 202 3490 ab 6900 b 5260 a 4558 ab
SCU 68 1806 b 5184 c 3706 b 2049 c
SCU 135 3850 a 5455 bc 4757 ab 3563 b
SCU 202 5147 a 8639 a 4150 b 5354 a
CCL 68 3484 ab 5093 c 3419 b 2805 bc
CCL 135 3717 ab 5082 c 3511 b 3008 bc
Table 19 Continued a
Abbreviations: CCL, composted chicken litter; NA, None applied; SCU, sulfur coated urea; UAN, urea ammonium nitrate.
b
Table 20: Pearson correlations of Nitrogen Content and Weed Density
Visible Weed Control
Source AMAPA Density DIGSA Density
Sample Type P>F R² P>F R²
AMAPA <.0001 0.50 0.6723 -0.03 DIGSA 0.7404 0.02 <.0001 0.48 CORN Sample Date 1 0.0073 -0.18 0.0006 -0.22 CORN Sample Date 2 0.7853 -0.02 0.4343 0.05
DIFFERENT NITROGEN SOURCES, RATES, AND WEED REMOVAL TIMING IMPACT NITROGEN CONTENT IN SOILS
Alexandra M. Knight, Wesley J. Everman, David Jordan, Ron Heiniger, and T. Jot Smyth ---Formatted for Weed Science---
Nitrogen is one of the key macronutrients required for the growth and production in a corn (Zea mays L.) cropping system. Movement of the nutrient in a soil system is dependent on many factors including soil type, microbial activity, and weather patterns. Field studies were conducted in 2011 and 2012 at the Upper Coastal Plains Research Station near Rocky Mount, NC and at the Central Crops Research Station in Clayton, NC. Treatment factors included N source, N rate, and weed removal time with a factorial treatment arrangement. The N sources included urea ammonium nitrate (UAN), chicken litter (CCL) and sulfur coated urea (SCU) with rates of 0, 68, 135, and 202 kg N/ha. Weed removal times were at 0 (weed free), 8, and 16 cm heights. Soil samples were collected at the 8 and 16 centimeter weed removal times and one week following the final weed removal to analyze
Nomenclature: Corn (Zea mays), Palmer amaranth (Amaranthus palmeri S. Wats.), large crabgrass (Digitaria sanguinalis)
Key Words: Nitrogen, Competition
___________________________________________________________________________ *First, second, third, and fourth authors: Graduate Research Assistant, Assistant Professor, Professor and Professor. Crop Science Department, P.O. Box 7620, North Carolina State University, Raleigh, NC 27695-7620. Fifth author: Professor. Soil Science Department, P.O. Box 7619, North Carolina State University, Raleigh, NC 27695-7620.
ammonium and nitrate content in the soils. Sample date 2 in 2011 had a significant environment by source by rate interaction as did sample date 1 in 2012. Sample date 1 in 2012 also had a significant environment by rate by weed removal height interaction and a source by rate by weed removal height interaction. Samples taken one week after final weed removal timing had significant interactions of source by rate and rate by height. Rate was shown to impact plant available nitrogen in the soil a great deal. Also, the organic source generally had less plant available nitrogen than that of the synthetic fertilizers as more plant available nitrogen was put on the synthetic fertilizer plots at the beginning of the season.
Introduction
Loss of nitrogen in a cropping system is most often attributed to rainfall which may cause leaching, denitrification, or the volatilization of ammonia (Wilkison and Blevins 1999). Leaching is dependent on many factors including soil type where soils with higher sand content, such as loamy sands, are more prone to leaching (Gehl et al. 2005). Volatilization, however, may be reduced by incorporating the fertilizer upon application (Nelson et al. 2010). However, it should also be noted that when moisture levels are too low, or simply when conditions are dryer, overall nitrogen content will decrease and negatively impact yield of the crop (Dharmakeerthi et al. 2006).
results showed that nitrate levels in the soil were only greater in the ammonium nitrate system at five weeks after planting and this was at a depth of between 15 and 30 centimeters in the soil (Crozier et al. 1998).
The uptake efficiency of N is dependent upon many factors including soil types, crop type, and the amount of N fertilizer applied (O'Neill et al. 2004; Weih et al. 2011). The efficient use of the nutrient N will indicate how well fertilizer applied is used and along the same lines, how N used can result in environmental contamination for the surrounding area and economic losses for the producer (O'Neill et al. 2004). Determining how North Carolina corn production may be impacted by different fertilizers could improve nitrogen use
increase due to inorganic fertilizer application is roughly 14 percent greater than yield following application of organic poultry litter fertilizer however, this increase can be attributed to the fact that the poultry litter is applied with a total nitrogen rate while the synthetic fertilizers are applied with plant available nitrogen in mind. Greater yield in the inorganic fertilizer corresponded with the highest nitrate level in the soil where this fertilizer was applied. It should also be noted that the pelletized chicken litter treatment had greater soil nitrate than the non-pelletized chicken litter treatment. This information led to the conclusion that inorganic nitrogen fertilizer caused nitrogen concentration to rise by 48
percent over the control and grain nitrogen utilization was 57 percent greater than the control. The nitrogen utilization of the chicken litter treatments was found to be greater in the
broadcast pelletized litter treatment. Nitrogen use efficiency was found to be 56 percent greater for the non-pelletized chicken litter application when applied subsurface rather than the surface broadcast method (Adeli et al. 2012). Within inorganic nitrogen sources a difference in yield is still observed where yields of time release fertilizers are greater than those from a urea source (Noellsch et al. 2009) however, studies such as that by Cahill et al. (2010) have shown no difference in yield from time release fertilizers.
system (Reddy and Reddy 1993). The negative charge on NO3- makes it more difficult to be taken up by plant roots, and due partially to the fact more energy or ATP is required for uptake. The uptake of NO3- into the plant is driven by a proton gradient at the root cell wall which helps provide the energy necessary for its movement. Transport of this form of nitrogen has have a high affinity constitutive system and low affinity inducible system (DiTomaso 1995). Nitrate levels tend to be regulated by influx of the nutrient and will be taken up best when the roots have had previous exposure to nitrate and will decrease upon roots having limited access to nitrate for 1 to 2 days (Hole et al. 1990). Uptake of NO3- will increase with an increase in soil levels of NO3- by Michaelis Menten kinetics until a
concentration of 0.5 mM at which point the uptake increases in a linearly modeled fashion (Aslam et al. 1992). Ammonium movement into a plant is different from that of nitrate. Movement of ammonium in the system is said to be by a high affinity saturable carrier-mediated system which is regulated by negative feedback inhibition and at high