ISSN(Online): 2319-8753 ISSN (Print): 2347-6710
I
nternational
J
ournal of
I
nnovative
R
esearch in
S
cience,
E
ngineering and
T
echnology
(A High Impact Factor, Monthly, Peer Reviewed Journal)
Visit: www.ijirset.com Vol. 7, Special Issue 2, March 2018
Sentiment Analysis of Twitter Posts
Jagadish Kumar, Arvind Iyer , Nanda Kumar.R , Parthiban.N
Department of Information Technology, Velammal Institute of Technology, Chennai, Tamil Nadu, India
ABSTRACT: Mass media sources, specifically the news media, have traditionally informed us of daily events. In modern times, social media services such as Twitter provide an enormous amount of user-generated data, which have great potential to contain informative news-related content. For these resources to be useful, we must find a way to filter noise and only capture the content that, based on its similarity to the news media, is considered valuable. However, even after noise is removed, information overload may still exist in the remaining data—hence; it is convenient to prioritize it for consumption. To achieve prioritization, information must be ranked in order of estimated importance considering three factors. First, the temporal prevalence of a particular topic in the news media is a factor of importance, and can be considered the media focus (MF) of a topic. Second, the temporal prevalence of the topic in social media indicates its user attention (UA). Last, the interaction between the social media users who mention this topic indicates the strength of the community discussing it, and can be regarded as the user interaction (UI) toward the topic. We propose an unsupervised framework—SociRank—which identifies news topics prevalent in both social media and the news media, and then ranks them by relevance using their degrees of MF, UA, and UI. The novelty of the proposed approach is that posts are not simply characterized by a sentiment score, as is the case with machine learning-based classifiers, but instead receive a sentiment grade for each distinct notion in the post. Overall, our proposed architecture results in a more detailed analysis of post opinions regarding a specific topic. Our experiments show that SociRank improves the quality and variety of automatically identified news topic.
KEYWORDS: Twitter 4j library, twitter sentimental analysis.
I.INTRODUCTION
The mining of valuable information from online sources has become a prominent research area in information technology in recent years. Historically, knowledge that apprises the general public of daily events has been provided by mass media sources, specifically the news media. Many of these news media sources have either abandoned their hardcopy publications and moved to the World Wide Web, or now produce both hard-copy and Internet versions simultaneously. These news media sources are considered reliable because they are published by professional journalists, who are held accountable for their content.
On the other hand,the Internet, being a free and open forum for information exchange, has recently seen a fascinating phenomenon known as social media. In social media, regular, non journalist users are able to publish unverified content and express their interest in certain events.
Twitter4J is an official Java library for the Twitter API. Twitter4J one can easily integrate any application with the Twitter service. Twitter4J has features such as, 100% runs on Java Platform version 5 or later, Android platform and Google App Engine ready, Zero dependency, No additional jars required, Built-in OAuthsupport, Out-of-the-box gzip support, 100% Twitter API 1.1 compatible. By adding twitter4j-core-4.0.4.jar to any application class path. If you are familiar with Java language, looking into the Java Doc should be the shortest way for you to get started twitter4j. Twitter interface is the one you may want to look at first
ISSN(Online): 2319-8753 ISSN (Print): 2347-6710
I
nternational
J
ournal of
I
nnovative
R
esearch in
S
cience,
E
ngineering and
T
echnology
(A High Impact Factor, Monthly, Peer Reviewed Journal)
Visit: www.ijirset.com Vol. 7, Special Issue 2, March 2018
Facebook, MySpace), wikis, blogs, multi-media sharing sites (e.g. YouTube, Flickr), mash-ups and rich web applications. One of these activities is micro-blogging, which initially attracted comparatively less attention, but gradually became a highly popular communication tool for a considerable percentage of users. Micro-blogging is in principle based on blogs (i.e. Web logs), where users can post opinions, experiences and queries on any chosen topic. The main difference between micro- and traditional blogs is the strict constraint in content size.
Currently, the most popular on-line micro-blogging service is Twitter, which enables its users to send and receive text-based posts, known as ‘‘tweets’’, consisting of up to 140 characters. Twitter was created in 2006 and currently records over 140 million active users that generate over 340 million tweets per day. With their rapidly increasing popularity, micro-blogging services, like Twitter, have evolved into a practical means for sharing opinions on almost all aspects of everyday life. The strict character limit of tweets forces users to be concise and eventually more expressive than with social networks and blogs. Thus, micro-blogging posts are imbued with emotional information and are considered as rich opinion mining data sources .Additionally, tweets can be processed more effectively than lengthy blog posts and articles.
Micro blogs have become one of the most popular social media outlets. One micro blogging service in particular, Twitter, is used by millions of people around the world, providing enormous amounts of user-generated data. One may assume that this source potentially contains information with equal or greater value than the news media, but one must also assume that because of the unverified nature of the source, much of this content is useless. For social media data to be of any use for topic identification, we must find a way to filter uninformative information and capture only information which, based on its content similarity to the news media, may be considered useful or valuable. The news media presents professionally verified occurrences or events, while social media presents the interests of the audience in these areas, and may thus provide insight into their popularity. Social media services like Twitter can also provide additional or supporting information to a particular news media topic. In summary, truly valuable information may be thought of as the area in which these two media sources topically intersect. Unfortunately, even after the removal of unimportant content, there is still information overload in the remaining news-related data, which must be prioritized for consumption.
LITERATURESURVEY
The main research areas applied in this paper include: topic identification, topic ranking social, network analysis, keyword extraction, co-occurrence similarity measures, and graph clustering. Extensive work has been conducted in most of these areas.
A. Topic Identification
Much research has been carried out in the field of topic identification—referred to more formally as topic modeling.
ISSN(Online): 2319-8753 ISSN (Print): 2347-6710
I
nternational
J
ournal of
I
nnovative
R
esearch in
S
cience,
E
ngineering and
T
echnology
(A High Impact Factor, Monthly, Peer Reviewed Journal)
Visit: www.ijirset.com Vol. 7, Special Issue 2, March 2018
of the topics. Zhao carried out similar work by developing a Twitter-LDA model designed to identify topics in tweets. Their work, however, only considers the personal interests of users, and not prevalent topics at a global scale.
Another trending area of related research is the detection of “bursty” topics (i.e., topics or events that occur in short, sudden episodes). proposed a method that uses a state machine to detect bursty topics in micro blogs.
Their method also determines whether user posts are personal or refer to a particular trending topic. Also developed a model that detects topics from social media data, distinguishing between temporal and stable topics. These methods, however, only use data from micro blogs and do not attempt to integrate them with real news. Additionally, the detected topics are not ranked by popularity or prevalence.
B. Topic Ranking
Another major concept that is incorporated into this paper is topic ranking. There are several means by which this task can be accomplished, traditionally being done by estimating how frequently and recently a topic has been reported by mass media. Wang proposed a method that takes into account the users’ interest in a topic by estimating the amount of times they read stories related to that particular topic. They refer to this factor as the UA. They also used an aging theory developed by Chen to create, grow, and destroy a topic. The life cycles of the topics are tracked by using an energy function. The energy of a topic increases when it becomes popular and it diminishes over time unless it remains popular. We employ variants of the concepts of MF and UA to meet our needs, as these concepts are both logical and effective. Other works have made use of Twitter to discover news-related content that might be considered important.
Sankara narayanan developed a system called TwitterStand, which identifies tweets that correspond to breaking news. They accomplish this by utilizing a clustering approach for tweet mining. Phelan developed
a recommendation system that generates a ranked list of news stories. News are ranked based on the co-occurrence of popular terms within the users’ RSS and Twitter feeds.
Both of these systems aim to identify emerging topics, but give no insight into their popularity over time. Moreover, the work by Phelan only produces a personalized ranking (i.e., news articles tailored specifically to the content of a single user), rather than providing an overall ranking based on a sample of all users. Nevertheless, these works provide us with a basis for extending the premise of UA.
Research has also been carried out in topic discovery and ranking from other domains. Shubhankar developed an algorithm that detects and ranks topics in a corpus of research papers. They used closed frequent keyword-sets to form topics and a modification of the Page Rank algorithm to rank them. Their work, however, does not integrate or collaborate with other data sources, as accomplished by Social Rank.
C. Social Network Analysis
In the case of UA, Wang et al. [11] estimated this factor by using anonymous website visitor data. Their method counts the amount of times a site was visited during a particular period of time, which represents the UA of the topic to which the site is related. Our belief, on the other hand, is that, although website usage statistics provide initial proof of attention, additional data are needed to corroborate it. We employ the use of social media, specifically Twitter, as a means to estimate UA. When a user tweets about a particular topic, it signifies that the user is interested in the topic and it has captured her attention more so than visiting a website related to it. In summary, visiting a website might be the initial stimulus, but taking the additional step of discussing a topic via social media signifies genuine attention.
ISSN(Online): 2319-8753 ISSN (Print): 2347-6710
I
nternational
J
ournal of
I
nnovative
R
esearch in
S
cience,
E
ngineering and
T
echnology
(A High Impact Factor, Monthly, Peer Reviewed Journal)
Visit: www.ijirset.com Vol. 7, Special Issue 2, March 2018
D. Keyword Extraction
Concerning the field of keyword or informative term extraction, many unsupervised and supervised methods have been proposed. Unsupervised methods for keyword extraction rely solely on implicit information found in individual texts or in a text corpus. Supervised methods, on the other hand, make use of training datasets that have already been classified.
Among the unsupervised methods, there are those that employ statistical measures of term in formativeness or relevance, such as term specificity TFIDF, word frequency n-grams and word co-occurrence .Other unsupervised approaches are graph-based, where a text is converted into a graph whose nodes represent text units (e.g., words, phrases and sentences) and whose edges represent the relationships between these units. The graph is then recursively iterated and relevance scores are assigned to each node using different approaches. A popular example of a graph based keyword extraction method is Text Rank, proposed by Mihalcea and Tarau it utilizes the premise of the popular Page Rank algorithm.
There has also been much work on keyword extraction using supervised and hybrid approaches. Two traditional supervised frameworks are KEA and which use machine learning algorithms for the effective extraction of keywords. Other innovative approaches for keyword extraction have been proposed in recent years, including the application of neural networks [26]–[28] and conditional random fields [29]. Hybrid methods (i.e., methods that make use of unsupervised and supervised components) have been proposed as well, such as Hybrid Rank [30], which makes use of collaboration between the two approaches.
Due to its simple implementation, we use text Rank to extract keywords from the news media sources. Furthermore, Text Rank does not require training or any document corpus for its operation.
E. Co-Occurrence Similarity
Matsuo and Ishizuka suggested that the co-occurrence relationship of frequent word pairs from a single document .The works by Sankaranarayanan and Phelan support this premise is may provide statistical information to aid in the identification of the document’s keywords. They proposed that if the probability distribution of co-occurrence between a term x and all other terms in a document is biased to a particular subset of frequent terms, then term x is likely to be a keyword. Even though our intention is not to employ co-occurrence for keyword extraction, this hypothesis emphasizes the importance of co-occurrence relationships. Chen proposed a novel co-occurrence similarity measure in which they measure the association of terms using snippets returned by Web searches. They refer to this measure as co-occurrence double checking (CODC). Bollegala. proposed a method that uses page counts and text snippets from Web searches to measure the similarity between words or entities. They compared their method with CODC , as well as with variants of several other co-occurrence similarity measures, such as the overlap (Simpson, Dice , point-wise mutual information (PMI, Jacquard , and cosine similarities. Since establishing the importance of the word-pair concurrence distribution in the actual corpus of tweets is of more interest to us, we did not employ Boll gala’s or Chen’s semantic similarity methods. In this paper, we tested other similarity measures, and found that the Dice similarity measure provided the best results.
F. Graph Clustering
ISSN(Online): 2319-8753 ISSN (Print): 2347-6710
I
nternational
J
ournal of
I
nnovative
R
esearch in
S
cience,
E
ngineering and
T
echnology
(A High Impact Factor, Monthly, Peer Reviewed Journal)
Visit: www.ijirset.com Vol. 7, Special Issue 2, March 2018
Consequently, the edges connecting different clusters will have high edge betweenness, and removing them iteratively will yield well-defined clusters. Newman realized, however, that the main disadvantage of the algorithm was its high computational demand, and thus proposed a new method to identify clusters based on modularity. Modularity is a measure designed to estimate the strength of division of a network into clusters. Networks that possess a high modularity value have dense connections between the nodes within each cluster, but sparse connections
between nodes in different clusters. Newman’s new algorithm calculated modularity as it progressed, making it simple to find the optimal clustering structure. Given their effectiveness, the concepts of betweenness and transitivity are both applied into our graph clustering algorithm.
EXISTINGSYSTEM
Media Focus Estimation: To estimate the MF of a TC, the news articles that are related to TC are first selected. This presents a problem similar to the selection of tweets when calculating UA. The weighted nodes of TC are used to accurately select the articles that are genuinely related to its inherent topic. The only difference now is that instead of comparing node combinations with tweet content, they are compared to the top k keywords selected from each article. Hash tags are of great interest to us because of their potential to hold the topical focus of a tweet. However, hash tags usually contain several words joined together, which must be segmented in order to be useful. This problem, occured in our existing work. The segmented terms are then tagged as “hashtag.” To eliminate terms that are not relevant, only terms tagged as hashtag, noun, adjective or verb are selected. The terms are then lemmatized and added to set T, which represents all unique terms that appear in tweets from dates d1 to d2.
II.PROPOSEDSYSTEM
The goal of our method—Soci Rank—is to identify, consolidate and rank the most prevalent topics discussed in both news media and social media during a specific period of time. To achieve its goal, the system must undergo four main stages.
1.1) Preprocessing: Key terms are extracted and filtered from news and social data corresponding to a particular period of time.
1.2) Key Term Graph Construction: A graph is constructed from the previously extracted key term set, whose vertices represent the key terms and edges represent the co-occurrence similarity between them. The graph, after processing and pruning, contains slightly joint clusters of topics popular in both news media and social media.
1.3) Graph Clustering: The graph is clustered in order to obtain well-defined and disjoint TCs.
1.4) Content Selection and Ranking: The TCs from the graph are selected and ranked using the three relevance factors (MF, UA, and UI). Initially, news and tweets data are crawled from the Internet and stored in a database. News articles are obtained from specific news websites via their RSS feeds and tweets are crawled from the Twitter public timeline. A user then requests an output of the top k ranked news topics for a specified period of time between date d1 (start) and date d2 (end).
As already explained, the basic idea behind the proposed approach is to take advantage of a domain ontology for providing more elaborate sentiment scores regarding the notions contained in a tweet. The aim is to have a system that accepts as input a tweet (or a set of tweets) regarding a specific subject and provides sentiment scores for every aspect/feature of this subject. The architecture of the system we developed is presented in detail in a following section.
The proposed methodology is divided in two phases: (a) creation of the domain ontology (Section 1), and (b) sentiment analysis on a set of tweets, based on the concepts and properties included in the ontology (Section 2). These two phases are further described next.
2.1. Creating the domain ontology
ISSN(Online): 2319-8753 ISSN (Print): 2347-6710
I
nternational
J
ournal of
I
nnovative
R
esearch in
S
cience,
E
ngineering and
T
echnology
(A High Impact Factor, Monthly, Peer Reviewed Journal)
Visit: www.ijirset.com Vol. 7, Special Issue 2, March 2018
A. FCA basic elements
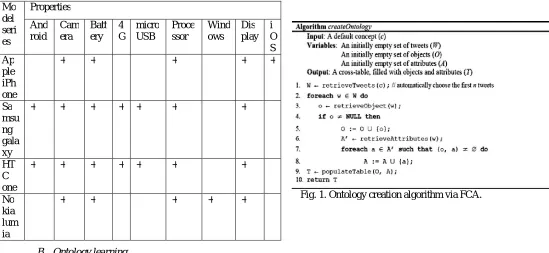
The main building block in FCA is the concept, which is described via two sets: The extension, which is a set of objects and the intension, which is a set of attributes (Ganter & Wille, 1999). Every object that belongs to the concept has all the attributes in the intension and every attribute that belongs to the concept is shared by all objects of the extension. The relationships between the set of objects and the set of attributes are represented by a formal context. A formal context K (O;A; I) is a triple where: O is a set of formal objects, A is a set of attributes, and, I is a binary incidence relation between the objects and the attributes; where (o,a) 2 I is read as ‘‘object o has attribute a’’A formal context can be represented as a cross-table, where the rows represent O, the columns represent A and the incidence relation I is represented by a series of crosses as shown in Table 1. Concepts can be organized into a concept lattice, which is based on the mathematical notion of lattices Concept lattices are visualized via Hasse diagrams. The nodes in the diagram represent concepts, while attributes and objects are denoted above and below the nodes, respectively. By traversing all the paths leading down from a node, one can retrieve the concept’s extension, while the opposite path leading up from the node retrieves the intension.
Table 1: Smartphone ontology.
Fig. 1. Ontology creation algorithm via FCA.
B. Ontology learning
An alternative to the manual FCA methodology presented above is offered by the various existing semi-automatic ontology learning techniques Ontology learning, also known as ontology extraction, ontology generation or ontology acquisition, refers to the task of automatically creating an ontology, via extracting concepts and relations from a given data set. Nevertheless, the task of creating an ontology in a fully automated manner still remains elusive to a great degree.
In this work, we resorted to OntoGen a semi-automatic, data-driven ontology editor. The software deploys text-mining techniques via an efficient user interface that reduces development time and complexity. Overall, the tool attempts to bridge the gap between complex ontology editors and domain experts, who do not necessarily possess ontology engineering skills.
ISSN(Online): 2319-8753 ISSN (Print): 2347-6710
I
nternational
J
ournal of
I
nnovative
R
esearch in
S
cience,
E
ngineering and
T
echnology
(A High Impact Factor, Monthly, Peer Reviewed Journal)
Visit: www.ijirset.com Vol. 7, Special Issue 2, March 2018
perform manual adjustments. Most of the aid provided by the system is based on the provided underlying data. In our case, the role of this data set is played by the initial set of retrieved tweets (see previous subsection), which is fed to OntoGen as a set of named line-documents (i.e. each tweet is stored as a separate text file, with the first word in the line serving as the document title/ID).
2.2. Sentiment analysis on tweets
The previously described process (Section 1) results in a formulated and populated domain ontology. The second phase of the proposed methodology constitutes the main effort of this work and performs the automatic sentiment analysis on a set of tweets. displays the overall architecture of the approach we propose in this paper, the overall process involves retrieving a set of tweets that correspond to entities in the ontology and performing sentiment analysis on each of the retrieved tweets. There are three distinct steps in the procedure:
(1) querying theontology for the corresponding attributes of each object (2) retrieving the relevant tweets
(3) performing the sentiment analysis.
Fig. 2. Architecture of the proposed approach
Step#1: Taking advantage of the ontology
In order to take advantage of the domain ontology created during the previous steps, the retrieved tweets have to contain information regarding the objects and attributes of reference. This is achieved via JENA a Java API for processing RDF/S and OWL ontologies. Having an ontology-based structured hierarchy of classes and properties, JENA assists in retrieving object-attribute pairs (oi,aij) . More specifically, for every object/class oi, all attributes/properties aij are retrieved via processing RDF/S triples of the form: <aij rdfs:domain oi>.
Step #2: Retrieving the relevant tweets
For every property aij of an object oi a relevant query is submitted to Twitter via the Twitter4J library described previously. The query has the form ‘‘oi aij’’, where different terms are separated by whitespaces, resulting in an intersection query. Alternatively, one could execute a hashtag intersection query, like e.g. ‘‘#oi #aij’’, which would nevertheless drastically reduce the result set, without necessarily increasing the precision.
A predefined number of tweets t1i, . . . , t1n is retrieved (default number is 100) that contain the relevant keywords. A secondary phase of preprocessing takes place on the retrieved set of tweets. The preprocessing phase involves removing characters or sequences of characters that cannot assist during the subsequent sentiment analysis phase, in order to reduce the noise in the data set. More specifically, for each retrieved tweet, the following items of text constitute representative examples to be removed:
1. Replies to other users’ tweets, represented by strings starting with ‘@’. 2. URLs (i.e. strings starting with ‘http://’).
ISSN(Online): 2319-8753 ISSN (Print): 2347-6710
I
nternational
J
ournal of
I
nnovative
R
esearch in
S
cience,
E
ngineering and
T
echnology
(A High Impact Factor, Monthly, Peer Reviewed Journal)
Visit: www.ijirset.com Vol. 7, Special Issue 2, March 2018
Step #3: Sentiment analysis
After going through the preprocessing phase during the previous step, the retrieved tweets are submitted to OpenDover for sentiment analysis. OpenDover5 is a web service that tags the opinions.
III. PROCESSING METHOD & ANALYSIS
3.1 Natural Language Processing (NLP)
NLP techniques are based on machine learning and especially statistical learning which uses a general learning algorithm combined with a large sample, a corpus, of data to learn the rules .Sentiment analysis has been handled as a Natural Language Processing denoted NLP, at many levels of granularity. Starting from being a document level classification task, it has been handled at the sentence level and more recently at the phrase level .NLP is a field in computer science which involves making computers derive meaning from human language and input as a way of interacting with the real world.
3.2 Support Vector Machine (SVM)
Support Vector Machine is to detect the sentiments of tweets .together with stated SVM is able to extract and analyze to obtain upto70%-81.3% of accuracy on the test set. Collected training data from three different twitter sentiment detection websites which mainly use some pre-built sentiment lexicons to label each tweet as positive or negative. Using SVM trained from these noisy labeled data, they obtained 81.3% in sentiment classification accuracy.
3.3 Defining Sentiment Analysis
Here we have defined Sentiment to be "a personal positive or negative feeling."Here are some examples: For tweets that were not clear-cut, we use the following litmus test: If the tweet could ever appear as a newspaper headline or as a sentence in Wikipedia, then it belongs in the neutral class. For
example, the following tweet would be marked as neutral because it is fact froma newspaper headline, even though it projects an overall negative feeling about the Tweet under consideration
Table-2: Sentimental Analysis Definition
Sentiment Query Tweet
positive Jquery dcostalis: Jquery is my new best friend. Neutral San Francisco schuyler: just
landed at San Francisco
Negative exam jvicious: History exam studying.
IV. DATA ACQUISITION - REPRESENTATION
4.1 Sentiment Analysis
Tweets from JSON file will be assigned the value of each word by matching with the lexicon dictionary. As a limitation of words in the lexicon dictionary which is not able to assign value to every single word from tweets. However, as scientific language of python, which is able to analyze a sense of each tweet into positive or negative for getting a result.
4.2 Information Presented
ISSN(Online): 2319-8753 ISSN (Print): 2347-6710
I
nternational
J
ournal of
I
nnovative
R
esearch in
S
cience,
E
ngineering and
T
echnology
(A High Impact Factor, Monthly, Peer Reviewed Journal)
Visit: www.ijirset.com Vol. 7, Special Issue 2, March 2018
hash tags. For null hash tag is representing the hash tags that were assigned zero value. However, this program is able to list a top ten positive and negative hash tags.
Fig-3: Pie Chart- Sentimental Analysis
ISSN(Online): 2319-8753 ISSN (Print): 2347-6710
I
nternational
J
ournal of
I
nnovative
R
esearch in
S
cience,
E
ngineering and
T
echnology
(A High Impact Factor, Monthly, Peer Reviewed Journal)
Visit: www.ijirset.com Vol. 7, Special Issue 2, March 2018
V. FEATURE EXTRACTORS
5.1. Unigram:
Building the unigram model took special care because the Twitter language model is very different from other domains from past research. The unigram feature extractor addressed the following issues:
a. Tweets contain very casual language. For example, you can search "hungry" with a random number of u's in the middle of the word on http://search.twitter.com to understand this. Here is an example sampling: huuuungry: 17 results in the last day huuuuuuungry:
4 results in the last day huuuuuuuuuungry: 1 result in the last day besides showing that people are hungry, this emphasizes the casual nature of Twitter and the disregard for correct spelling.
b. Usage of links. Users very often include links in their tweets. An equivalence class was created for all URLs. That is, a URL like "http://tinyurl.com/cvvg9a" was converted to the symbol "URL."
c. Usernames. Users often include usernames in their tweets, in order to address messages to particular users. A de facto standard is to include the @ symbol before the username (e.g. @alecmgo). An equivalence class was made for all words that started with the @ symbol. The query term affect the classification.
5.2. Bigrams
d. Removing the query term. Query terms were stripped out from Tweets, to avoid having the reason we experimented with bigrams was we wanted to smooth out instances like 'notgood' or 'not bad'. When negation as an explicit feature didn't help, we thought of experimenting with bigrams. However, they happened to be too sparse in the data and the overall accuracy dropped in the case of both NB and MaxEnt. Even collapsing the individual words to equivalence classes did not help. Bigrams however happened to be a very sparse feature which can be seen in the outputs with a lot of probabilities reported as 0.5:0.5.For context: @stellargirl I loooooooovvvvvveee my Kindle2. Not that the DX is cool, but the 2 is fantastic in its own right. Positive [0.5000] Negative [0.5000]
5.3. Negate as a features
Using the Stanford Classifier and the base SVM classifiers we observed that identifying NEGclass seemed to be tougher than the POS class, merely by looking at the precision, recall and F1 measures for these classes. This is why we decided to add NEGATE as a specific feature which is added when “not” or „n‟t” are observed in the dataset. However we only observed a increase in overall accuracy in the order of 2% in the Stanford Classifier and when used in conjunction with some of the other features, it brought the overall accuracy down and so we removed it. Overlapping features could get the NB accuracy down, so we were not very concerned about the drop with NB. However it didn't provide any drastic change with OpenNLP either.
5.4. Part of Speech (POS) features
We felt like POS tags would be a useful feature since how you made use of a particular word. For example, „over‟ as
a verb has a negative connotation whereas „over‟ as the noun, would refer to the cricket over which by itself doesn‟t
carry any negative or positive connotation. On the Stanford Classifier it did bring our accuracy up by almost 6%. The training required a few hours however and we observed that it only got the accuracy down in case of NB Handling the Neutral Class In the previous sections, neutral sentiment was disregarded. The training and test data only had text with positive and negative sentiments. In this section, we explore what happens when neutral sentiment is introduced.
5.5. Naive Bayes with Three Classes
ISSN(Online): 2319-8753 ISSN (Print): 2347-6710
I
nternational
J
ournal of
I
nnovative
R
esearch in
S
cience,
E
ngineering and
T
echnology
(A High Impact Factor, Monthly, Peer Reviewed Journal)
Visit: www.ijirset.com Vol. 7, Special Issue 2, March 2018
5.6. Subjective vs. Objective Classifier
Another way to handle the neutral class is to have a two phased approach: 1. Given a sentence, classify the sentence as objective or subjective.
2. If the sentence is subjective, classify it as positive or negative. We modified our Naive Bayes classifier to handle a subjective class and a objective class. Unfortunately,
The results were terrible again, with an accuracy of only 44.9%. Again, this is probably due to the noisy training data of the neutral class.
VI.CONCLUSION
Here we emphasize the usage of machine learning techniques to perform for classifying sentiment in tweets. We also demonstrated how you can use twitter4j for streaming. It also supports programmatic access to the actions that any Twitter user can take, including posting messages, retweeting, following, and more.
As the future work, we plan to improve the accuracy of classification for such negative emotions as sadness and fear by gathering and analyzing more training data from at least 5 more participants. For the improvement of overall classification performance, we will investigate new features associated with user behavior. In this work, we have demonstrated a system to extract knowledge from tweets and then classify tweets based on the semantics of knowledge contained in them. For avoiding information loss, knowledge enhancer is applied that enhances the knowledge extraction process from the collected tweets. The maturity of knowledge gained using knowledge enhancer module has helped to filter tweet more precisely avoiding information loss. We have also measured missing information during specific keyword-based search and then proposed a method to collect more precise information about specific topic or domain. Sentiment analysis shows people attitude towards different topics. This data can also help to generate richer user profile and generate valuable recommendations. In future we are planning to integrate the proposed system with personalized profile management, sentiment analysis, and recommender system.
REFERENCES
[1] D. M. Blei, A. Y. Ng, and M. I. Jordan, “Latent Dirichlet allocation,” J. Mach. Learn. Res., vol. 3, pp. 993–1022, Jan. 2003.
[2] T. Hofmann, “Probabilistic latent semantic analysis,” in Proc. 15th Conf. Uncertainty Artif. Intell., 1999, pp. 289–296.
[3] T. Hofmann, “Probabilistic latent semantic indexing,” in Proc. 22nd Annu. Int. ACM SIGIR Conf. Res. Develop. Inf. Retrieval, Berkeley, CA,
USA, 1999, pp. 50–57.
[4] C. Wartena and R. Brussee, “Topic detection by clustering keywords,” in Proc. 19th Int. Workshop Database Expert Syst. Appl. (DEXA), Turin,
Italy, 2008, pp. 54–58.
[5] Archetti, P. Campanelli, E. Fersini, and E. Messina, “A hierarchical document clustering environment based on the induced bisecting k-means,”
in Proc. 7th Int. Conf. Flexible Query Answering Syst., Milan, Italy, 2006, pp. 257–269. [Online].
Available:http://dx.doi.org/10.1007/11766254_22.
[6] C. D. Manning and H. Schütze, Foundations of Statistical Natural Language Processing. Cambridge, MA, USA: MIT Press, 1999.
[7] M. Cataldi, L. Di Caro, and C. Schifanella, “Emerging topic detection on Twitter based on temporal and social terms evaluation,” in Proc. 10th
Int. Workshop Multimedia Data Min. (MDMKDD),Washington, DC, USA, 2010, Art. no. 4. [Online].
Available:http://doi.acm.org/10.1145/1814245.1814249.
[8] W. X. Zhao et al., “Comparing Twitter and traditional media using topic models,” in Advances in Information Retrieval. Heidelberg, Germany:
Springer Berlin Heidelberg, 2011, pp. 338–349.
[9] Q. Diao, J. Jiang, F. Zhu, and E.-P. Lim, “Finding bursty topics from microblogs,” in Proc. 50th Annu. Meeting Assoc. Comput. Linguist. Long