ISSN(Online): 2320-9801
ISSN (Print) : 2320-9798
I
nternational
J
ournal of
I
nnovative
R
esearch in
C
omputer
and
C
ommunication
E
ngineering
(An ISO 3297: 2007 Certified Organization)
Vol. 3, Issue 9, September 2015
A Comparative Study of Three Algorithms for
Efficient Audio Classification
Jayita Mitra 1 , Diganta Saha 2
PhD Student, Dept. of CSE, Jadavpur University, Kolkata, India1
Associate Professor, Dept. of CSE, Jadavpur University, Kolkata, India2
ABSTRACT:In this paper, we present a comparative study, on three different efficient feature selection method in classification of audio files. The main objective is feature selection and extraction. We have selected a set of features for further analysis, which represents the elements in feature vector. By extraction method we can compute a numerical representation that can be used to characterize the audio using the existing toolbox application. In this study Gain Ratio (GR) is used as a feature selection measure. GR has an important role in selection of splitting attribute which will separate the tuples into different classes. The pulse clarity is considered as a subjective measure and it is used to calculate the gain of features of audio files. The splitting criterion is employed in the application to identify the class or music genre of a specific audio file from testing database. Experimental results indicate that, by using GR the application can produce a satisfactory result for music genre classification. After dimensionality reduction best three features have been selected out of various features of audio file and in this technique we get more than 90% successful classification result. Principal Component Analysis is used mainly for dimensionality reduction and classify the western music database. The encouraging experimental result shows 86.4% successful classification rate using the PCA approach, which indicates a novel way for audio classification. Experimental results In many real world applications such as face recognition and mobile robotics, we need to use an adaptive version of feature extraction technique. Here, we introduce an adaptive weighted version based on PCA algorithm. Experimental results on western music database demonstrated the effectiveness of the proposed system in audio classification application. The Adaptively Weighted PCA algorithm discussed here mainly for audio classification which differs from the image based classification approaches. Here it is used it to check the efficiency and the performance of classification result of 90.9% using Adaptively Weighted PCA. Through experiments, it is found that, all three algorithms can find a feasible solution efficiently. But from the data analysis and experimental results, our approach shows a better performance than principal component analysis and AWPCA.
KEYWORDS:Data Mining; Feature Extraction; Audio Classification; Gain Ratio; Pulse Clarity; PCA
I. INTRODUCTION
Feature selection is the process of selecting a subset of relevant features by dimensionality reduction and selected features is further used in classifier model construction. This technique is often used in domains where there are many features and comparatively few data points. The basic objectives of this technique are to avoid overfitting, provide faster and cost-effective models and improvement of model performance and efficiency. Feature extraction is a special form of dimensionality reduction, in which extracted features are selected such a manner that the feature set will extract relevant information from large data set to achieve the goal using reduced data set.
Several algorithms have been used for extracting various key features for audio classification. Due to possible challenges of capturing various sounds and audio signal, recording audio and songs in different noise level, low volume, bad sound quality and environmental disturbances, audio analysis and classification are still remaining as a difficult issue that needs to be resolved. In this paper, we propose an approach to tackle some of these issues by analyzing the features to improve the efficiency of the classification.
ISSN(Online): 2320-9801
ISSN (Print) : 2320-9798
I
nternational
J
ournal of
I
nnovative
R
esearch in
C
omputer
and
C
ommunication
E
ngineering
(An ISO 3297: 2007 Certified Organization)
Vol. 3, Issue 9, September 2015
indicates the splitting attribute and may also indicate a split-point or a splitting subset. More specifically, it selects an attribute by determining the best way to separate or partition the tuples into individual classes.
Data mining is the process of analyzing the data and discovering previously unknown pattern from large dataset. The data sources can be any databases, the web, data warehouses, transactional data, data streams, spatial data, and information repositories, etc. The aim of this process is to extract information and summarizing it into an understandable structure for further use. Data mining functionalities include discovering frequent patterns, associations, and correlations; classification and regression; and clustering analysis are found in [1].
Classification is the task of generalizing known structure to apply to the new dataset. Data classification is a two-step process learning or training phase and classification two-step. In learning phase a classification model is constructed which describes a predetermined set of data classes or concepts. In case of classification the test data are used to estimate the accuracy of the classification rules. The accuracy of a classifier on a test data set is the percentage of the test data set tuples that are correctly classified by the classifier.
Principal Component Analysis is mainly used for dimensionality reduction and classification which mainly highlights the similarities and differences of a large set of data. It can be also applied for data compression, because after the reduction of dimensions the loss of information is less [2]. It was first time introduced in 1901 by Karl Pearson [3]. It can be done by eigenvalue decomposition of a covariance matrix of a set of data. The first principal component has the largest variance, and the variances of the other components are reduced in turn. Also, every component is orthogonal to the preceding components [4]. With the help of PCA, large dimensional data can be reduced to fewer dimensions without losing much information, thus increasing the efficiency of the whole system.
The paper is organized as follows: Section II gives a brief review of various related algorithms and literature survey. Section III includes system design and module description. Section IV mainly focused on Feature Selection and Gain Ratio. We briefly discuss data analysis and experimental result in Section V. Section VI illustrates the experimental results using Principal Component Analysis for audio classification. The adaptively weighted principal component analysis for audio classification of the western music database is discussed in Section VII. Finally, we conclude the paper in the last section.
II. LITERATURE SURVEY AND RELATED WORK
Most of the previous studies on data mining applications in various fields use the variety of data types, i.e., text, image audio and video in a variety of databases. Different methods of data mining are used to extract the hidden patterns and knowledge. For this purpose knowledge of the domain is very necessary.
ISSN(Online): 2320-9801
ISSN (Print) : 2320-9798
I
nternational
J
ournal of
I
nnovative
R
esearch in
C
omputer
and
C
ommunication
E
ngineering
(An ISO 3297: 2007 Certified Organization)
Vol. 3, Issue 9, September 2015
for effective feature subset selection, which builds upon known strengths of the tree ensembles from large, dirty, and complex data sets (in 2009). Research work [15] to evaluate feature selection algorithms for financial credit-risk evaluation decisions and the selected features are used to develop a predictive model for financial credit-risk classification using a neural network (in 2010). S. Maldonado et al. [16] presented an embedded method that simultaneously selects relevant features during classifier construction by penalizing each feature’s use in the dual formulation of SVM (in 2011). Unifying framework mentioned in [17] for feature selection based on dependence maximization between the selected features and the labels of an estimation problem, using the Hilbert-Schmidt Independence Criterion proposed in 2012. In 2013, Mauricio Schiezaro and Helio Pedrini introduces feature selection method based on the Artificial Bee Colony approach [18], that can be used in several knowledge domains through the wrapper and forward strategies and the method has been widely used for solving optimization problems. PCA algorithm is used here to find a sub-space whose basis vectors correspond to the maximum-variance direction in the original space. This can be achieved by computing the eigenvectors of the covariance matrix. Principal component analysis[19] and linear discriminant analysis[20] are two main techniques used for data reduction and feature extraction in the appearance based approaches. LDA algorithm selects features that are most effective for class separability while PCA selects features important for class representation. An adaptive formulation of RPCA described in [21], which includes music content information for further decomposition. The algorithm is able to process a complete track of the music piece of various genres that may exhibit large variations in the music content. Background segments are better discriminated and the singing voice is better estimated into vocal segments using this algorithm. [22] introduces a new adaptive version of normalized PCA (AMPCA). It constructs an online face recognition system which is trained with a sequence of input images. Simulation results on YALE face database shows the effectiveness of this algorithm. On the other side, the PCA method can’t only effectively reduce the dimension of human face images, but also retains its key identifying information [23]. Modular PCA algorithm extracts weighted average for every sub-block of training sample. The experiment on ORL face database shows that this method is superior to the traditional PCA method. Experiments were conducted generally on various face databases covering face recognition under controlled or ideal conditions and different illumination conditions. The extensive experimental investigation also performed on different facial expression of human. Several gray scale images (8 bit per pixel representation) have been used for tests of the adaptive version of PCA algorithm. In face recognition approach, the adaptively weighted PCA operates directly on the sub patterns partitioned from an original image and separately extracts a corresponding local sub-features from them.
The system mainly focuses on different parts of the human face. Real time face recognition using PCA is performed on
single scaled images without rotation. Face location and normalization were performed in real-time and consistent accuracy in face detection is recorded with video input. The process is performed in a constrained environment. Basically, most of the research works based on PCA or adaptively weighted PCA analysis, the algorithms are evaluated on binary, gray scale and color images. The nature of the data in most of the work is based on human faces and expressions.
The need for dimensionality reduction, in real time applications motivated researchers to introduce adaptive versions of PCA. In this paper, we describe an adaptive version of principal component analysis in detail and called it adaptively weighted PCA (AWPCA). The current open issues of data mining are based on (a) development of unifying theory, (b) information network analysis, (c) process-related, biological and environmental problems, and (d) dealing with complex, non-static, unbalanced, high dimensional and cost-sensitive data. Handling of historical and real-time data simultaneously is very difficult for analytics system found in [24]. Representation of large data set and space required for storing the data these two are very important factors. In case of compression less space is required but there is no loss of information. The 2012 IDC study on Big Data [25] mentioned that in 2012, 23% of the digital universe would be useful for Big Data if tagged and analyzed. But at present only 3% of the potentially useful data is tagged, and even less is analyzed.
III.SYSTEM DESIGN
ISSN(Online): 2320-9801
ISSN (Print) : 2320-9798
I
nternational
J
ournal of
I
nnovative
R
esearch in
C
omputer
and
C
ommunication
E
ngineering
(An ISO 3297: 2007 Certified Organization)
Vol. 3, Issue 9, September 2015
respect to pulse clarity to identify the splitting attribute. Three splitting attributes with maximum gain ratio is already selected and then in sixth phase, a threshold value of each feature is calculated. The next phase describes a classification of audio files from testing database. In the last step we concentrate on result analysis and calculation of successful classification and rate of error.
Fig1. System Design
IV.FEATURE SELECTION AND GAIN RATIO
In this paper data mining techniques can be used to discover relevant similarities between music for the purpose of classifying it in a more objective manner. The backbone of most music information retrieval systems is the features extracted from audio file. The effectiveness of this recording is dependent on the ability to classify and retrieve the audio files in terms of their sound properties. Audio files basically of three types, i.e. speech, music and background sound. Male and female speech files are available in .wav file format. Music files are classified into two categories - classical and non-classical. According to genre of the track the classical music is subdivided into the chamber and orchestral. Rock, Pop, Jazz and Blues are various genres of non-classical music. Rock and Pop music is sub classified to hard rock, soft rock, techno and hip-hop music. In order to obtain high accuracy for classification and segmentation, it is very important to select good features of audio files. Selected features of an audio file are sampling rate (in Hz.), temporal length (seconds/sample), rms energy, low energy, tempo (in bpm), pulse clarity, zero crossing rate (per second), roll off (in Hz.), Spectral irregularity, Pitch (in Hz.) and inharmonicity.
Information Gain and Gain Ratio are used in this work as attribute selection measures. Node N holds the tuples of partition D. The expected information needed to classify a tuple in D is as follows:
m
Info(D) = - ∑Pi log2(Pi) i=1
ISSN(Online): 2320-9801
ISSN (Print) : 2320-9798
I
nternational
J
ournal of
I
nnovative
R
esearch in
C
omputer
and
C
ommunication
E
ngineering
(An ISO 3297: 2007 Certified Organization)
Vol. 3, Issue 9, September 2015
v partitions {D1, D2, …… Dv}, where Dj contains those tuples in D that have outcome aj of A. The expected information required to classify is,
v
InfoA(D) = ∑ |Dj|/|D| × Info(Dj) j=1
Where |Dj|/|D| = weight of jth partition. The Information Gain is,
Gain(A) = Info(D) - InfoA(D). By splitting the training data set D into v partitions on attribute A Splitting Information is calculated as follows:
v
SplitInfoA(D) = - ∑ |Dj|/|D| × log2 (|Dj|/|D|) j=1
and the Gain Ratio is, GainRatio(A) = Gain(A)/SplitInfoA(D).
V. DATA ANALYSIS AND EXPERIMENTAL EVALUATION
The audio files of training database are already classified and the numerical values of each feature of a specific audio file are extracted using MIRToolBox, which is a Matlab toolbox dedicated to the extraction of musically related features from audio recordings. It has been designed in particular with the objective of enabling the computation of a large range of features from databases of audio files, which can be applied to statistical analyses described in [26]. MIRToolBox application is used with MATLAB 2012 to compute the numerical values of selected features. The files of testing database are processed and input to the application to identify the music genre of that specific audio file. Before the algorithms are presented, the effects of the training and testing data should be pointed out. Training data uses a proper algorithm to let the system learn from a set of training data, then applying the rule to the testing data for further processing.
Non-Classified Audio File Database
Total 52 .wav files are collected for creating non-classified Database and extracted numerical values are stored in a dataset. The data values are plotted and analyzed in a waveform and linear values are identified. Temporal Length of non-classified audio files are represented in figure Fig2. Then the data values are subdivided into three groups- high, medium and low on the basis of their range of values. Pulse clarity is considered as a high-level musical dimension that conveys how easily in a given musical piece, listeners can perceive the underlying rhythmic or metrical pulsation. This Characterization of music plays an important role in musical genre recognition described in [27] which allows discrimination between genres, but that differ in the degree of emergence of the main pulsation over the rhythmic texture. The notion of pulse clarity is considered in this study as a subjective measure and it is used to calculate the gain of features of all audio files.
Fig2. Temporal Length
TableI. Gain_Ratio of Non-Classified Audio Files
Feature Gain Gain Ratio
Sampling Rate .2923 .164
Temporal Length .0048 .00687
RMS Energy .0412 .0513
Low Energy .0214 .0198
Tempo .1022 .1228
Zero Crossing Rate .1562 .0996
Roll Off .3037 .2428
Spectral Irregularity .1392 .0981
Pitch .0412 .0262
ISSN(Online): 2320-9801
ISSN (Print) : 2320-9798
I
nternational
J
ournal of
I
nnovative
R
esearch in
C
omputer
and
C
ommunication
E
ngineering
(An ISO 3297: 2007 Certified Organization)
Vol. 3, Issue 9, September 2015
The TableI represents gain ratio of each feature is calculated for audio file analysis in respect to the feature pulse clarity. The Roll Off feature with the maximum gain ratio is selected as the splitting attribute in case of non-classified audio files.
Classified Audio File Database
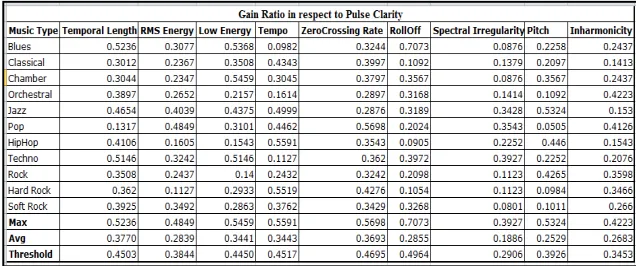
The Classified Database is consisting of 110 audio files in which 10 .mp3 files for each class are collected and the files are converted into .wav format for processing. The sampling rate of all files is fixed to 44100 Hz. From the graph layout, we can get the minimum and maximum range of a specific feature for a particular music class. Figure Fig3 shows the data ranges of various features. Based on different ranges the data sets are divided into three groups – low, medium and high. After that, information gain and gain ratio are calculated in respect to pulse clarity of each feature corresponding to a particular music class. Maximum and average values of gain ratio are calculated as MaxGain and AvgGain respectively for individual feature. Then threshold value is calculated from the average value of MaxGain and AvgGain.
Fig3. Feature_DataRange
Figure Fig4. Shows that, Roll off, Zero Crossing rate and Tempo have a maximum threshold value and these three features are selected as the main criterion to classify an audio file. We’ve developed an application in PHP to implement the different functionalities i.e., feature extraction and classification and the training and testing databases are created using MySQL. At first, an audio file from testing database is entered into the application for feature extraction and the numerical values of each feature of the audio file are displayed. From this data value system can identify the class of that music file.For classification phase, the values of Roll of, Zero Crossing rate and Tempo are fixed to threshold value which is already calculated and selected as the basic criterion of classification. The threshold value of each feature is, ThresholdFi = [{(MaxFi + AvgFi)/2}+ {(MaxFi - AvgFi)/4}]
ISSN(Online): 2320-9801
ISSN (Print) : 2320-9798
I
nternational
J
ournal of
I
nnovative
R
esearch in
C
omputer
and
C
ommunication
E
ngineering
(An ISO 3297: 2007 Certified Organization)
Vol. 3, Issue 9, September 2015
During the classification phase of an audio file (from testing database) the system compares the values with threshold values. If the values are less than or equal to the threshold value, then it is successfully classified and music class is identified. Out of 110 music files, 9 files are not classified as the value exceeds the threshold limit. Figure Fig5. represents the classification result on testing database. All test music files of classes Blues, Classical, Chamber and Soft rock are classified successfully and no error occurs. For improvement of efficiency of classification and to get the optimal solution threshold value plays an important role. 91.82% files of testing database are correctly classified and the error rate of unsuccessful classification is 8.18%.
Fig5. Classification Result
VI.PRINCIPAL COMPONENT ANALYSIS
Now we use another technique, i.e., principal component analysis for a comparative study to reduce the dimensionality of the data set and identify new meaningful underlying variables. In this section, principal component analysis is presented, and a weighting strategy is proposed for dimensionality reduction. It is basically selected for variable reduction in less processing time in the audio classification system. In PCA, the number of principal components is less than or equal to the variables being considered. The first component has the largest possible variance. Eigenvalues represent the amount of variance that is accounted by a given component [28]. By using the meaningful components, which related eigenvalues are larger, mainly used to get a better result in classification. A larger eigenvalue means a bigger variability of the related principal component. Choosing the components, whose eigenvalues belong to the K largest eigenvalues, will make sense. The following equation shows the strategy of deciding the value of K:
where A is the total number of eigenvalues. The proper eigenvalues are chosen when the percentage is larger than a
predefined threshold which is typically 90% or more. Then, the processed data are combined with the matrix which contains the chosen eigenvectors. The final output values are prepared for classification.
Here we have used Tanagra data mining software for PCA analysis. In this paper, we use Kaiser-Meyer-Olkin (KMO) index indicator to check if we can factorize efficiently the original variables. KMO index is used to compare the magnitudes of the observed correlation coefficients in relation to the magnitudes of the partial correlation coefficients.
Fig6. MSA
ISSN(Online): 2320-9801
ISSN (Print) : 2320-9798
I
nternational
J
ournal of
I
nnovative
R
esearch in
C
omputer
and
C
ommunication
E
ngineering
(An ISO 3297: 2007 Certified Organization)
Vol. 3, Issue 9, September 2015
VII. ADAPTIVELYWEIGHTEDPRINCIPALCOMPONENTANALYSIS(AWPCA)
The feature vector is obtained from a sampled audio file which includes feature values of all the partitions of the audio, and the dimensionality of the audio is reduced by principal component analysis performed on it. The feature weightage of each partition of an audio is determined by employing the mean estimate of the respective feature which represents the significance of the partition. An Adaptively Weighted PCA algorithm is used here to compare the effectiveness of the classification result which is conducted on western music of different genre. In audio classification, range of values for multiple features of an audio file varies so much that is why the weights will be different. And weights, play a vital role in the selection of key attributes. Attribute selection is the most important factor for getting better classification result. In this algorithm, an audio file can be partitioned into a set of equal length sub-audios, depending on user options, while all partitions in this algorithm are of equal length or time duration due to the inherent limitation. In this paper without loss of generality, we still adopt equally-sized partitions for an audio file. The detailed description of this algorithm for audio classification is given in the following section.
Step 1:
Initially the audio file (.mp3 format) is converted to the .wav file format for extraction of the feature values of the song. All (.wav) files are sampled in constant sampling rate 44100 Hz.
Step 2:
Assume that, X1 = song1.mp3
Xi is a feature vector where i = 1, 2, 3, ….. , n
As 110 files are present in the audio database so the value of n = 110.
X1 = [F1, F2 , F3 , F4 , F5 , F6 , F7 , F8 , F9 , F10]
F1, F2 , ….. , Fm are the values of each feature. Here, m=10 because the total number of features of an audio file is 10. F-1, F2 , ….. , Fm of feature vector denotes the values of corresponding features i.e, Temporal Length, RMS Energy, Low Energy, Tempo, Pulse Clarity, Zero Crossing Rate, Rolloff, Spectral Irregularity, Pitch and Inharmonicity.
Step 3:
If the total length of the file X1.wav is z second. The file is divided into three equal size partitions i.e, P1 , P2 , P3. The length of each partition is z/3 second.
P1 (z/3 s) X1 (z s) P2 (z/3 s) P3 (z/3 s)
Step 4:
P1 of X1 X1P1 = [F P10 , F P11 , F P12 , F P13 , F P14 , F P15 , F P16 , F P17 , F P18 , F P19 ] P2 of X1 X1P2 = [F P20 , F P21 , F P22 , F P23 , F P24 , F P25 , F P26 , F P27 , F P28 , F P29 ] P3 of X1 X1P3 = [F P30 , F P31 , F P32 , F P33 , F P34 , F P35 , F P36 , F P37 , F P38 , F P39 ]
The mean value of three partitions of the audio file is considered as the weight or value of the feature vector. Assign the new weight individually for feature vector for all audio files.
Xi = [M i0, M i1 , M i2 , M i3 , M i4 , M i5 , M i6 , M i7, M i8 , M i9] Here i denotes the total number of audio files i.e, 1, 2, 3, ….n After assignment of weight to the file, the new feature vector will be X1 = [M 10 , M 11 , M 12 , M 13 , M 14 , M 15 , M 16 , M 17 , M 18 , M 19] X2 = [M 20 , M 21 , M 22, M 23 , M 24 , M 25 , M 26 , M 27 , M 28 , M 29 ] X3 = [M 30 , M 31 , . . . , M 39] . . .
ISSN(Online): 2320-9801
ISSN (Print) : 2320-9798
I
nternational
J
ournal of
I
nnovative
R
esearch in
C
omputer
and
C
ommunication
E
ngineering
(An ISO 3297: 2007 Certified Organization)
Vol. 3, Issue 9, September 2015
Step 5:
Principal Component Analysis is used to reduce the dimensionality and select important features or attributes from the new dataset for classification of the audio files.
Initially, each audio file is partitioned into three equal length individual partitions. All the partitions are sampled at a fixed rate of 44100 Hz. Then the numerical values of all features are extracted using MIRToolBox application. The mean value of three partitions of an audio file is considered as the new weight of the feature vector. Figure Fig 7. represents the extracted values of all partitions. It also includes the mean of three partitions of a file for each feature individually. The mean value is assigned as the new weight of a specific feature of an audio file and new feature vector is calculated for the further analysis.
Fig 7. Database of Adaptively weighted PCA
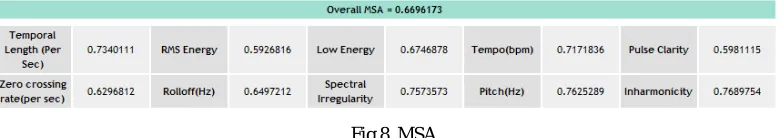
Here we apply principal component analysis to reduce the dimensionality of the dataset. Because identification of the selected features from the data set is very important for the next phase of classification. Tanagra is used here for PCA analysis where Kaiser-Meyer-Olkin (KMO) index indicator is used to verify if it can factorize efficiently the original variables. Our main aim is to compare the magnitudes of the observed correlation coefficients in relation to the magnitudes of the partial correlation coefficients.
Fig 8. MSA
ISSN(Online): 2320-9801
ISSN (Print) : 2320-9798
I
nternational
J
ournal of
I
nnovative
R
esearch in
C
omputer
and
C
ommunication
E
ngineering
(An ISO 3297: 2007 Certified Organization)
Vol. 3, Issue 9, September 2015
TableII. Classification Result of AWPCA
SUMMARY
It can be seen from Fig 5 that on western music database, our approach achieves approximately 92% accuracy rate, which is very promising and higher than the performance over AWPCA, up to 6% improvement over Principal Component Analysis. Moreover, it also shows that the performance of proposed AWPCA is competitive and really challenging. Although performances of our approach is quite impressive, so we can say that not only does it get the first place in the performance contest, but also this method exhibits stability and high robustness on a western music database of different genres. So, our approach is effective with respect to music genre classification accuracy in [29]. A music file is 10 dimensional, among them top 3 features have been selected which are used for classification. The performance of classification based on our approach is better in comparison to other two algorithms. But it can be further improved in the future on the basis of performance of the system. By this method we found a high success rate, so, we try to minimize the effect in classification which may be negligible.
VIII. CONCLUSION AND FUTURE WORK
With the results from the three different algorithms, the performance of our approach shows its effectiveness. In this paper, we basically compare and analyze the efficiency and success rate of three different algorithms for audio classification of western music. Even though the proposed AWPCA method may not obtain the best accuracy in comparison to our approach, but the efficiency is higher. This method yields over 90% accuracy which can’t be ignored and it shows the capability of the proposed approach. The variations of western music and noises are main two challenges for obtaining high accuracy of classification in the western music audio database. The classification result of the western music audio database is very encouraging. For obtaining a better performance, some pre-processing techniques can be used to reduce the noise and more testing experiments should be done on a large set of music files of various genres, for improvement of the result. The audio classification requires more detailing on frequency and pitch. Sound quality also an important factor specially voice and musical instruments. Voice of singers may be appearing differently under a variety of expressions and music genres.
On the other hand our approach includes the method to consistently and precisely identify the features that take part in the classification of an audio file. We have described in the feature selection scheme that uses Gain Ratio to select splitting attribute for classification into various music genres. This research work presented here is based on feature selection, extraction, analysis of data, feature selection using gain ratio and finally a classification stage using splitting criterion. For calculation of gain ratio we have included Pulse Clarity feature which has high discrimination power among different features and it ensures that the system can achieve high accuracy. The audio files belonging to any particular music genre share a similarity in a range of values of their features and hence make it possible to discover the pattern and then classify the audio file accordingly. This work emphasizes both the theoretical concept as well as gives insight into the practical application program. Experimental results showed that the scheme is very effective and the total accuracy rate is 92%, which is greater than the percentage of successful classification using PCA and AWPCA analysis. There are many interesting directions that can be explored in the future. To achieve this, we need to concentrate on the selection of more audio features that can be used to characterize the audio content. In the future, our audio classification scheme will be improved to discriminate more audio classes, speeches, background music or any other sound. We will also focus on developing an effective scheme to apply data mining techniques to improve the efficiency of the classification process. The future scope of the work is to improve the quality of the audio file by improving the quality of sound by reducing the noise.
Adaptively Weighted PCA
Total Successful (90.91%)
Unsuccessful (9.09%)
Blues Classical Chamber Jazz Pop Rock Hard Rock
ISSN(Online): 2320-9801
ISSN (Print) : 2320-9798
I
nternational
J
ournal of
I
nnovative
R
esearch in
C
omputer
and
C
ommunication
E
ngineering
(An ISO 3297: 2007 Certified Organization)
Vol. 3, Issue 9, September 2015
REFERENCES
[1] J. Han, M. Kamber and J. Pei.,“Data Mining Concepts and Techniques”,Morgan Kaufmann Publishers In, 3rd Revised edition, pp. 340, 2011.
[2] Lindsay I. Smith,“A Tutorial on Principal Components Analysis[Online]”, Available
http://www.ce.yildiz.edu.tr/personal/songul/file/1097/principal_components.pdf.
[3] K. Pearson,“On Lines and Planes of Closest Fit to Systems of Points in Space", Philosophical Magazine,Vol.2, pp.559-572, 1901. [4] Principal Component Analysis [Online]. Available http://www.fon.hum.uva. nl/praat/manual/Principal_component_analysis.html.
[5] I. Guyon and A. Elisseeff.,“An Introduction to Variable and Feature Selection”, Journal of Machine Learning Research 3,pp.1157-1182,2003. [6] N. Padhy, Dr. P. Mishra , and R. Panigrahi.,“The survey of data mining applications and feature scope”, International Journal of Computer Science, Engineering and Information Technology (IJCSEIT), Vol.2, No.3, June 2012.
[7] L. Yu and H. Liu., “Efficient feature selection via analysis of relevance and redundancy”, Journal of Machine Learning Research 5 ,pp.1205-1224,2004.
[8] G. Forman.,“An extensive empirical study of feature selection metrics for text classification”, Journal of Machine Learning Research 3, pp.1289-1305,2003.
[9] G. Guo and Stan Z. Li.,“Content-Based Audio Classification and Retrieval by Support Vector Machines”, IEEE Transactions Neural Networks, Vol. 14, No. 1,pp.209,January 2003.
[10] Lie Lu, Hong-Jiang Zhang, Stan Z. Li.,“Content-based audio classification and segmentation by using support vector machines”, Multimedia Systems 8,pp.482–492, Multimedia Systems,2003.
[11] S. Pfeiffer, S. Fischer, and W.Effelsberg,“Automatic audio content analysis”, in Proc. 4th ACM Int. Conf. Multimedia, pp.21–30,1996. [12] J. Saunders,“Real-time discrimination of broadcast speech/music”, in Proc. ICASSP’96, Vol.II, Atlanta, GA,pp.993–996,May 1996.
[13] E. Scheirer and M. Slaney, “Construction and evaluation of a robust multifeature music/speech discriminator”,inProc. ICASSP’ 97,Vol.II, pp.1331–1334,April 1997.
[14] E.Tuv, A. Borisov, G. Runger and K. Torkkola,“Feature Selection with Ensembles, Artificial Variables, and Redundancy Elimination”, Journal of Machine Learning Research 10,pp.1341-1366,2009.
[15] Raghavendra B. K. , Dr. Jay B. Simha,“Evaluation of Feature Selection Methods for Predictive Modeling Using Neural Networks in Credits Scoring”, Int. J. Advanced Networking and Applications,Vol.02,Issue 03,pp.714-718,2010.
[16] S. Maldonado, R. Weber and J. Basak.,“Simultaneous feature selection and classification using kernel-penalized support vector machine”, Information Sciences 181,pp.115–128,2011.
[17] Le Song, A. Smola, A Gretton, J. Bedo and K. Borgwardt.,“Feature Selection via Dependence Maximization”,Journal of Machine Learning Research 13,pp.1393-1434,2012.
[18] M. Schiezaro and H. Pedrini.,“Data feature selection based on Artificial Bee Colony algorithm”,EURASIP Journal on Image and Video Processing 2013,1687-5281-2013-47.
[19] M. Turk and A. Pentland, “Eigenfaces for recognition”,Journal Cognitive Nero-science, 3(1), 1991.
[20] D.L. Swets and J.J. Weng, “Using Discriminant Eigenfeatures for image retrieval”,IEEE Trans. Pattern Anal. Machine Intell,Vol.18, pp.831-836,1996.
[21] H.Papadopoulos and Daniel P.W. Ellis.,“Music-Content-Adaptive Robust Principal Component analysis for a Semantically Consistent Separation of Foreground and background in Music Audio Signals”, Proc. of the 17th Int. Conference on Digital Audio Effects (DAFx-14), Erlangen, Germany, September 1-5,2014.
[22] Y.A.Ghassabeh, H.A.Moghaddam and M.Teshnehlab.,“Adaptive Modified PCA for Face Recognition”, MVA2007 IAPR Conference on Machine Vision Applications, May 16-18, 2007, Tokyo, JAPAN.
[23] C. Han,“Modular PCA Face Recognition Based on Weighted Average.”,Modern Applied Science,Vol.3,No.11,2009. [24] W. Fan and A. Bifet.,“Mining Big Data: Current Status, and Forecast to the Future.”,SIGKDD Explorations,Vol.14, Issue.2.
[25] J. Gantz and D. Reinsel.,“IDC: The Digital Universe in 2020: Big Data, Bigger Digital Shadows, and Biggest Growth in the Far East.”, December 2012.
[26] O. Lartillot and P. Toiviainen.,“A MATLAB TOOLBOX for Musical Feature Extraction from Audio”, In proceeding of the 10th International Conference on Digital Audio Effects (DAFx-07), Bordeaux, France, September 10-15, 2007.
[27] Lartillot, O., T. Eerola, P. Toiviainen and J. Fornari.,“Multi-feature modeling of pulse clarity: Design, Validation and Optimisation.”,Proceeding of the 11th International Conference on Digital Audio Effects (DAFx-08), Espoo, Finland, September 1-4, 2008.
[28]Principal Component Analysis[Online]. Available http://support.sas.com/ publishing/pubcat/chaps/55129.pdf. [29] C. McKay and I. Fujinaga.,“Automatic genre classification using large high-level musical feature sets”, ISMIR, 2004.
BIOGRAPHY
Jayita Mitra is presently pursuing her research in Data Mining from Computer Science and Engineering Department, Jadavpur University. She has 4.5 Years of academic experience. She received M-Tech degree in 2011 from Jadavpur University, Kolkata.