Master Curve da/dt vs C* for Creep and Creep-Fatigue Crack Growth on CT Specimens
L. Laiarinandrasana.r., R. Piques.r., R. Kabiri.r., B.Drubay**CEA Saclay 91191 Gif-sur-Yvette Cedex FRANCE .r.Centre des Mat6riaux- Ecole des Mines de Paris UMR 7633, BP 87, 91003 Evry Cedex FRANCE e-mail : Lucien.Laiarinandrasana@mat.ensmp.fr
ABSTRACT
During high temperature service, engineering components are subjected to complex loading history including creep and creep-fatigue conditions. Fracture mechanics concepts are widely used in defect assessment procedures like A16 guide in France or R5 rule in Great Britain. In order to describe crack growth, these methods apply correlations between the creep crack growth rate da/dt against the fracture mechanics load parameter C*. Some procedures are proposed to yield this master curve C* versus da/dt on laboratory tests especially with CT specimens.
The creep crack growth rate is obtained experimentally by the potential drop technique. C* is calculated from the load-
line displacement rate dfi~×p/dt = ~ exp. This latter value is recorded during experimental tests but it involves •
- a part due to the creep behavior : ~ c (subscript C stands for Creep behavior)
- a part due to the structure response related to the crack growth : ~ s (subscript S denotes Structural term)
In the literature various approaches suggest to calculate C* with 8 c =~ ~xp - ~ s. But the ~ s (non time-dependent component) evaluation differs from one approach to another.
The paper aims at applying the methodologies reported in the literature to CT experimental data. A discussion about the relevance of each methodology is proposed. Furthermore, some recommendations are suggested concerning the construction of the da/dt versus C* master curve on CT specimens. Finally, the use of the master curve for other specimens subjected to creep-fatigue loading is commented.
I N T R O D U C T I O N
Engineers use increasingly the Fracture Mechanics for Creeping Solids (FMCS) concepts in order to design components. Predicting the residual life of an engineering structure is a task which involves particularly this research domain. For components subjected to thermo-mechanical loading, creep and creep-fatigue phenomena are addressed. This concept is the main motivation of this paper.
316L(N) stainless steels have been widely studied for nuclear components design. For pure creep loading, it has been reported [1, 2] that the incubation time takes a major part (60%) of the lifetime of a specimen made of 316L(N). Therefore, it was [1] suggested to design these components by calculating the initiation time. When fatigue loading is added in order to obtain creep-fatigue conditions which are probably the more realistic loading for engineering structures, it tunas out that no incubation time is observed. Nevertheless, the crack surface morphology looks like for pure creep specimen. Both of these aspects led the authors to conclude that the crock growth under creep-fatigue loading is mainly driven by pure creep like mechanisms (intergranular damage), but as no incubation time occurs, the crack growth rate has to be addressed also. In the literature, numerous papers refer to a master curve displaying the creep-crack growth versus the C* parameter. The determination of this master curve is ruled by the ASTM E1457-98 standard [3].
The first part of the paper gives the main concepts of the ASTM E1457-98 procedure, detailing its limits. The database is then presented, consisting of 24 CT specimens made of both 1Cr-lMo-0.25V ferritic steel and 316L(N) austenitic stainless steel. Since the C* parameter is calculated with the constitutive part of the load-line displacement rate, the relevance of both methodologies aiming at eliminating the structural part of the load-line displacement is discussed. Then, both lower and upper limits are suggested before applying the appropriate procedure allowing to produce the da/dt versus C* curve. For each
prescribed material, the A and q coefficients (d = AC *q correlation) are given. Finally, the use of the master curve for creep- fatigue loading conditions is briefly addressed.
T H E A S T M E 1 4 5 7 - 9 8 P R O C E D U R E
The scope of the ASTM 1457-98 procedure is summarized as follows : "this test method covers the determination of creep crack growth rates in metals at elevated temperature using compact type specimens subjected to static loading
SMiRT 16, Washington DC, August 2001 Paper # 1299
conditions. The time rate of crack growth, fi(t) or da/dt is expressed in terms of the magnitude of a crack tip parameter, C*(t)". The C* parameter is calculated by using the following formtda •
C* = I2 +0.522(1- ~ ) 1 n2 FSc
n 2 + 1 Bne t ( W - a ) (1)
where •
- a the crack depth
- W is the width of the specimen
- n2 is the creep exponent in the relationship between minimum creep rate and applied stress
= B2 Un2 (2)
- F is the applied load
- Bnet is the net thickness for side grooved specimens
" g c is the creep rate of the load line displacement deduced from experimental measurement
Eq. 1 clearly shows that the constitutive term gc (subscript C stands for Constitutive or Creep) is a key variable for the calculation of C*.
D e t e r m i n a t i o n O f 8 c
What is measured experimentally is ~exp, the total load-line displacement rate which incorporates both constitutive
(~ c ) and structural ( ~ s ) terms"
~exp - ~C +~S (3)
Starting with Eq.3, there are two methods allowing to determine ~c- The first one is what the standard ASTM E 1457-
98 suggests. This procedure, referred to as "ASTM method", deduces the constitutive term ~c by subtracting the calculated
8s to the experimental load-line displacement rate. The second one, called
"Ire
method" throughout the paper, directlyestimates the constitutive term ~ c by using the reference length
(lref)
concept.The ASTM method assumes that the structural term ~s is uniquely due to the crack advance (elastic-plastic term, not time- dependent) and may be estimated, for instance in the EPRI [4], the R6 rule [5] and the French A16 guide [6] because this
load-line displacement is directly related to J-integral. It is then straightforward to deduce the constitutive term ~ c as follows
1
= ---F- E + ( n + l ) J p (4)
where •
fi =crack growth rate, da/dt
Jp = fully plastic component of the J-integral
t7 n n = stress exponent in the Ramberg-Osgood stress versus strain relationship (e = B o ) E = elastic modulus
The ! ~ method consists in calculating directly the constitutive component ~c by using the reference length
lr~f
concept [1][7][8]Sex p
=lrefgre f
(5)where gref is the strain corresponding to the reference stress O're f by using the constitutive equation. For CT specimens
F
Uref = (6)
BWm(a / W)
II
<WI < Wll
l w/I I Iwl l
m ( a / W ) = - 1+1.155 + (1+1.155) 1+1.155 inplanestress
It has been shown that [ 1] •
l r e f - ] t ( W - a)
It is worth noting that both the R6 rule [5] and the A16 guide [6] suggest the following expression" E
8 exp - ~ el ~ ~ ref ~ r e f
where ~el is the elastic opening displacement. From Eq.5 and 10,
lref
may be identified as ~el E / ~ref-Since • ~ - g38exp + C38exp " a
exp & 0a
The constitutive term is identified as ~c -
In primary creep,
_ 08exp
0t
e r e f = B , c y n l o t P l i r e i
(8)
(9)
(10)
(11)
(12)
where B 1 , nl, pl are the primary creep coefficients (13)
Then" ~c - ~LSexp (14)
In secondary creep, Eq 2 leads to [8]"
~c = ~exp when t > tps (15)
where tps is the transition time between primary and secondary creep regimes. Note that Eq.14 is the expression which is often used. Moreover, Eq. 14 and 15 directly utilizes the experimental measure of the load-line displacement, provided that for Eq. 15 tps is defined. Note that in Eq. 14-15 are obtained regardless of the
lref
definition.The structural term ~s, according to Eq.9, is given below"
~S = --3-Sexp [ ~ +1 ~ n 1 O m ( a / W)] • (16)
( W - a) m(a / W) aa
Validity Of The ASTM E 1457-98 Procedure
The standard suggests, on the one hand, not to select crack growth data prior to the first 0.5mm crack extension. On the other hand, a time lower limit is defined by the following transition time tT:
K2 ( 1 - v 2 )
tT = (17)
E(n + 1)C * (t T )
The upper limit is bounded by the inequality 3c /~exp > 0.5. A discussion about these limits will be considered
further.
Moreover, side-grooved specimens (up to 25% of the original thickness) are necessary to meet crack front straightness requirements and the net thickness (Bnet) is considered for the C* parameter calculation.
Generally, the problem encountered for side-grooved specimens is the difficulty to define a realistic hypothesis between plane strain and plane stress states. Our experience on 316L(N) CT specimens [9] indicates that it is necessary to run a finite element analysis to define which hypothesis is relevant. But, for side-grooved specimens, either 2D simulation is carded out which raises the problem of which thickness to be accounted for • the gross (Btot), the net (Bnot) or an effective (Boff) thicknesses, or 3D computation is conducted but it is quite time consuming. In addition, in 3D one gets C* value all along the crack front. In fact, despite the side-grooves the crack front is not so straight as expected. May be, axisymmetricaUy cracked specimens as proposed in [ 1] would be appropriate, but it is noted that getting a regular axisynunetrical crack is very hard. Anyway, in this paper, the test data are brought with their authors assumptions about the thickness and the stress state.
PRESENTATION OF THE DATABASE
A total of 24 creep crack growth tests on CT specimens is examined in this paper. The materials of interest consist of base metals selected from a more comprehensive database :
(ii)
(iii)
(iv)
to as CrMoV-C material, and in-service exposed condition (Hot part sample), noted CrMoV-H from now o n . 5 CT specimens are issued from CrMoV-C steels (CT 8_10, 8_11, 8_13, 8_14, 8_16) whereas 8 CT specimens come from the CrMoV-H material (CT 1_31, 1_62, 1_64, 1_65, 2_42, 2_54, 2_63, 2_64). The specimens are side-grooved, with Btot = 20ram, Bnet = 16mm and W = 40mm. Plane strain condition with Bnet thickness are assumed.
a 316 austenitic stainless steel (Piques [1]). This material will be referred to as 316L(N)-RP. 4 CT specimens were tested at 600°C • CT40, 52, 60, 62. The characteristic dimensions of the specimens are • Btot = 10mm, W = 40mm. Piques [ 1] assumes plane stress conditions for these specimens that are not side- grooved.
a 316L(N) austenitic stainless steel issued from (Laiarinandrasana [9]) called 316L(N)-LL material, dealing with the creep crack initiation study at 650°C. 5 CT specimens were tested (CT 22, 23, 33, 52, 53). There is no side groove for 316L(N)-LL specimens, Btot = 25111111, W = 50111111. Note that except for CT 52 and 53, the specimens were not fatigue precracked but notched by machining with a notch radius of about 50gm. Plane stress condition is assumed.
The same material as for 316L(N)-LL but issued from (Polvora [10]), consisting of 2 CT specimens (CT 86, 87), side-grooved. Btot = 25mm, Bnet = 20nma, B e f f = 16.7mm and W = 50mm. Plane strain condition
and Be~r are assumed for the calculation. This material will be noted 316L(N)-JPP.
THE CREEP ~C CALCULATION
CrMoV Steel
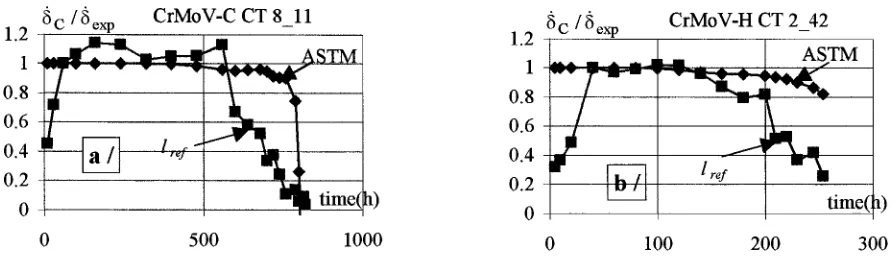
The example shown in fig.la deals with CT 8_11 specimen, for which F = 9293N, initial (resp. final) crack depth ao = 21. lnma, aF = 27.8mm. The test lasted about 800h and the conventional transition time regarding the load-line displacement
model is about 21h [8]. The formulae in Eq.14 and 15 are applied in order to calculate ~c for the
lr~f
methodology whereasfor ASTM, Eq 4 was considered. Fig.1 shows the the ratio $c / Sexp history.
8 c / 8 exp CrMoV-C CT 8_11 1.2
1 -] . . . . . ~ ~ ,,J_~
0.8
0.6 - ~
0.4 I
!,~2
0.2-
_
~ ASTM
~ i t time(
h)
1.2
1
0.8 0.6
0.4
0.2
0
~C / ~exp
- ~ L I B A ~ • [] l
CrMoV-H CT 2 42 m
v
ASTM
timer
0 500 1000 0 100 200 300
Figure 1 • CrMoV steel comparison between ASTM and
lr~f
methodsThe ASTM method predict a ratio close to unity in the beginning of the test, it decreases beyond 750h. This is the expected trend meaning that the constitutive term is dominant in the early stage of crack growth. Then, as the crack depth
evolves, ~ c becomes more and more negligible and ~exp increase is due essentially to the structural term (crack advance).
With the
lref
method, the inital value of ~c / ~ exp is less than unity, because the primary creep model (Eq.14) does notmatch very well the first part. The first point where the ratio is exactly 1 corresponds to the transition time tps (about 2 lh). This point represents the first time when Eq. 15 is applied. Between 20h and 600h, the ratio value is greater than but close to unity. The scatter comes from the derivative operation applied on experimental (hence scattered) values. These values can be considered to be equal to unity.
Beyond 600h, the two curves are different in the sense that
lrey
method always underestimates the time corresponding toc / ~ exo equals 0.5. The difference for all the CrMoV-C tested CT specimens is valued at about 100h to 300h.
the lr~f
method, the limit of 0.5 for ~c / ~exp ratio is never reached for the ASTM procedure. Probably because the crackgrowth is limited (about 3.7mm for which a/W=0.6), compared to 6.7mm (a/W=0.7) for CT 8-11.
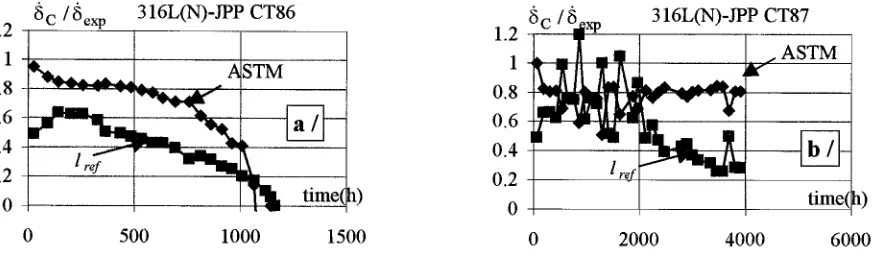
Austenitic Stainless Steel 316L(N)
As opposed to the CrMoV steel, the 316L(N) stainless steel displays important plasticity and primary creep stages. It is considered [1, 9, 10] that the most interesting phenomena occur during the primary creep stage. For this reason, the
lr~f
method utilizes always Eq. 14 to estimate the constitutive term of the load-line displacement rate.
Fig.2a is related to the CT86 coming from [10] : F = 14250N, ao = 26.6nmL aF = 36.3mm. The test duration is about 1100h and the author notes that the conventional initiation time is about 27h. Whereas fig.2b corresponds to the CT87 [10] : F = 13250N, ao = 30. lnun, aF = 31.4mm. The test lasted about 4000h and the conventional initiation time is about 200h.
l~ef
method always underestimates the 8c / ~exp ratio. Accordingly, this latter reaches the 0.5 limit very early in fig.2a •t = 500h whereas for ASTM method t = 900h ! In fig.2b we can see again that the ratio predicted by the ASTM method never reaches 0.5, whereas
l~f
method estimates this occuring at about 2000h. This may be due to the crack extension of only 1.4mm.8 C / ~ exp 316L(N)-JPP CT86 " T87
1.2-
1 - ASTM
0.8
o.6
0.4 ... / re~'~ 0 . 2 -
...
AsTM
• ~ ~ 1 ~ ' timel )
1.2
1
0.8
0.6
0.4
0.2
0 time(~)
0 500 1000 1500 0 2000 4000 6000
Figure 2 : 316L(N) steel comparison between ASTM and
lr~f
methodsThe Reference Length Modeling
We have already mentionned that the primary creep model underestimated the value of~ c . Piques [1] and Molinid [8] note that the simulation of load-line displacement can be achieved either by a derivative or by a displacement approaches :
-The derivative approach consists of utilizing the deformation rate (suitable for creep constitutive) and integrating it
in order to obtain the load-line displacement. We will consider the "time hardening" approach : t
nl pl-ldt ' hence ~(t)=
~lrefBlPlCynleftPl-ldt
d8 = lref B lPl CYref t
0
nl Pl -The displacement approach directly takes the intantaneous value of 8" 8 ( 0 -
lrefBlCYreft
It turns out [1,8] that always : 8derivative < ~displaeement ~ ~exp. The explanation is rather simple : the reference length coefficient 7 was fitted with the displacement approach. In fact, as it will be noticed further, a fit based on the derivative approach leads to a greater value of 7. The fig. 1-2 comparisons are made in terms of derivative approach. In our opinion, this is the main reason why the
lref
method always underestimates the rate of the load-fine displacement.Moreover, in the beginning of the test, the load-line displacement is due to the constitutive term. Typically, for 316L(N) stainless steel during the incubation time there is no crack growth. Accordingly, the load-line displacement increase is
uniquely due to creep deformation (hence constitutive term). But in the fig.l-2, the fisrt value of 8c /8exp ratio is always
about 0.5 for the lr~f method. The ASTM method does not meet this problem by construction : when Aa = 0, Jp = K = 0, hence the structural term is null. We think that for the
lref
method, some "asymptotic" conditions are lacking :(i) During the incubation time (no crack extension) the following equality has to be verified" 8 c - ~ exp.
The key point is the modeling of the reference length. According to Piques [ 1] lr~f is supposed to represent a fraction of the remaining ligament (see Eq. 5 and 9). The determination of 7 consists in plotting the time history of 7 :
8
7(0 = exp (18)
(W - a)B lCrnlf t pl
Many authors [1, 8, 9, 10] note that this term is not so constant as it is supposed to be. Furthermore, 8c being the key variable in the C* calculation, the more suitable way to fit the
lr~:
model is by the derivative approach. That is :7(0 = exp (19)
(W - a)B lPltTnelf t pl-1
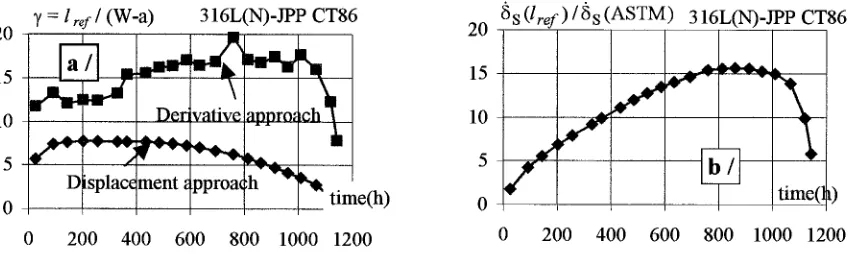
Fig.3 illustrates some aspects of the previous comments. We have taken as an example the already characterized CT86 specimen (fig.2a). The "constant" 7 evolves as time progresses. For short time, the ~ value is not the same as for long time. Additionnally, the 7 value corresponding to the derivative approach is greater than for displacement approach.
7 = l r~f / (W-a) 316L(N)-JPP CT86
2 0 - ) ~ iltll
15- -la [I . ~
\
10 - - - - ' Derivative at)t)ro~
Displacement ~Lpproa(:h ")~l)~)s~ time(h)
. . . , . .
0 200 400 600 800 1000 1200
8 s (lre f)
/ 8 s (ASTM) 316L(N)-JPP CT86 2 0 -10 . . . .
5 . :
Ib/I
0 - I time(l
0 200 400 600 800 1000 1200
Figure 3 :
lref
method : displacement and derivative approachesFor the long lime determination (during crack growth), the
lref
method suggests that the structural term is obtained by derivating the load-line displacement model with respect to the crack depth (Eq. 16). If this term is considered to be the non time dependent one (hence elastic-plastic term issued from Eqs. 4 and 16), the following condition should be verified :B I 2 K 2 1 I 1 nl 0 r e ( a / W ) l (20)
f f + (n + 1)Jp = -8
exp (W-
a) q m(a / W) 0aLet us consider the following ratio 8s
(lref)
/ ~s (ASTM), where subscript S denotes the structural term"E
' 1
8s(lref )
8exp 1 n 1 ~n(a W)( W - a) m(a / W) ~a
8 s (ASTM)
,[2,,
1
F E + ( n + l ) J p
(21)
Fig.3b shows the evolution of this ratio with respect to the current time. It clearly indicates that the
~s (lref)
/ ~s (ASTM) ratio is not constant and that the structural term obtained by the 1~ method is always overestimated. We have to point out that the condition described in Eq.20 has not been applied in [1][8]. Since 7 is the only adjustable parameter that might satisfy Eq. 19 and 20, we think that there are too many requirements imposed to a single parameter. It would be more appropriate to change thelr,fmodel
:lr,f =fla/W,
F) wherefis a function that has to be defined.The conclusion of this part is that ASTM method is appropriate for the structural term of the load-line displacement rate
determination. It allows to validate the calculation of C* when 8c / 8 exp >0.5 (dominant constitutive term).
Creep Regime Identification
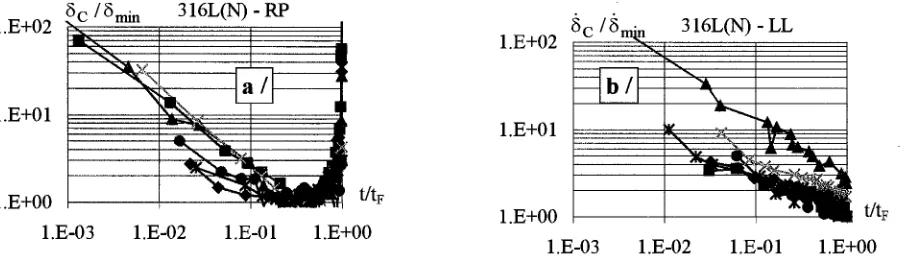
secondary creep (stationary deformation rate) and tertiary creep (increasing deformation rate). The tertiary creep is generally skipped out because either damage or ageing effects occur in this stage. Additionnally, since C* is supposed to be the load parameter corresponding to stationary creep regime, only the experimental data related to the minimum strain rate are valid.
In the following fig.4-5, we plotted the ratio ~ c / ~min where 8min is the minimmn load line displacement rate, with
respect to t/tF where tv is the fmal time of the test. If, indeed, ~c reflects the creep behavior (reference length concept), then this minimum value is likely due to the secondary (stationary) creep regime. In the fig.4 corresponding to the CrMoV steel (Hot and Cold parts of the turbine), the three creep stages can clearly be distinguished. The situation is different for the 316L(N) steel (fig 5). The secondary creep is very limited whereas the primary creep has a wide domain. As a proof, we plotted (fig.5b) the same curve for 316L(N)-LL material [9]. This work aimed at analyzing the creep crack intitiation, interesting only a 50~tm crack progress. The test durations were about 200 hours and the crack growth measurements indicate about 200 to 3001xm crack advance. It was shown that only primary creep was concerned with these tests. Actually, in fig.5b, all of the tests were stopped dtaing the load-line displacement deceleration.
1.E+02
1 .E+O 1
c / ~min _ CrMoV-H . ~ c / ~ m i n CrMoV-C
1 .E+00
1.E-03
1.E+02
t/tF
1.E+01
1.E+00
J
Ib'
. . . , , .,~m
1.E-02 1.E-01 1.E+00 1.E-03 1.E-02 1.E-01 1.E+00
Figure 4 • Creep behavior reflected by the load-line displacement rate of the CrMoV
1.E+02
1.E+01
1.E+00
~c/~min 316L(N) - RP ' ' ' ' / n
,_at_
g
l
t
m1.E-03 1.E-02 1.E-01 1.E+00
1 .E+02
1.E+01
1.E+00
c / " 316L(N) - LL
,. ,,
,
t/tF
1.E-03 1.E-02 1.E-01 1.E+00
Figure 5 " Creep behavior reflected by the load-line displacemem rate of the 316L(N)
P L O T T I N G THE MASTER CURVE
c Influence On The Master Curve
In the view of the ~ c trends, let us consider the evolution of C* (the driving parameter of which is ~c ) regardless of
the fi trend.
Primary_ creep regime • C* will decrease in accordance with ~c curve. This first transient domain is the origin of the tail effects observed when plotting the master curve. A backward evolution of C* parameter may be seen.
Final transient regime" According to 8c evolution, C* will continuously increase. Since the structural term has been already eliminated, this increase may be caused by two effects :
(i) stress increment due to the crack growth, so that the stationary strain rate increases with respect to the power law of the reference stress ;
(ii) development of the tertiary creep inside the specimen.
The available master curves met in the literature were based upon the final transient regime because this is the part where one can fit a slope corresponding to the exponent of the correlation. However, the tertiary creep regime is seldom modeled in the behavior due to other complex phenomena that may occur : ageing or damageing of the material.
Lower Limit"
The ASTM standard recommends not to select crack growth data prior to the first 0.5mm crack extension, considering them to be transient creep crack growth data. In our opinion, the crack extension for which the transient creep operates depends on the creep behavior of the material. As we mentionned for the 1CrlMoV steel, the transient creep exhausted before the incubation time is reached. Therefore, we think that a constant value (0.5mm) is not appropriate for checking the validity of a test.
Concerning the transition time tT (Eq. 17), Curtit [11] notes that it is always underestimated for the 316L(N) steel. In fact, this local transition time was calculated by equaling the asymptotic equivalent stress in the vicinity of the crack tip. But it does not reflect [12] the global transition time handled in the creep crack growth test procedure (dealing with the load-line displacement evolution).
At this stage, we can suggest some practical operating procedures : as far as C* parameter is concerned, a "stable secondary creep stage" is considered. Therefore, the data must be selected during the time interval for which the load-line displacement rate is minimum. However, we have seen that this limit may be represented by a vertical line due to fi evolution (case of the CrMoV steel). So the last point of the tail (or the starting point of the last transient stage) will be assumed to be the lower limit of the fi versus C* curve. For the 316L(N) steel, this point corresponds to the C* minimum value.
Upper Limit
For the ASTM standard, the upper limit is characterized by 8 c / ~ e x p < 0.5. In fact, this indication is useful if
experimental data are directly utilized, by ensuring that the structural term is not accounted for. But, the limit does not
operate on the constitutive term 8 c - Since, the final transient part incorporates both the transient loading under secondary creep and the tertiary creep regimes. The upper limit should discriminate the tertiary creep stage. To do this, we need to
remind the reference length concept 8 c = ~/(W - a)B 2 cr refn2. Assuming that the crack extension is fully accounted for by this
n 2 fomula, the secondary creep regime is established as long as 8c is proportionnal to ( W - a)B2~re f .
8c ~ Constant (22)
( W - a ) B n2 2 ~ ref
Note that following Eq. 10 or reference [ 13] where l r e f - ~ , Eq.22 respectively becomes • ~ r e f
8c N
c -- Constant or, = Constant. (23)
n2
n 2 ( K I / cr ref ) 2 B 2 ~ref
( S e l E / C r r e f ) B 2 ~ r e f
where the important notice is that besides (~ref, the denominator incorporates other terms depending on the crack length. In this paper, we used Eq. 22 for the upper limit concern. The use of Eq.23-24 probably leads to the same conclusions as below.
/l Versus C* Correlation
To start with, let us consider/~ versus C* plots for the CrMoV-C steel (Fig.6). Note that there is no point representing
the incubation phase since /l is null. The first point in fig.6 corresponds to the stationary value of 8c .That is why C* is stationary in the first part of the curve (vertical lines). This illustrates the tail effects for this kind of material. When C*
1 .E+00
~ ( m m / h )
m
1.E-01 ,. ; , ~ " " " . ' a ~ - ~ a : ~'~'A r ~ ' ~ ' ~ ' ~ * ' ~ ,
. . . . ~ : ~ v i i
( ~ . . . ,, ,
,.,, ,.___- , ,. ~, ,,,, . , , ,
1.E-03 ~ - ' • ,,, ,~ .... ." ,
1.E-04 ~ , '~' ' ,. ~ , - , '"',, , ", ,. , ;
--O-- CT 8 10 m
~ C T 8 11 m
~ C T 8 13 ... ,~ - CT 8 14 ~ C T 8 16
1.E-05
C*~/mm.10
1.E-02 1.E-01 1.E+00 1.E+01
Figure 6 fi versus C* curve for CrMoV-C (selection of data)
1.E+00
1.E-01
1.E-02
1.E-03
1.E-04
1.E-05 I
1 .E-02
~.(mm/h)
~ CT2_42 . ~ CT2_54 -" CT2_63 ~=x TM CT2_64
~ CTI_31
z
~ C T 1 62 - + - - CT1 64 C*(N/mm.h) ~ CT1_65
I
1.E-01 1.E+00 1.E+01
Figure 7" fi versus C* curve for CrMoV-H (selection of data)
The same diagram is presented in fig 7 for the CrMoV-H material. Limit symbols were not reported in order to avoid the figure overloading (8 tests).
1.E+00
a(mm / h)
Idm
. . . _ j , 4 1 6
1.E-01 ! ~ ~ ~
. . . A ....,,,~ t . ~ ~ A r ~ , - r ' , ~
~ " * ~ ~ I 4 U
1.E-03 ~ ~ - - - .... ' ~'-"? ' " ~ CT60 1.E-04 ~ ~ ,,
1.E-05
--<~- CT62 C*(N/nun.l:
1.E-03 1.E-02 1.E-01 1.E+00 1.E+01 1.E+02
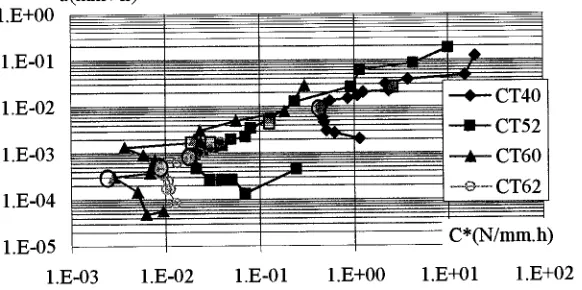
Figure 8 • fi versus C* curve for 316L(N)-RP (selection of data)
In the following, we display the results related to all the tests in accordance with the abovementionned procedure, especially by using both upper and lower limits. All of the experimental points included between the limit symbols are
utilized in order to fit a power law ~i = AC *q resulting in obtaining the A and q coefficients.
1.E+00
1.E-01
1.E-02
1.E-03
1.E-04
1.E-05 I
1.E-03 h ( m m / h )
~ C T 8 10 CT8 11 ~ C T 8 13 -if3 ~ ... CT8 14 ~ C T 8 16
i
~ C o r r e l a t i o n ]
1.E-02 1.E-01 1.E+00 1.E+01
Figure 9 • fi versus C* correlation for CrMoV-C
Fig.9 shows the selected points initially coming from fig.6 for the CrMoV-C material. In addition, the correlation line is provided with the coefficient values (A = 0.018, q = 0.78). The same procedure as for Cold Part material has been applied for its Hot counterpart (fig.10). The coefficient values are (A = 0.021, q = 0.71). A larger scatterband is observed compared with
the Hot Part material. Note that these coefficients were not determined by Molini6[8]. This author argues that the 8exp
utilized by the
Ire
method incorporates a dominant structtwal part, so that the correlation is a self evident one.1.E+00
a(mm/h)
I
i
i
,
1.E-01
1.E-02
1.E-03
1 .E-04
1.E-05
CT2 42 CT2 54 • ,~ CT2 63 ---~6 .... CT2 64 ,X CT1 31 CT1 62 CT1 64 CT1 65 ~ Correlation
1.E-02 1.E-01 1.E+00 1.E+01
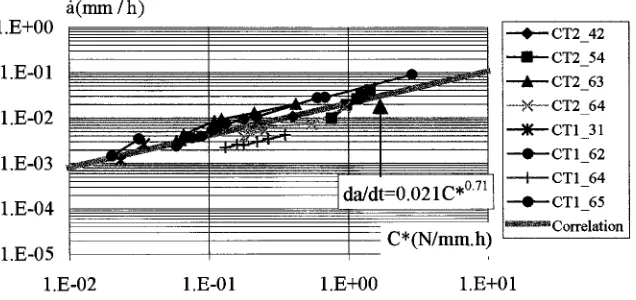
Figure 10 • ~i versus C* correlation for CrMoV-H
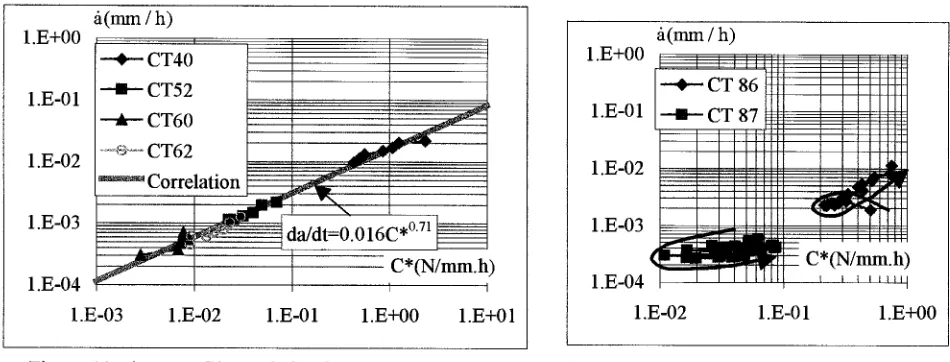
F i g . l l displays the results for the 316L(N) - RP tests. The fitted coefficients (A = 0.016, q = 0.71) are very close to that
Piques [ 1] gives earlier (A = 0.0166, q = 0.73). This is due to the C* formula used by the
lref
method. In fact, 8 exp is utilized instead of 8 c , as long as 8c / Sexp < 0.5. As this time interval is underestimated by thelref
method, the relation 8 exp z $c is fully justified.For fig.12, we did not apply the procedure due to the scatter especially for the CT87 test and to the unsufficiently tested specimens for this material. The arrows indicate how the points evolve. It has been explained [12] that the CT87 evolution characterizes creep tests with low load, whereas high load generally results in CT86 like trend. The primary creep regime covers the incubation time and a large part of the crack growth stage. The secondary creep regime is very short.
In [10][11], the authors added 316L(N)-LL tests in order to yield the ~i versus C* correlation. Since these tests were
interrupted while 8 c was still decreasing (Fig 5b), only the tails are represented in the a versus C* diagram. Therefore, for the 316L(N)-JPP steel, further creep crack growth tests are necessary to determine correctly the A and q coefficients. We
should mention that with both CT86-87 tests, the obtained exponent is q = 1.0. But the greatest care must be taken in considering this value regarding the lack of database.
~ . ( m m / h )
1 . E + 0 0 ,
CT40
1.E-01 ~ C T 5 2 ,, , .,, , ,,, ,, , , , ,
,, " ~ ~ . , , a ~ '"
1.E-02 ... ~ ' ~ CT62 " ~ 1 1 ~ , F " "
: : , ~ , , ~ , , . ~ . ' . . . . " . .. : . . . ' ...
,
~ Correlation .: . ~ _ ... :.. .... . ,.
' ' 1 ' ~ - - ' ~ N " ' 1.E-03 ~ d a / d t = 0 . 0 1 6 C *°71 . ' '
~ . . .
. . . .
C*fN/mm.t~)
1 . E - 0 4 I I
1 . E - 0 3 1 . E - 0 2 1 . E - 0 1 1 . E + 0 0 1 . E + 0 1
fi(mm/h) 1 . E + 0 0 I i i i i i ~
CT 86
1 . E - 0 1 ~ CT 87
1 . E - 0 2 , '
1 . E - 0 3
1 . E - 0 4
_ _ . ~ - - ~ - - ~ , u
~ - - ~ U " - ' - ' ' ~ "--1---
~m__.~= ~m__..._ . . . . ,..am
. . . . • , m m
i i I I
J z
I I
ll
; t [ ; I I
il
k,I
J ~ ~ i,,1
• . , , , ,
C*(N/mm.hl
I I I I I l l l
1 . E - 0 2 1 . E - 0 1 1 . E + 0 0
Figure 11 • fi versus C* correlation for 316L(N)-RP Figure 12 • fi versus C* for 316L(N)-JPP
F R O M C R E E P T O C R E E P - F A T I G U E L O A D I N G
The commonly used model for creep-fatigue crack growth assumes an additive split of the crack growth rates •
(da/dN)oreep_fatigue = (da/dN)fatigue + (da/dN)creep (24)
The creep component (da/dN)o~p is supposed to follow the aforementionned correlation, whereas the fatigue component (da/dN)f~t~g~ is governed by the Paris' law. In our knowledge, this approach has not been applied neither to the 1Cr-lMo- 0.25V ferritic steel, in spite of 7 available tests on CT specimens under creep-fatigue conditions ; nor to the 316L(N)-RP material for which 4 creep-fatigue tests on CT specimens were carded out.
Polvora [10] successfully utilized the fi versus C* correlation (A = 7.10 -3, q = 0.73) to predict the crack growth of CT specimens made of 316L(N)-JPP material and subjected to creep-fatigue loading. Furthermore, Curtit [11] applied the same approach to predict the crack propagation under creep-fatigue loading of semi-elliptical defects incorporated into plates made o f b o t h 316L(N) base metal (A = 1.2 10 -3, q = 0.67) and welded joints (A = 0.5, q = 1.13).
C O N C L U S I O N
The ASTM E 1459-98 standard covers the determination of creep crack growth rates in metals at elevated temperature using CT specimens. This results in the correlation of the crack growth rate fi with respect to C* load parameter obtained
under pure creep (steady load) condition. The constitutive term of the load-line displacement rate (8 c ) is a key variable for the determination of the C* parameter. The calculation of this variable is related in detail : the reference length model directly determines this constitutive term, but due to a lack of asymptotic conditions, it is always underestimated, whereas, the ASTM procedure consisting in subtracting the known structural term to the experimental data turns out to be relevant.
Some recommendations about both lower and upper limits of the ASTM procedure are suggested. In order to apply these recommendations, two specific materials have been addressed : a 1Cr-lMo-0.25V ferritic steel and a 316L(N) austenitic stainless steel. Creep crack growth on 24 CT specimens are analyzed. For each test, the selected data according to the aforementionned recommendations are utilized in order to establish the fi versus C* correlation. Then, for both prescribed materials the fitted A and q coefficients according to fi = AC* q are given.
Furthermore, some predictive extensions to creep-fatigue conditions applied on both CT specimens and plates containing semi-elliptical defect are quoted.
NOMENCLATURE
A = master curve coefficient
a, ao, aF = crack length, initial and fmal defect size a , da/dt = crack growth rate
Btot, Beff, Bnet = gross, effective and net specimen thickness B1, B2 = primary, secondary creep constitutive law coefficients C* = creep load parameter
F = applied load
Jp = fully-plastic component of the J-integral K = elastic stress intensity factor
lref = reference length m(a/W) = limit load ratio
nl, n2 = primary, secondary creep constitutive law stress exponents Pl = primary creep constitutive law time exponent
q = correlation exponent t = time
tps = conventionnal transition time between primary and secondary creep regimes W = specimen width
y = constant in reference length expression 8~xp = load-line displacement
e x p , ~ C , ~ S -" experimental, creep, and structural load-line displacement rates
~ref-- reference stress
REFERENCE
[11
[21 [31 [41
[5]
[6]
[7]
[81
[91
[101
[11]
[121
[131
Piques, R., "Mechanics and mechanisms to crack initiation and growth under viscoplastic conditions in an austenitic stainless steel," Thesis (in French), Ecole Nationale Sup6rieure des Mines de Paris (1989).
Pineau, A., "Assessment procedures for defects in the creep range, "ESIS 12. MEP, London, pp 355-396 (1992) ASTM E 1457 - 98, Standard Test Method for Measurement o f Creep Crack Growth Rates in Metals (1998) Kumar, V., Gemaan, M.D.and Shil~ F. "An engineering approach for elastic plastic fracture analysis," NP-1931, Project 1237-1, Topical report, EPRI (1981)
Milne, I., Ainsworth, R.A., Dowling, A.R., Stewart, A.T., "Assessment of the Integrity of Structures containing Defects" CEGB Report R/H/R6 - Revision 3 (1986)
Drubay, B. et al ''A French guideline for defect assessment at elevated temperature and leak before break analysis,"
Proc. Of 9 ~ International Conference on Nuclear Engineering, paper 713, Nice France April 2001
Pineau, A., Piques, R. and Bensussan, P., ''A critical assessment of global mechanics approaches to creep crack initiation and creep crack growth in 316L steel," ASTM STP 995, pp 27-54 (1989)
Molini6, E., "M~canique et m~canismes de l'endommagement et de la fissuration en viscoplasticitO des aciers ferritiques faiblement allies. Elements d'estimation de la duroc de vie r~siduelle de composants fissur~s, " Thesis (in
French), Ecole Nationale Sup6rieure des Mines de Paris (1991).
Laiarinandrasana, L., "Crack initiation at high temperature on an austenitic stainless steel," French CEA report CEA-R-5692(E), (1996).
Polvora, J.P., "Crack growth in an austenitie stainless steel at high temperature," French CEA report CEA-R-5802 (in French), (1998).
Curtit, F. "Creep-fatigue propagation of semi-elliptical crack at 650°C in 316L(N) stainless steel plates with or without welded joints, "French CEA report CEA-R-5893 (in French), (2000).
Laiarinandrasana, L., Polvora, J.P., Piques, R. and Martelet, B, ''Modelling tail effects in creep-crack initiation and growth for 316L stainless steel, "Proc. of International HIDA Conference, pp.Sl-10 1-6, Saclay France April 1998 Piques, R., Molini6, E. and Pineau, A., "Comparison between two assessment methods for defects in creep range,"
Fatigue Fract. Engng. Mater. Struct. Vol. 14 No. 9, pp. 871-885 (1991).