BAKER, BECCA A. Maximizing Multisource Feedback: The Use of Goal Setting to Facilitate Performance Improvement. (Under the direction of Samuel B. Pond and S. Bartholomew Craig.)
The use of multisource feedback in organizations for employee development has grown significantly in the past two decades. However, it is still unclear as to which
individuals respond to the feedback and improve their performance on the job. The present study examined a theoretical model representing the relationship between multisource feedback and performance change. The model tested in this research was a variation of the model proposed by Smither, London, and Reilly (2005), with a focus on the goal-setting mechanisms that contribute to performance change. In addition, the personality constructs of Conscientiousness, Neuroticism, learning goal orientation, and general self-efficacy were examined as predictors.
MAXIMIZING MULTISOURCE FEEDBACK: THE USE OF GOAL SETTING TO FACILITATE PERFORMANCE IMPROVEMENT
by
BECCA A. BAKER
A dissertation submitted to the Graduate Faculty of North Carolina State University
in partial fulfillment of the requirements for the Degree of
Doctor of Philosophy
PSYCHOLOGY Raleigh, NC
2007
APPROVED BY:
________________________________ ________________________________ Dr. Mark A. Wilson Dr. Adam W. Meade
________________________________ ________________________________ Dr. Samuel B. Pond III Dr. S. Bartholomew Craig
BIOGRAPHY
Becca A. Baker was born in Marietta, Georgia to parents Hugh and Nancy Platten. She graduated from Pensacola High School in Pensacola, Florida in 1996 and entered Baylor University that fall. She graduated with a Bachelor of Arts degree in Psychology in 1999. After graduation Becca moved to Gainesville, Florida to support her husband as he pursued his medical degree. During that time she was employed at the Center for Applications of Psychological Type (CAPT). Upon her acceptance to graduate school at NC State she moved to Durham, North Carolina and began her graduate studies in the fall of 2002.
ACKNOWLEDGEMENTS
There are a number of people who have made this research project possible. First of all, I would like to thank my parents, Hugh and Nancy Platten. Thank you for you for always believing in me and encouraging me in all of life’s pursuits. I would like to thank my
committee members, especially my co-chairs, Bob Pond and Bart Craig for their advice and guidance through this process. Than you for working with me to meet deadlines that seemed insurmountable and always demanding the best from me.
I would also like to thank family and friends who provided words of encouragement and moments of escape during this project. These individuals include Steve and Mary Baker, Jeff and Kelly Baker, Nicole Fain, Jennifer Clements, Penny Koommoo-Welch, Tara
Behrand, Christina Mendat, Kari Yoshimura, Torrey Mullen, and Denis Craven. Each of these individuals made the process of writing a dissertation much more bearable.
I would like to extend a special thank you to the staff and faculty at the Center for Creative Leadership. There were a number of wonderful individuals who collaborated with me on this project including Laura Santana, Michael Hoppe, Tracey Patterson, Emily Hoole, Judith Steed, and John Fleenor. I also appreciated the guidance and support provided by Bill Gentry, Cindy McCauley, and Bill Drath.
TABLE OF CONTENTS
PAGE
List of Tables...v
List of Figures ...vi
Section I: Literature Review...1
Introduction...1
Literature Review...2
Multisource Feedback...2
Feedback Characteristics ...5
Goal-Setting Theory...8
Goal Difficulty and Specificity...10
Goal Commitment...11
Goal Orientation...12
Personality...14
General Self-Efficacy...16
Taking Action ...18
Section II: Method...19
Participants and Procedure...19
Measures ...21
Analyses ...28
Section III: Results...30
Comparison of Means ...31
Correlations...33
Path Analysis ...34
Post Hoc Multiple Regression Analysis ...36
Section IV: Discussion...37
Limitations and Future Research ...41
Conclusion ...43
Section V: References...45
LIST OF TABLES
PAGE
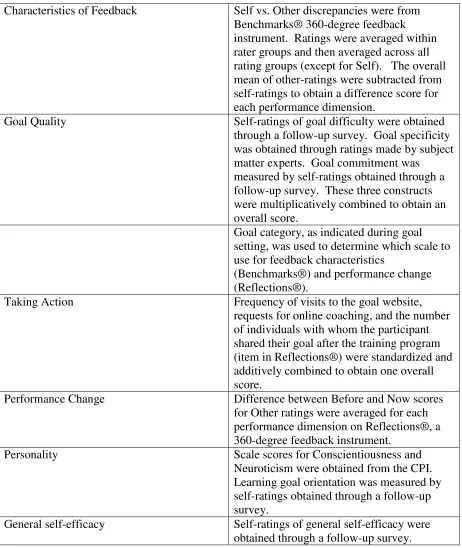
Table 1. Description of Operationalization of Constructs in Model...54
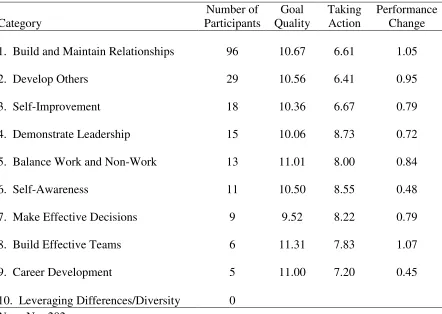
Table 2. Frequency Counts and Mean Scores by Goal Category ...55
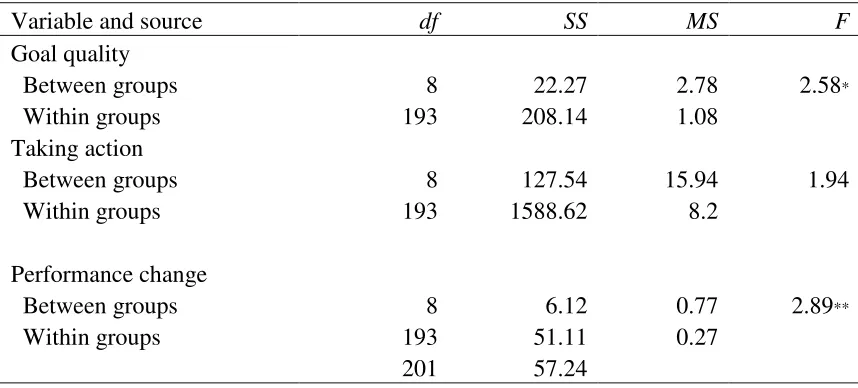
Table 3. One-Way Analyses of Variance for Effects of Goal Category on Goal Quality, Taking Action, and Performance Change ...56
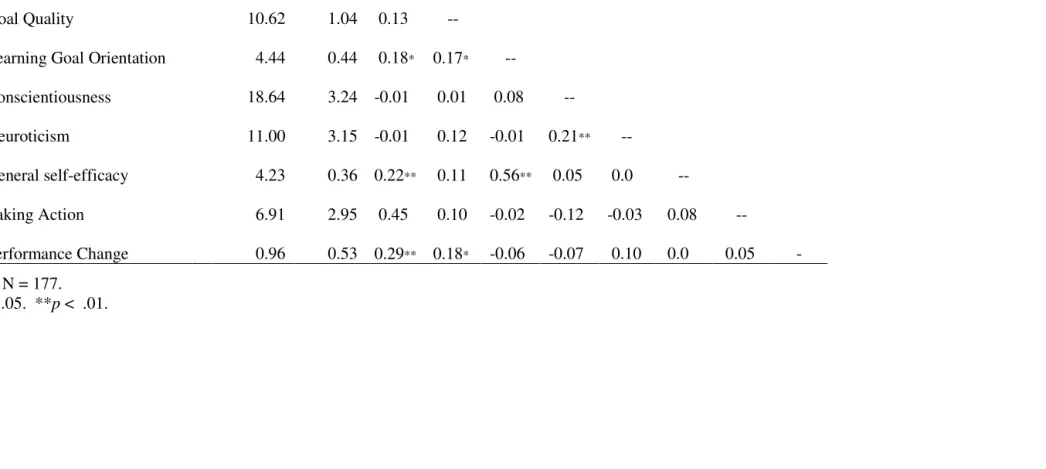
Table 4. Means, Standard Deviations, and Correlations for Sample 1 ...57
Table 5. Means, Standard Deviations, and Correlations for Sample 2 ...58
LIST OF FIGURES
Introduction
There is a widely held assumption that the presentation of multisource feedback will lead to performance improvement in an individual’s work, however the results of a meta-analysis by Kluger and DeNisi (1996) challenge this belief. Based on their findings, some feedback interventions may actually result in a decrease in performance. Despite these mixed findings regarding the impact of feedback, there continues to be an increase in the use of multisource feedback in organizations as a performance enhancement tool (Bono & Colbert, 2005). With the ongoing use of feedback as a development tool for managers it is important that both academicians and practitioners understand the underlying process of the feedback-performance relationship and when it may or may not lead to performance
improvement.
Smither, London, and Reilly (2005) have proposed a preliminary theoretical model to account for the varying individual outcomes that can occur with the use of multisource feedback. According to their model, the motivational mechanism underlying the impact of multisource feedback is goal setting. In addition, they propose that variables such as
personality and general self-efficacy influence the relationship between feedback, goals, and performance. Prior research does indicate that when leaders set goals in response to
Section I: Literature Review Multisource Feedback
Multisource assessment is a form of performance evaluation in which anonymous evaluations are collected from a number of sources including supervisors, peers, and direct reports. Normally, self-ratings are also assessed, which allows an individual to compare how their self-perceptions line up with others’ perceptions of their performance. This assessment may be used for administrative purposes, such as determining promotions, or it can be a source of feedback used for developmental purposes. Benefits of this feedback method include a heightened awareness of the feedback recipient’s strengths and weaknesses, the creation of an atmosphere of constructive dialogue, and an incentive for change (Atwater & Brett, 2005). This type of performance feedback has grown in popularity over the past two decades and has been the subject of numerous research studies (Kluger & DeNisi, 1996; Smither et al., 2005). When employed with leaders, this feedback has been shown to create positive behavior change and increased self-awareness (e.g., Atwater, Roush, & Fischthal, 1995; Johnson & Ferstl, 1999).
A more recent effort to evaluate the impact of feedback on performance was undertaken by Smither et al. (2005). They conducted a meta-analysis of 24 longitudinal studies of multisource feedback. The studies included in this analysis involved the collection of multisource ratings for the same individuals at two points in time. Studies that included multisource feedback combined with training and studies involving students in a classroom setting were excluded from the analysis. Results of the analysis revealed small, positive effect sizes across rater groups of direct reports, peers, and supervisors (ds ranged from .05 to .15). A large percentage of the variance in effect sizes was unaccounted for by sampling error, suggesting that other factors could affect the magnitude of behavior change following multisource feedback.
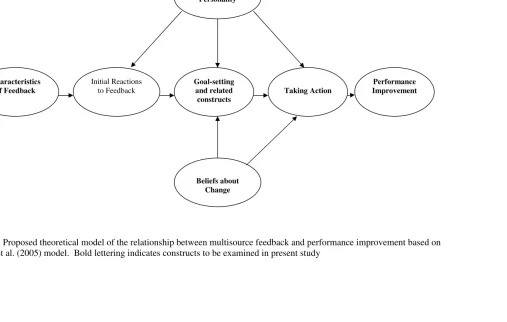
One of the weaknesses in prior research evaluating the impact of multisource feedback is that little has been done to account for the motivational processes that may be operating between the time an individual receives feedback and the time when there is an actual change in performance. Individual differences and organizational variables are also likely to impact this process. Smither et al. (2005) make one of the first attempts to organize research surrounding multisource feedback and performance. They present a theoretical model that outlines the path between the characteristics of feedback and eventual
performance improvement (see Figure 1). According to their model, performance
improvement is accounted for by an individual’s initial reactions to feedback, setting goals based on the feedback, and the motivation to take action toward their goals.
reactions to feedback. There have been mixed findings regarding the importance of this construct to performance improvement. Smither, London, and Richmond (2005) found that initial reactions to feedback were not related to the use of multisource feedback over time. Alternately, Atwater and Brett (2005) did find a relationship between reactions to feedback from direct reports and a change in performance, but did not find a significant relationship for feedback from bosses or peers. Both of these studies cited small sample sizes and measurement error as possible reasons for their inconsistent findings. Although there is value in the construct reactions to feedback, there is reason to believe that its impact will be minimal or nonexistent in the context of the current study. Leaders in the present research took part in a training program after receiving their feedback. As a part of their training they were coached on how to receive and react to feedback in order to benefit their personal and professional development. Thus, the participants’ initial reactions to feedback could be confounded by the intervention. It is likely that the coaching aspect of the training program altered the leaders’ reactions to the feedback. Therefore, due to the mixed research findings regarding the impact of reactions to feedback on performance and the introduction of a training intervention in the current sample, the construct will be excluded from the present test of the model.
multisource feedback; however, an empirical test of this model requires a more focused effort to fully operationalize the constructs in the model. The goal of the present research is to present a variation of Smither et al.’s (2005) original model that is both logical and
parsimonious. The following sections describe the constructs included in the model. Each section will review existing research literature and propose specific research questions and/or hypotheses regarding the variable’s role in the proposed model.
Feedback Characteristics
One condition that has been examined as a predictor of performance change following multisource feedback is the characteristics of the feedback itself. These
performance goal. Individuals can reduce this discrepancy by two means, either increasing their effort or adjusting the goal downward. General self-efficacy beliefs influence this effect by causing those who are high in general self-efficacy to be more resilient when faced with negative feedback. Thus, discrepant feedback in which self-ratings are higher than other-ratings can encourage a leader to set higher goals and exert more effort.
If an individual’s self-ratings are lower than, or in agreement with the ratings of others, different consequences may occur. This kind of discrepancy, or lack thereof, has been linked with lowered performance and no change in performance (Johnson & Ferstl, 1999; Podsakoff & Farh, 1989). Self-consistency theory suggests that individuals who receive feedback that is in agreement with their own self-perceptions will be satisfied and as a consequence will avoid setting challenging goals or expending effort to improve
performance. If the feedback from others is actually higher than an individual’s self-view it is possible that they will decrease their performance to correct the discrepancy.
leaders initially overrated themselves. However, underraters or in-agreement raters showed no change in performance. Johnson and Ferstl (1999) observed that in both of these studies (Atwater et al., 1995; Smither et al., 1995) self-other agreement was significantly related to initial level of performance, such that overraters tended to have the lowest initial
performance and underraters had the highest. This can be attributed to the fact that both initial performance levels and self-other agreement were based on mean others’ ratings. A main objective of the study by Johnson and Ferstl (1999) was to separate these variables and look at the effect of self-other agreement on performance across a wide range of initial performance ratings using polynomial regression. Their results showed that overraters at all levels of initial performance improved following feedback. No significant changes in
performance were found for in-agreement raters. Underraters showed a general decline in performance.
performance following feedback. These results are in line with the social cognitive view of personality. Behavioral manifestations of learning goal orientation include seeking out new challenges, striving towards goals, and persisting in the face of obstacles (Dweck, 1986). Thus, an individual’s reactions to and performance following positive performance feedback may vary depending on individual differences variables and general self-efficacy.
In the proposed model, characteristics of feedback will be operationalized as the discrepancy between self- and other- ratings from a multisource feedback instrument. Negative feedback exists when an individual overrates their performance relative to others’ ratings. When an individual underrates their performance or is in agreement with others’ ratings of their performance, positive feedback exists. The literature regarding the impact of the characteristics of feedback provides mixed evidence for the directional impact of negative and positive feedback on performance change. Additionally, these discrepancies have not been directly linked to goal quality, as they will be in the current model. As such, a research question will be postulated for the relationship between the characteristics of feedback and goal quality.
Research Question 1: How are the characteristics of feedback related to goal quality? Goal-Setting Theory
consequently explain the effects of goals on performance. These mechanisms are direction, effort, and persistence.
Goals affect direction through two somewhat automatic processes. First, they orient an individual towards goal-relevant activity and away from activities that are irrelevant. Secondly, goals activate stored knowledge and skills that an individual possesses that are relevant to performance (Locke & Latham, 1990a). A study by Nemeroff and Cosentino (1979) illustrates the directive effects of goals. In a management training program, managers were provided with feedback regarding subordinate perceptions of over forty different
manager behaviors, however they were only assigned goals for twelve of the behaviors. Significant behavior changes were found for only those twelve behaviors. By setting goals for specific behaviors, managers were able to reduce their cognitive load and focus their efforts and knowledge on specific goal-relevant activities.
The second mechanism by which goals affect performance is through the regulation of effort. Depending on the difficulty of the goal, more or less effort will be expended to attain it. Thus, effort should be mobilized in proportion to the difficulty of a goal (Locke, 1968). Numerous studies provide support for the proposition that goals regulate effort. Prior research has examined effort as reflected by physical effort (Nelson, 1978), rate of work (Cannon-Bowers & Levine, 1988), subjective effort ratings (Bryan & Locke, 1967), and effort inferences made by a third party (Terborg & Miller, 1978). Based on research to date, it is clear that goals motivate individuals to exert effort in line with the difficulty of the demands of a goal.
goal-setting domain have shown that specific, difficult goals lead people to work longer on a task than other types of goals, such as vague, easy, or “do your best” goals (Locke & Latham, 1990a). In an endurance task, Hall, Weinberg, and Jackson (1987) found that students compressed a hand dynamometer longer if they had a specific, difficult goal rather than a “do your best” goal. Similarly, in the aforementioned study by Cannon-Bowers and Levine, subjects with higher self-set goals worked longer on the task than subjects with easier goals. Challenging goals require that an individual keep working for a longer time period than would be required for easier goals.
Goal Difficulty and Specificity
The literature devoted to understanding goal mechanisms alludes to the idea that some goals may be better than others. In fact, there is overwhelming evidence from both experimental and field research that specific, difficult goals lead to better performance than specific, easy goals and vague, “do your best” goals (Locke & Latham, 1990b). Goal-setting theory states that there is a linear relationship between the difficulty of a goal and
performance. To the extent that an individual is committed to a difficult goal, they will work to perform to a higher standard (Pinder, 2005). Studies in both the lab and field settings support this proposition (e.g., Hall et al., 1987; Nemeroff & Consentino, 1979). A number of meta-analyses have been conducted to examine the goal difficulty-performance relationship (Chidester & Grigsby, 1984; Mento, Steel, & Karren, 1987; Tubbs, 1986; Wood, Mento, & Locke, 1987). The mean effect sizes range from .52 - .82, which represent effects on performance of 10.4 - 16.4% respectively.
& Latham, 1990a). Although a vague goal such as “do your best” may imply a high level of motivation, it is the ambiguity in goal specification that allows people more leniency when evaluating their own performance. Thus, a wide range of performance levels may be
considered acceptable. Mento, Cartledge, and Locke (1980) found that individuals with “do your best” goals expected more satisfaction from every level of anticipated performance than individuals with specific, difficult goals. It is also important to note that the only direct effect of goal specificity, when separated from goal difficulty is a reduction in performance
variance due to clarity of the meaning of a goal (Locke, Chah, Harrison, & Lustgarten, 1989). Goal Commitment
In order for the basic tenets of goal-setting theory, specificity and difficulty, to work, an individual must be committed to the goal and be provided with feedback regarding their progress toward the goal (Locke & Latham, 1990a). Goal commitment refers to one’s attachment or determination to reach a goal, regardless of where the goal came from. Thus the goal could be assigned, participatively set, or self-set. The determinants of goal
was stronger for difficult goals as opposed to easy goals. As such, the highest performance only comes about when both goal commitment and goal difficulty are high.
In sum, the level of specificity and difficulty of a goal, as well as an individual’s commitment to the goal, are critical determinants of the success of goal setting. Based on the research reviewed, difficult and specific goals lead to higher performance than easy, vague goals (Locke & Latham, 1990b) and higher commitment on these goals leads to even greater performance (Klein et al., 1999). Any one of these constructs alone will not have as great an impact on performance as all three constructs combined. Thus, in the present research, all three constructs will be assessed and multiplicatively combined, creating one score to represent the quality of an individual’s goal and will be referred to as goal quality. Hypothesis 1: Goal quality will be positively related to taking action on goals. Goal Orientation
and is concerned with the positive outcomes that arise from the completion of a task, whereas the latter is grounded in a fear of failure (Silver, Dwyer, & Alford, 2006). Behavioral
outcomes of the performance-avoiding orientation include avoiding challenging tasks, focusing on failure-relevant information, and procrastination. Individuals with a
performance-proving orientation are most interested in demonstrating their ability to others, thus working hard to complete the task. A learning goal orientation is less focused on the demonstration of ability and more interested in the intrinsic value associated with the task (Silver et al., 2006). This orientation is focused on developing one’s competency by
acquiring skills, mastering new situations, and learning from experience. An individual with a learning goal orientation may have a performance advantage over someone with a
performance goal orientation, due to their use of self-regulation strategies such as setting challenging goals. Those with a performance orientation are less concerned with mastery and more likely to set an easy goal, which they are confident they can accomplish
(VandeWalle et al., 1999). As an individual differences variable, goal orientation can provide further information regarding how individuals respond to feedback, including goal setting.
to performance. One explanation for the lack of significant findings regarding proving goal orientation is that these individuals tend to set goals that are less difficult than those with a learning goal orientation. This is due to the fact that individuals with a proving goal
orientation are more concerned with obtaining positive evaluations of their ability as opposed to developing their skills and abilities. Rather than risk failure with a difficult goal, they will set a lower goal that leads to lower overall performance. Heslin and Latham (2004)
examined the moderating effect of learning goal orientation on the relationship between feedback and performance. Although the relationship between learning goal orientation and performance was positive, there was no support for the moderating effects of learning goal orientation on the relationship between feedback and performance. However, the small sample size (n = 35) in this study may have contributed to the lack of significant findings. Based on the goal orientation research reviewed, a learning goal orientation has consistently exhibited a positive relationship with goal setting and performance. Therefore, the
hypothesis for goal orientation is as follows:
Hypothesis 2: Learning goal orientation will be positively related to goal quality. Personality
A variety of personality constructs have been related to goal setting and performance. Some authors have suggested that distal predictors, such as personality and general self-efficacy, affect performance through their influence on proximal self-regulatory mechanisms such as goal setting (Kanfer, 1990; Klein & Lee, 2006; Locke & Latham, 1990a).
(FFM) of personality (Costa & McCrae, 1992) provides the opportunity to clarify the link between personality, motivation, and performance.
With the classification of five relatively independent personality traits, researchers have been able to conduct systematic research leading to the accumulation of empirical support for the relationship between personality and performance. The FFM, also known as the Big Five, is comprised of the dimensions known as Conscientiousness, Emotional Stability, Extraversion, Agreeableness, and Openness to Experience (Goldberg, 1990). Conscientiousness is associated with dependability, the need for achievement, and good organizational skills. Individuals high on this trait are considered hardworking and persevering. Low Emotional Stability, also known as Neuroticism, is characteristic of individuals who are consistently anxious, depressed, angry, and insecure. Extraversion is found in individuals who are sociable, gregarious, talkative, and active. Those who score low on this scale are considered Introverted and tend to be reserved and more independent. The fourth dimension, Agreeableness, is associated with being courteous, flexible, compliant, and good-natured. Openness to Experience, the last factor, encompasses traits such as being imaginative, curious, and broad-minded.
Conscientiousness has also been linked to participating in developmental activities including aspects of goal setting following multisource feedback (Smither et al., 2005). Based on these findings the following hypotheses are proposed regarding the construct of Conscientiousness: Hypothesis 3a: Conscientiousness will be positively related to goal quality.
Hypothesis 3b: Conscientiousness will be positively related to taking action on a goal. Although less well-documented, Neuroticism has also been linked to goal-setting motivation. Malouff, Schutte, Bauer, and Mantelli (1990) found that individuals high in Neuroticism were less likely to be goal-oriented. Additionally, meta-analytic findings indicate that Neuroticism has a negative effect on the level of goals set by individuals (r = -.24), in that Neurotic individuals tend to set goals that are lower in difficulty (Judge & Ilies, 2002). The characteristics of fear, anxiety, and sadness that describe individuals who are high in Neuroticism may detract from their ability to focus on and follow through with a goal. These individuals may also perceive feedback regarding their performance as threatening and anxiety provoking (Smither et al., 2005). This may lead them to set lower goals and expend less effort to reach those goals. Based on these findings the following hypotheses are proposed regarding the role of Neuroticism:
Hypothesis 4a: Neuroticism will be negatively related to goal quality.
Hypothesis 4b: Neuroticism will be negatively related to taking action on a goal. General Self-Efficacy
state-like construct (e.g., Gist & Mitchell, 1992; Lee & Bobko, 1994), however, recently researchers have become interested in a more trait-like conceptualization of the construct termed general self-efficacy (e.g., Gardner & Pierce, 1998; Judge, Erez, & Bono, 1998). General self-efficacy has been defined as “an individual’s perception of their ability to perform across a variety of different situations” (Judge et al., 1998, p. 170). General self-efficacy is more resistant to transient influences than situational self-self-efficacy (Eden, 1988). The primary antecedent of general self-efficacy is the accumulation of previous life
experiences, both successes and failures across a variety of task domains (Chen, Gully, & Eden, 2001). Since the origins of general self-efficacy include experiences where task-specific self-efficacy is at work, it is likely that the effects of these two constructs on goal setting and performance are similar.
likely to engage in follow-up activities that included goal setting following multisource feedback (Atwater & Brett, 2005). In sum, this research provides evidence of the positive effects of both situation-specific and general self-efficacy on goal setting and performance. The present study will examine the impact of general self-efficacy, with the expectation that it will have a positive effect on goal quality and taking action.
Hypothesis 5a: General self-efficacy will be positively related to goal quality.
Hypothesis 5b: General self-efficacy will be positively related to taking action on goals. Taking Action
In order for performance to improve following feedback, an individual must take appropriate action on his or her goal. In the present context, taking action can include working with a coach, discussing one’s feedback with others, or participating in
In the present study, participants were encouraged to track progress toward their goals and seek support using an online goal-setting tool. The goals were displayed to fellow
program participants and their trainers. In addition, online coaches were available for questions and to provide encouragement. It is expected that participants who utilized this website would make progress toward their goals. For this research, taking action will be operationalized by additively combining the frequency of use of the goal-setting tool, the number of requests for coaching, and the number of individuals with whom a participant shared their feedback. As such, the following hypothesis is proposed:
Hypothesis 6: Taking action on a goal will be positively related to performance change. Section II: Method
Participants and Procedure
The participants in this study included managers who took part in a leadership development program between 2005 and 2006. This program uses self-awareness tools and activities to enhance participants’ leadership capabilities. Learning occurs through the use of self-reflection, group discussions, small-group activities, and personal coaching. The
training covers diverse topics including, but not limited to, giving and receiving feedback, building and maintaining relationships, and setting goals.
Invitations to participate in the current study and complete a follow-up survey were distributed via email to 745 managers. Two hundred and twenty-six individuals responded to the survey, resulting in a 30.3% response rate. An international, nonprofit leadership
development institution provided archival data for these managers on the California
utilizes retrospective change ratings. All leaders participating in the study are at the executive level of their organizations, with 67% of them being male and 84% being Caucasian. Most participants are from the United States (95%) and most (88%) speak English as their first language. Participants’ ages range from 25 to 59 years old, with a mean of 43 years.
Prior to participation in the program, each leader completed the CPI and received ratings on Benchmarks®, and Reflections®. These ratings included self-ratings and ratings made by the direct reports, peers, and bosses of each leader. Nine participants did not have complete data on these instruments and were removed from the study, bringing the number of participants to 217. A total of 2,293 individuals provided ratings on Benchmarks®. Of this total, 926 raters were direct reports, 915 raters were peers, 235 raters were bosses, and 217 were self-ratings made by the leaders. After receiving the feedback information based on Benchmarks®, the managers completed a goal-setting instrument. These goals were subsequently entered into an online goal tracking system known as Friday5s®. This is an Internet-based platform that prompts participants, via email, to update their goal progress during the ten weeks following the program. Three months following the completion of the program, performance ratings were collected for each manager using Reflections®. A total of 1,525 individuals provided ratings. Of this total, 701 raters were direct reports, 639 raters were peers, and 185 raters were bosses. At the time of the performance ratings, the majority of the participants had not completed their goal. Those who did complete their goal prior to the performance ratings indicated this on the goal-setting website.
A follow-up survey, assembled by this researcher, was administered to the
This survey included measures assessing goal difficulty, goal commitment, learning goal orientation, and general self-efficacy.
Measures
Characteristics of Feedback. The multisource feedback instrument used in this study, Benchmarks®, contains 21 scales and a total of 155 items. These scales focus on managerial skills and perspectives intended to assess the interpersonal skills of a manager (Lombardo & McCauley, 1994). The first 16 scales address leadership skills and perspectives, while the last 5 scales address problems that can stall a career. This study dealt with the first 16 scales which include: Resourcefulness, Doing Whatever it Takes, Being a Quick Study,
Decisiveness, Leading Employees, Confronting Problem Employees, Participative
Management, Change Management, Building and Mending Relationships, Compassion and Sensitivity, Straightforwardness and Composure, Balance Between Work and Personal Life, Self-Awareness, Putting People at Ease, Differences Matter, and Career Management. Previous research has found acceptable reliability and validity for these scales (Lombardo & McCauley, 1994). In the current study the coefficient alphas for the scales ranged from .76 to .91.
Ratings of the managers’ skills came from bosses, peers, direct reports, or themselves. Ratings were made on a 5-point Likert scale to reflect the degree to which an item is typical of the ratee’s behavior, with a score of 1 indicating “Not at all” and a score of 5 indicating “To a very great extent.” For the present research, feedback characteristics were
ICC(2) coefficients for the present scales ranged from .63 to .78., which is in line with other studies using similar multisource data (e.g., Atwater Ostroff, Yammarino, & Fleenor 1998; Fleenor, McCauley, & Brutus, 1996; LeBreton, Burgess, Kaiser, Atchley, & James, 2003).
Leader Personality. Leader personality was assessed with the California
Psychological Inventory (CPI), a 260-item, self-report personality inventory that measures behavioral tendencies in everyday terms that describe normal functioning in adults. Responses are made on each item by indicating if the statement is true or false for an individual. The CPI has enjoyed wide cross-cultural use and is a popular personality test used in employee selection (Hakstian, Farrell, & Tweed, 2002). Results from the CPI scales are often used to give feedback in leadership development programs (Fleenor & Eastman, 1997). Recent evidence suggests that the Five-Factor Model can be found in most
personality instruments (McCrae & John, 1992). In addition, the CPI has been empirically related to the five-factor model of personality (Fleenor, & Eastman, 1997; McCrae, Costa, & Piedmont, 1993), which can aid in the generalizability of the findings.
The scales utilized in this study were Self-Control, Good Impression, Achievement via Conformance, and Sensitivity (previously named Femininity/Masculinity). These scales were chosen due to their relationship with the individual differences constructs of interest in this study and their linkage to the five-factor model. The remaining CPI scales were not as strongly related to the personality constructs of this study. Through the use of factor analysis, the CPI scales of Self-Control, Good Impression, and Achievement via
selected for use in this research. The same research also revealed that the Sensitivity
(Femininity/Masculinity) scale from the CPI displayed a high factor loading on Neuroticism (.87). This was the only scale from the CPI that demonstrated a high factor loading on Neuroticism. Consequently it was the only scale used to represent Neuroticism in this research. An overall score for Conscientiousness was created by averaging the scale scores from the following three CPI scales: Self-Control, Good Impression, and Achievement via Conformance. The Sensitivity scale score was used as a measure of Neuroticism. Previous research reports reliabilities for these CPI scales ranging from .62 to .84 with a mean of .77 (CPP, 2002; Hattrup, 2003). KR-20 for the Conscientiousness scale in the current study was .79. The scale for Neuroticism had a lower reliability with a KR-20 estimate of .62.
Goal Orientation. Goal orientation was measured using a scale developed by VandeWalle (1997; see Appendix A). This measure consists of 13 items, which assess learning, proving, and avoiding goal orientations. For this study, only the 5 items related to learning goal orientation were assessed. The decision to use only 5 of the 13 items on this scale was due to the focus on learning goal orientation in the current study. In addition, there was a desire to keep the overall number of items in the follow-up survey to a minimum in order to increase the response rate. A 5-point Likert response scale, ranging from (1) strongly disagree to (5) strongly agree, was used for each item. Prior research reports
coefficient alphas ranging from .78 to .88 for this measure (Brett & VandeWalle, 1999). The internal consistency of the learning goal orientation scale in the current study was high ( α = .93).
items on this scale are intended to capture the differences among individuals in their tendency to view themselves as capable of meeting task demands across a variety of situations. This instrument consists of 8 items rated on a 5-point Likert-type scale from strongly disagree (1) to strongly agree (5). An example item is as follows, “I believe I can succeed at most any endeavor to which I set my mind.” For the purpose of the present research, the following item was deleted from the original scale, “I will be able to achieve most of the goals I have set for myself.” Since this study is directly assessing an individual’s performance on a goal, it was thought that this item may be perceived as too
situation-specific. Prior research has shown the NGSE to be a reliable measure of general self-efficacy, with coefficient alphas ranging from .85 to .90. In addition, the scale has exhibited
discriminant validity in relation to self-esteem measures and predictive validity in the case of exam specific self-efficacy (Chen et al., 2001). The coefficient alpha for this scale in the present study was .86.
a great deal. The internal consistency of these three items was acceptable, with a coefficient alpha of .80.
Goal Commitment. Goal commitment was measured using a 5-item instrument refined by Klein, Wesson, Hollenbeck, Wright, and DeShon (2001; see Appendix A). The response scale associated with these items is a 5-point Likert scale anchored by strongly disagree (1) to strongly agree (5). The scale contains negatively worded items that were reverse scored so that a high score indicated high goal commitment. Previous research has supported the scale’s construct validity, internal consistency (α = .84), and measurement equivalence across measurement timing and goal origin (Klein et al., 2001; Seijts, Latham, Tasa, & Latham, 2004). The internal consistency of this scale in the current study was somewhat low (α = .63).
Goal Specificity. Since the participants were instructed to set specific goals during their leadership development program, it seemed likely that obtaining a self-report of goal specificity would reflect demand characteristics. Therefore, goal specificity was rated using subject matter experts. The experts were two graduate students educated in the tenants of goal-setting theory. Similar to the research conducted by Smither et al. (2003), specificity was rated on a 5-point Likert scale ranging from (1) very vague to (5) very specific. The experts’ ratings were averaged to create a single specificity rating for each goal. Inter-rater reliability, which was calculated using the intraclass correlation coefficient ICC(1), was acceptable at .84.
Activities, Build Effective Teams, Build and Maintain Relationships, Career Development, Demonstrate Leadership, Develop Others, Improve Self-Awareness, Make Effective Decisions, Self-Improvement, Value and Leverage Differences/Diversity, and an “other” category. Once the goals were recorded on paper and categorized, they were entered into an online goal management system called Friday5s®. This is an Internet-based platform that prompted participants every other Friday via email for ten weeks following the program. These prompts asked participants to report the progress made on their goals, actions they had taken, and what they would do next as they worked toward their goal. Through this platform participants’ goals and their progress toward the goals were displayed to their cohort group from the program. In addition, participants were given the opportunity to request online coaching to help them as they worked towards their goals.
Information from the Friday5s® database was used to operationalize the construct of taking action. The frequencies of visits to the website and requests for online coaching were used as indicators of taking action on goals. In addition, a self-rated item from the
to standardized scores was as follows: S = ((O – L) / (H – L)) * 100 where S represents the standardized score, O is the observed frequency score, L is the lowest possible frequency score (0), and H is the number of weeks the goal was active. After the frequency scores were standardized they were converted back to a 5-point scale, where 100 = 5, 80 = 4, 60 = 3, 40 = 2, and 20 = 1.
Performance Change. The measure of performance change used in this study was Reflections®, a multisource feedback instrument that consists of 14 scales and 57 items that evaluate leadership competencies. The participant and their coworkers completed this instrument approximately 10 weeks after the leadership development program. The scales in this instrument include: Build and Maintain Relationships, Leverage Diversity, Build
Effective Teams, Develop Others, Give Feedback, Think Systematically, Work Across Organizational Boundaries, Make Effective Decisions, Increase Self-Awareness, Increase Self-Confidence, Balance Work and Non-Work Activities, Learn from Experience, Set and Achieve Goals, and Receive Feedback. The coefficient alphas for the scales utilized in this study ranged from .72 to .88. This instrument utilizes a retrospective pretest measure to assess experiences of leader behavior change. Raters are asked to provide a “before” rating that represents a leader’s behavior prior to the leadership development program and a “now” rating that reflects the leader’s behavior at the time of the assessment. Retrospective pretest measures have been shown to eliminate some instances of response shift bias and have been considered preferable for the evaluation of subjective experiences when compared with traditional pretest-posttest measures (Hill & Betz, 2005).
and a score of 9 indicating “Completely.” Ratings of the leaders’ performance came from bosses, direct reports, peers, and themselves. These rating sources were aggregated, with the exclusion of self-ratings, to create an overall measure of change for each scale. Behavior change was operationalized as the difference between the “before” and “now” ratings on each scale. The difference between the “before” and “now” ratings were calculated for each rater, creating a difference score. The difference scores were then averaged across raters for each scale, creating an overall difference score. ICC(2) was calculated for each scale to determine the agreement between raters. These coefficients ranged from .57 to .83. This finding is similar to other studies using comparable multisource data (e.g., Atwater Ostroff, Yammarino, & Fleenor 1998; Fleenor, McCauley, & Brutus, 1996; LeBreton, Burgess, Kaiser, Atchley, & James, 2003).
Analyses
Path Analysis. The hypotheses outlined in the proposed model were tested using path analysis with manifest variables. Figure 2 shows the proposed model that was tested. Table 1 provides a summary of the operationalization of each construct in the model. Goal
category, as indicated during goal setting, was used to determine which scale from Benchmarks® was used to represent feedback characteristics and which scale from
Reflections® was used to represent performance change. The category of a leader’s goal was linked to specific scales from both Benchmarks® and Reflections®. For example, a goal categorized as Building and Maintaining Relationships was linked to the Benchmarks® scale, Building and Mending Relationships, as well as the Build and Maintain Relationships scale from Reflections®. In other words, different performance criteria were used across
Because variables in the current study were operationalized differently for different individuals (i.e., depending on goal category) it was important that there be no systematic differences in goal quality, taking action, and performance change across goal categories or scales that correspond with specific categories. To evaluate whether mean differences did exist based on goal category, three separate ANOVAs were conducted. Each ANOVA examined whether or not significant differences were present in model’s endogenous variables including goal quality, taking action, and performance change based on goal category. If no significant differences were found then the test of the path model proceeded as explained above, with different performance criteria across participants. However, if significant differences were found in the analysis then post-hoc analyses were examined to determine which goal categories contributed to the mean differences. Once identified, the participants with goals in these categories were removed from the analysis.
The model was tested using the CALIS procedure available in the SAS System. This analysis uses the maximum likelihood method of parameter estimation and was performed on the variance-covariance matrix. It is important to note that in the use of path analysis with manifest variables each construct is measured with only one indicator variable. This analysis is based on the assumption that each indicator is a perfectly reliable measure of the variable. An error term is not modeled for the exogenous variables, thus the presence of error
decreases the fit of the model.
Root-mean-square-error of approximation (RMSEA) is an additional fit index for path models. Models whose RMSEA is less than or equal to .06 have good fit (Hu & Bentler, 1999). The model was also evaluated by examining the proportion of variance in the endogenous variables that is
accounted for by their direct antecedents, also known as R2. Larger values reflect a greater percent of variance accounted for by the predictor. In addition, the path coefficients of the model were reviewed. Non-significant paths were further examined to determine if they should be dropped from the model using the Wald test. Further modifications to the model were explored by reviewing the normalized residual matrix and the Lagrange multiplier test. Modifications made to the model were evaluated one at a time.
Section III. Results
All of the study variables were examined to determine if the sample data were drawn from a normally distributed population. According to the Shapiro-Wilks W test, the
Comparison of Means
As described previously, the values of the variables of both feedback characteristics and performance change were determined by the category of the goal selected by the participant. Prior to the inclusion of these variables in the analysis it was necessary to determine if there were any mean differences within the endogenous variable in the model due to the goal category identified. Mean differences may exist for a number of reasons. First of all, some goal categories, such as Self-Awareness, may be less observable to raters evaluating performance change than other categories. As a consequence, the ratee may receive a low performance score because others have had little chance to observe any change in behavior. Secondly, some goals may take longer to achieve than the allotted time of ten weeks. A goal categorized under Career Development may take many months or years to achieve. Thus, the performance ratings at the 3-month mark would be too soon to expect noticeable changes. Lastly, some goal categories may have benefited from extra training time during the development program, which led to more specific and actionable goals being set by participants. The specificity of these goals could contribute to goal achievement and higher performance ratings.
Table 2 presents the frequency of participants within each goal category, as well as the mean scores for goal quality, taking action and performance change. The category of Leveraging Differences/Diversity was not represented in the sample. The existence of mean differences based on goal category was tested using a one-way ANOVA, between-groups design. Goal quality, taking action, and performance change were the three variables
category in relation to performance change, F(8, 193) = 2.89; p < .01. No significant effects were observed for the taking action variable. Figure 3 provides a graphical display of the mean differences for all three variables. In order to determine which goal categories contributed to the significant mean differences for these variables, a post-hoc analysis was conducted.
Prior to the selection of a specific post-hoc analysis, a test of the homogeneity of variances was conducted for both goal quality and performance change using the Levene statistic. This test showed unequal variances among the goal categories for both goal quality and performance change. Since both the sample sizes and variances were unequal, the Games-Howell method was selected for post-hoc comparisons of the means. This method was suggested by Toothaker (1993) and is only recommended for groups with sample sizes greater than 5. Due to this restriction, the goal category of Career Development was removed from future analyses since the number of participants was equal to 5.
The post-hoc comparisons for goal quality with the eight remaining goal categories revealed significant mean differences between the category Make Effective Decisions and the two categories of Build and Maintain Relationships and Develop Others. For the variable of performance change, there was a significant mean difference between the goal categories of Build and Maintain Relationships and Self-Awareness. Based on these results, the
decision was made to remove the participants with goals connected to the categories of Make Effective Decisions and Self-Awareness. By removing these two categories and keeping the category Build and Maintain Relationships in the dataset, the maximum number of
restriction in range for the endogenous variable scores. This action, along with the removal of participants with goals related to Career Management, decreased the total sample size to 177.
Since the category Build and Maintain Relationships contained a large number of participants (n = 96) separate analyses were also conducted with only this goal category. This group of participants was named Sample 2. These results are reported alongside the findings from the full sample (Sample 1). This action was taken to address the concern that mixing different goal categories would influence the validity of the results.
Correlations
Descriptive statistics and intercorrelations among the variables for Sample 1 are presented in Table 4. Results for Sample 2 are presented in Table 5. Few significant correlations were observed for Sample 1. Hypothesis 2 was supported in that learning goal orientation was significantly related to goal quality (r = .17, p < .05). None of the remaining formal hypotheses was supported. In regard to research question 1, there was no relationship between feedback characteristics and goal quality. Unexpected positive relationships were observed between feedback characteristics and a number of other variables including, learning goal orientation, general self-efficacy, and performance change. Goal quality was also significantly related to performance change. The largest significant correlation was found between learning goal orientation and general self-efficacy (r = .56, p < .01).
Unlike Sample 1, goal quality was not significantly related to performance change. Thus, Sample 2 yielded fewer significant correlations than Sample 1.
Path Analysis
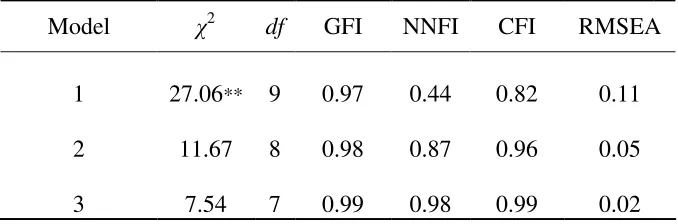
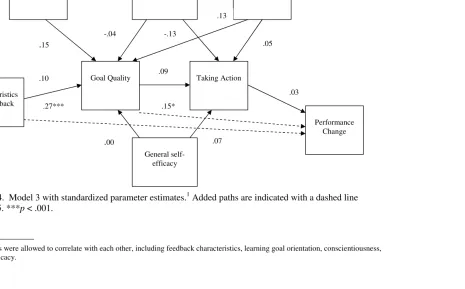
Goodness-of-fit indices for the proposed model (Model 1) are presented in Table 6 for Sample 1. Although the GFI was acceptable at .97, the NNFI and CFI were less than the required .90 and .95 cutoff (Hu & Bentler, 1999), indicating an inadequate fit. Also, the RMSEA exceeded the recommended cutoff of .06. The model chi-square value was also significant. These values led to the conclusion that model fit could be improved. The path estimates for Model 1 can be seen in Figure 4. The path estimates and fit indices for Sample 2 were closely aligned with the estimates yielded by Sample 1. An examination of these estimates revealed that all paths were non-significant. Since no remarkable differences were observed between the model estimates using Sample 1 and Sample 2, further modifications of the model were pursued using only the larger sample (Sample 1).
Next, the modification indices for Model 1were consulted to determine the presence of correlated error or cross-loading manifest variables. The Wald test did not identify any paths to be removed from the model. The Lagrange multiplier test (Bentler, 1989) suggested that the model could be significantly improved by adding a path from feedback
characteristics to performance change. Adding this path would be in line with previous research that has found a relationship between receiving negative feedback regarding
The goodness-of-fit statistics for Model 2 (Sample 1) are also presented in Table 6. A comparison of the chi-square statistic from Model 1 to the chi-square statistic for Model 2 revealed a significant improvement in the model fit with the additional path, ∆X 2 = 15.38 (8, N = 177) = 15.38, p < .01. The chi-square for Model 2 was not significant. Both the GFI and CFI were above .95 and the RMSEA was equal to .06. However, the NNFI was not above the recommended .90. The path coefficients for the model did not change in the revised model; however the added path was significant (β = .27, p < .001). A second examination of the Lagrange multiplier test revealed that a direct path from goal quality to performance change would also improve model fit. This suggested path can be supported theoretically based on prior research positively linking goal difficulty, specificity, and
commitment to improved performance (e.g., Hall et al., 1987; Klein et al., 1999; Mento et al., 1980). In order to improve the fit of the model a path was added between goal quality and performance change. The revised model was named Model 3.
Table 6 shows that the model chi-square for Model 3 was not significant. In addition, the GFI, CFI, and NNFI were all above .95 (Hu & Bentler, 1999) and the RMSEA was equal to .02. The revised model did improve fit by demonstrating a significant change in the model chi-square statistic, ∆X 2 (7, N = 177) = 4.13, p < .05. Path estimates did not change in significance from the previous model, however the new path between goal quality and
Both goal quality and taking action had R2 values of less than .05. Figure 4 shows the path estimates for Model 3.
Post Hoc Multiple Regression Analysis
The goal quality construct used in this research was made up of three separate measures: goal difficulty, goal specificity, and goal commitment. This study was the first to combine these components in a multiplicative fashion, with the assumption that all three aspects of goal quality were important to the construct and would be positively related. Since the prior analyses revealed unexpected, nonsignificant relationships between goal quality and the majority of the other variables in the model, further exploration of this construct was warranted.
Section IV: Discussion
The purpose of this research was to evaluate the viability of a variation of the model proposed by Smither et al. (2005), thereby establishing a link between multisource feedback, goal setting, and performance change. The model presented in this study brings together years of disjointed research surrounding multisource feedback in an attempt to move the field forward for both academicians and practitioners. A number of studies have linked personality constructs with both goal setting and performance change, which prompted their inclusion in the proposed model. In the present research, path analysis with manifest
variables was used to test the proposed relationships and to assess support for the model. The results of the path analysis provided limited support for the model proposed in this study. The initial model demonstrated inadequate fit to the data and none of the path estimates were significant. However, after consulting the modification indices supplied by the Lagrange multiplier test, two additional paths were added to the original model. These modifications improved the model fit and two significant path estimates were reported. It should be noted, however, that retesting the model with the same data after making modifications does capitalize on chance sample characteristics and can over-optimize the model for the sample. It is likely that the estimates for this model would display shrinkage in across-validation study.
significant path estimates. Thus, higher correlations may have provided a greater number of significant path estimates between the variables, but could have ultimately called the model into question. Ideally, a supported model should have both adequate fit and significant path estimates.
An examination of the bivariate correlations among the study variables revealed a number of variables to be significantly related. The largest correlation (r = .56) was between general self-efficacy and learning goal orientation. This finding is in line with a recent meta-analysis that reported a sample weighted mean correlation of .56 between these two variables (Payne, Youngcourt, & Beaubien, 2007). Learning goal orientation was significantly related to goal quality, however, none of the personality variables were significantly related to taking action. The expected relationships between personality and goal quality and taking action were not present in the sample data. One possible reason for the low observed correlations was the lack of normality in the data. The violation of the assumption of normality can increase the probability of a Type II error, thus, resulting in an underestimation of the
relationship between variables. Another potential reason for the weak relationships observed between the variables was the low reliability of the scales measuring Neuroticism and goal commitment. With coefficient alphas below .70, it is likely that measurement error
in this model are somewhat exploratory. Many of the direct relationships have been confirmed in previous research, but the model as a whole has not been tested prior to the current study. Variations of this model may exhibit more significant relationships and should be explored.
The correlations and path estimates did reveal that the variables of feedback characteristics and goal quality were positively related to performance change. In other words, the higher an individual overrated their initial performance, the greater their performance improvement. Also, the higher the quality of an individual’s goal, the more their performance improved. This supports previous research that did not make attempts to identify mediating variables between multisource feedback and performance change (e.g., Atwater et al., 1995; Hall et al., 1987; Johnson & Ferstl, 1999; Nemeroff & Consentino, 1979). The non-significant relationship between feedback characteristics and goal quality may have been due to the removal of reactions to feedback from Smither et al.’s (2005) original model. As previously mentioned, this variable was removed from the current study due to inconclusive research findings and the use of a training intervention with the
participants in this sample. Perhaps in a different context this variable should be included in the model.
Based on the follow-up analysis examining the three components of goal quality, the variable of goal difficulty was the strongest predictor of performance change. Goal
correlation between the two variables is that the goals were rated high in difficulty because they lacked specificity. An ambiguous goal could be considered difficult to execute because there is no detailed plan of action.
According to goal-setting theory, the presence of difficult and specific goals leads to higher performance, but in the present study goal difficulty was the only significant predictor of performance change. The observed mean score for specificity, 3.01, was lower than the observed mean score for difficulty (3.49). If the goals had been rated high on both specificity and difficulty, then a stronger relationship between goal setting and performance may have been observed. The lack of specificity found in the goals could have been due to inadequate training on this aspect of goal setting. Future interventions that utilize goal setting should take special care to address all aspects of theory. This study was the first known attempt to combine goal difficulty, specificity, and commitment in order to form the construct of goal quality. Although goal difficulty was the only significant predictor in this study, these findings should not deter researchers from continuing to explore the role of goal specificity and commitment as they relate to performance change.
Taking action was included as a mediator in the current study in order to expand upon known relationships and to investigate its role as a proximal antecedent of performance change. The lack of significant relationships with this variable indicates that it did not act as a mediator between goal setting and performance change for this sample. One reason for this finding can be linked back to the low specificity observed for the goals. Perhaps the
accountability relationships beyond the support offered by the website and the on-call coaches. One method for capturing this information would be to ask individuals to describe their efforts in a follow-up survey. The operationalization of this variable should be
expanded upon in future studies to identify the different actions that individuals employ to reach their goals.
Limitations and Future Research
One major limitation of this study was the use of retrospective self-ratings of goal difficulty, goal commitment, learning goal orientation, and general self-efficacy. Both goal orientation and general self-efficacy are considered stable individual differences variables; however each can be influenced by life experiences (Chen et al., 2001). Thus, it is unknown whether these measures truly reflect the traits as they existed at the time the goals were set by participants. Of greater concern is the validity of the participant ratings of goal difficulty and goal commitment. Both of these variables could be influenced by goal achievement. That is, goals that were achieved by the participants may have been perceived to be easier than goals that participants were unable to accomplish. Additionally, participants may not have been able to specifically recall how difficult they perceived the goal to be when it was conceived. Future research should seek to obtain ratings of these variables at the time the goal is set.
Beyond the limitations imposed upon this model due to the operationalizations of the variables, there are a number of other aspects of this study that may have affected the
variances found for the study variables are an indication of a rather high-scoring,
homogenous sample. Future research should make efforts to obtain a more representative sample of managers who do not receive a training intervention.
A second limitation of this study was that, in some cases, different individuals acted as raters for the initial feedback and subsequent performance change ratings. Consequently, it is unknown whether performance change was rated by the same individuals who provided negative or positive feedback to the participant. It is possible that the improvement in performance was simply a reflection of an individual with a different perspective of the participant. Ideally, the same individuals would provide ratings at both points in time. This would allow for not only the use of retrospective pretests, but also the comparison of actual pretest and posttest ratings. In order to facilitate this comparison, the same measures should be used to assess performance prior to and after setting the goal. A limitation of the current study was that different assessments were used to provide feedback and determine
performance change. However, these assessments were parallel in regard to the overall constructs that were assessed, which allowed for the alignment of feedback, goal category, and performance.
Another limitation of this research was the use of path analysis to evaluate the model instead of structural equation modeling. Path analysis was chosen in the current study because a number of the constructs were represented by a single indicator variable. Multiple indicators for each construct would have allowed for the evaluation of a measurement model of each construct prior to its inclusion in the full model. Measurement error would also have been accounted for in the exogenous variables. These analyses assure that the proposed constructs are being measured correctly, a safeguard that was not available in the present study.
The weak findings for the current model signal the need to explore additional
variables that influence the feedback-performance relationship. One alternative would be to add organizational-level variables to the model. London and Smither (2002) suggested that a strong feedback culture within an organization could increase the likelihood of individuals responding positively to feedback and taking action to change their behavior. One measure that can be used to evaluate an organization is the Feedback Environment Scale (FES) (Steelman, Levy & Snell, 2002), which assesses the extent to which an organization supports the use of feedback. The inclusion of organizational-level variables would aid our
understanding of how they enhance or limit the impact of receiving multisource feedback. Conclusion
the present findings give credence to the use of feedback to initiate performance change. More work is needed to determine exactly how these constructs are linked and if
organizational factors play a role in the feedback-performance relationship.
References
Atwater, L. E., & Brett, J. F. (2005). Antecedents and consequences of reactions to developmental 360° feedback. Journal of Vocational Behavior, 66, 532-548.
Atwater, L. E., Ostroff, C., Yammarino, F. J., & Fleenor, J. W. (1998). Self-other agreement: Does it really matter? Personnel Psychology, 51, 577-598.
Atwater, L. E., Roush, P., & Fischthal, A. (1995). The influence of upward feedback on self- and follower ratings of leadership. Personnel Psychology, 48, 35-60.
Atwater L. E., Waldman, D. A., Atwater, D., & Cartier, P. (2000). An upward feedback field experiment: Supervisors’ cynicism, reactions, and commitment to subordinates. Personnel Psychology, 53, 275-297.
Bandura, A. (1986). Social foundations of thought and action: A social-cognitive view. Englewood Cliffs, NJ: Prentice Hall.
Bandura, A. (1997). Self-efficacy: The exercise of control. New York: Freeman. Barrick, M. R., & Mount, M. K. (1991). The Big Five personality dimensions and job
performance: A meta-analysis. Personnel Psychology, 44, 1-26.
Barrick, M. R., Mount, M. K., & Strauss, J. P. (1993). Conscientiousness and performance of sales representatives: Test of the mediating effects of goal setting. Journal of Applied Psychology, 78, 715-722.
Bentler, P. M. (1989). EQS structural equations program manual. Los Angeles: BMDP Statistical Software.
Bono, J. E., & Colbert, A. E. (2005). Understanding responses to multi-source feedback: The role of core self-evaluations. Personnel Psychology, 58, 171-203.
Bryan, J. F., & Locke, E. A. (1967). Parkinson’s law as a goal-setting phenomenon. Organizational Behavior and Human Performance, 2, 258-275.
Brett, J. F., & VandeWalle, D. (1999). Goal orientation and goal content as predictors of performance in a training program. Journal of Applied Psychology, 84, 863-873. Cannon-Bowers, J., & Levine, E. L. (1988). Psychometric and motivational properties of
self-efficacy: Disentangling the complex web. University of South Florida, unpublished manuscript.
Carver, C. S., & Scheier, M. F. (1981). Attention and self-regulation: A control theory to human behavior. New York: Springer-Verlag.
Chen, G., Gully, S. M., Eden, D. (2001). Validation of a new general self-efficacy scale. Organizational Research Methods, 4, 62-83.
Chidester, T. R., & Grigsby, W. C. (1984). A meta-analysis of goal setting performance literature. Academy of Management Proceedings, 202-206.
CPP, Inc. (2002, February). Brief technical report on the Spectrum CPI 260 instrument (Tech. Rep. No. 2002-03). Palo Alto, CA: Author
Costa, P. T., Jr., & McCrae, R. R. (1992). Revised NEO Personality Inventory (NEO-PI-R) and NEO five-Factor Inventory (NEO-FFI) professional manual. Odessa, FL: PAR. Dweck, C. S. (1986). Motivational processes affecting learning. American Psychologist, 41,
1040-1048.
Fleenor, J. W., & Eastman, L. (1997). The relationship between the five-factor model of personality and the California Psychological Inventory. Educational and
Psychological Measurement, 57(4), 698-703.
Fleenor, J. W., McCauley, C. D., & Brutus, S. (1996). Self-other rating agreement and leader effectiveness. Leadership Quarterly, 7, 487-506.
Gardner, D. G., & Pierce, J. L. (1998). Self-esteem and self-efficacy within the organizational context. Group and Organization Management, 23, 43-70. Gist, M. E., & Mitchell, T. R. (1992). Self-efficacy: A theoretical analysis of its
determinants and malleability. Academy f Management Review, 17, 183-211. Goldberg, L. R. (1990). An alternative "description of personality": The Big-Five factor
structure. Journal of Personality and Social Psychology, 59, 1216-1229.
Gough, H. P., & Bradley, P. (1996). CPI Manual (3rd ed.). Palo Alto, CA: Consulting Psychologists Press.
Hall, H. K., Weinberg, R. S., & Jackson, A. (1987). Effects of goal specificity, goal difficulty, and information feedback on endurance performance. Journal of Sport Psychology, 9, 43-54.
Hakstian, A. R., Farrell, S., & Tweed, R. G. (2002). The assessment of counterproductive tendencies by means of the California Psychological Inventory. International Journal of Selection and Assessment, 10(1-2), 58-86.
Hattrup, K. (2003). California Psychological Inventory, Third Edition. In B. S. Plake, J. C. Impara, & R. A. Spies (Eds). The Fifteenth Mental Measurement Yearbook. Lincoln,