Plant development and harvest yields of greenhouse tomatoes in six organic growing systems
7
0
0
Full text
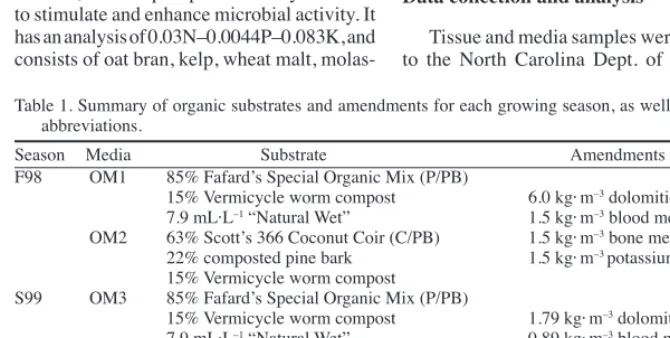
(2) FEATURE Organic substrates and fertilizers Organic substrates were tested with various amendments in each growing season. In F98, organic medium 1 (OM1) was 85% Fafardʼs Special Organic Mix (Fafard, Anderson, S.C.), a peat/pine bark (P/PB) commercial mix modified to omit the “starter nutrients” and the wetting agent, which are not allowed in organic production, and 15% by volume Vermicycle (Vermicycle Organics, Charlotte, N.C.) worm compost. Natural Wet (J.H. Biotech, Ventura, Calif.), an organically certified wetting agent, was added to this substrate at a rate of 2 tablespoons/gal, (1 fl oz/gal, 7.9 mL·L–1). OM2 contained a substrate (C/PB) of 63% Scottʼs 366 (Scotts, Marysville, Ohio) coconut coir and 22% composted pine bark to which 15% Vermicycle worm compost was added. All substrates were amended with dolomitic limestone. An initial nutrient charge was provided from blood meal, 12N–0P–0K; bone meal, 0N–4.84P–0K, and potassium sulfate (K2SO4), 0N–0P–41.5K. In S99, OM3 and OM4 consisted of the same substrates as OM1 and OM2, respectively but the amendments were reduced. In F99, the OM1 substrate was tested with (OM5) and without (OM6) the addition of Vermicycle. The nutritional amendments were unchanged from S99. However, due to high media pH in previous growing seasons, dolomitic limestone was omitted for this growing season and elemental sulfur (S) was used instead. OG media treatments and abbreviations are summarized in Table 1. Two liquid organic fertilizers were tested. Earth Juice [(EJ), Greenfire, Chico, Calif.] was available in five formulations, termed “Grow,” “Bloom,” “Catalyst,” “Micro-Burst,” and “Meta-K.” “Grow” has an analysis of 2N–0.44P–0.83K, and is comprised of bat guano, Norwegian sea kelp, natural sulfate of potash, feather meal, oat bran, blood meal, and steamed bone meal. “Bloom” has an analysis of 0N–1.3P–0.83K and contains bat guano, Chilean seabird guano, Norwegian sea kelp, natural sulfate of potash, steamed bone meal, oat bran, and rock phosphate. “Catalyst” is used to stimulate and enhance microbial activity. It has an analysis of 0.03N–0.0044P–0.083K, and consists of oat bran, kelp, wheat malt, molas-. ses, and yeast. “Micro-Burst” supplies 5% Mg, 0.02% boron (B), 0.05% copper (Cu), 0.2% iron (Fe), 0.1% manganese (Mn), and 0.15% zinc (Zn), and is derived from kelp meal, MgSO4, borax, CuSO4, FeSO4, MnSO4, and ZnSO4. “Meta-K” contains 10% K from seaweed. The other OG fertilizer was Magna Gro [(MG), Magna Gro, Lawrence, Kans.]. MG is available in several formulations. “Hydroponic Base Mix” has an analysis of 2N–1.3P–5K, and is comprised of poultry compost tea, pasteurized blood meal, calcium phosphate [Ca(H2PO4)2], and seaweed. This also contains trace minerals with fermented molasses in the form of Mg SO4, Zn SO4, and Fe SO4. The level of nitrogen (N) was supplemented with 19% N from poultry compost tea and pasteurized blood meal. Levels of K were supplemented with K-9, which is 7.47% K from seaweed. Organic forms of trace minerals as 6% B, 6% Fe, 6% Mg, and 6% Ca were also available in MG products. Conventional substrates and fertilizers Tomatoes were grown conventionally in each growing season to represent typical greenhouse production. Fertilization and substrate practices in CV followed guidelines for “bag culture” of tomatoes as described by Carpenter (1982). For all growing seasons, the conventional growing medium was Southlandʼs SI-1 (Southland, Greensboro, N.C.), a peat/perlite/vermiculite blend containing a “starter” nutrient charge to which composted pine bark was added at a rate of 50% by volume. For each growing season, the CV substrate was amended with the same amount of limestone as was added to the organic substrate. The CV fertilizer used was “Chem-Gro” (HydroGardens, Colorado Springs, Colo.), supplemented with Ca(NO3)2, CaCl2, KNO3, and MgSO4. All fertilizers were formulated to provide 90N–45P–195K for stage 1; 125N– 45P–195K for stage 2; and 165N–45P–310K for stage 3 (Abbott et al., 1986). Table 2 lists the fertilizer formulations used in all treatments. Data collection and analysis Tissue and media samples were submitted to the North Carolina Dept. of Agriculture. Table 1. Summary of organic substrates and amendments for each growing season, as well as treatment abbreviations. Season F98. Media OM1 OM2. S99. OM3 OM4. F99. OM5 OM6. 224. Apr04HortScience.indb 224. Substrate 85% Fafardʼs Special Organic Mix (P/PB) 15% Vermicycle worm compost 7.9 mL·L–1 “Natural Wet” 63% Scottʼs 366 Coconut Coir (C/PB) 22% composted pine bark 15% Vermicycle worm compost 85% Fafardʼs Special Organic Mix (P/PB) 15% Vermicycle worm compost 7.9 mL·L–1 “Natural Wet” 63% Scottʼs 366 Coconut Coir (C/PB) 22% composted pine bark 15% Vermicycle worm compost 85% Fafardʼs Special Organic Mix (P/PB) 15% Vermicycle worm compost 7.9 mL·L–1 “Natural Wet” 100% Fafardʼs Special Organic Mix (P/PB) 7.9 mL·L–1 “Natural Wet”. Amendments 6.0 kg· m–3 dolomitic limestone 1.5 kg· m–3 blood meal 1.5 kg· m–3 bone meal 1.5 kg· m–3 potassium sulfate 1.79 kg· m–3 dolomitic limestone 0.89 kg· m–3 blood meal 0.89 kg· m–3 bone meal 0.89 kg· m–3 potassium sulfate 0.3 kg· m–3 elemental sulfur 0.89 kg· m–3 blood meal 0.89 kg· m–3 bone meal 0.89 kg· m–3 potassium sulfate. (NCDA) to monitor the nutritional status of the plants throughout the growing seasons. Tissue samples were collected by removing the fifth fully expanded leaf from the tops of eight plants from each treatment. Media samples were collected by thoroughly mixing media cores from eight grow bags in each treatment. Samples were collected at three times each season, ≈4, 8, and 12 weeks after transplant. Additionally, pour-through medium extractions were conducted using a modified Virginia Tech Extraction Method (VTEM) procedure (Wright, 1986) to provide an immediate, on-site assessment. The VTEM procedure was modified to accommodate the growth habit of greenhouse tomatoes. All plants were set in saucers on concrete blocks. A hole was made in each saucer. The grow bags were completely saturated by watering from the top. When the solution stopped dripping out of the bottom, the plants were fertigated. Thirty minutes after fertigation, 0.95 L (1 qt) of water was poured onto the surface of the growing medium. A container was placed under the holes in the saucers to catch the leachate, which was then measured for pH (pHep pH meter, Hanna Instruments, Woonsocket, R.I.) and electrical conductivity (EC) (DiST WP4 EC meter, Hanna Instruments). Fig. 1 depicts the modified pour-through system. The rate of plant development was measured by the number of days from seeding to the appearance of the first fully reflexed flower, one of the flowering response criteria described by Picken et al. (1985). Plant development data were collected on the first six clusters of all plants. Harvest yields were determined by the weight per plant of total harvested fruit and No.1 quality fruit only, as well as the percentage of No.1 quality fruit harvested for each greenhouse. Marketable fruit (No. 1) were those that were >180 g (6.35 oz.) and without visible defects. Due to incomplete data for the initial harvest of F98, analyses of harvest parameters were based on data collected on all tomatoes from the second through fourth cluster for each greenhouse and growing season. It was possible to compare OG fertilizers among growing seasons and OG fertilizer × media interactions within seasons using a combined analysis. This analysis was conducted on nutritional status of tissue, media solution pH and EC, plant development, and harvest yields using GLM (SAS Institute, Cary, N.C.). Within season data means and standard error bars are reported for each system. Error bars reflect within system and within season variation and should not be used to compare the OG and CV systems. Reported effects of OG vs. CV growing systems are qualitative observations. Results and Discussion Pour-through media extraction Media solution pH. Media solution pH values are depicted in Fig. 2. In F98 and S99, there was a significant effect of OG grow-. HORTSCIENCE, VOL. 39(2), APRIL 2004. 3/25/04 10:58:24 AM.
(3) Table 2. Fertilizer rates and formulas for all treatments. Fertilizer Chem-Groz. Stage 1 324.8 g (11.46 oz) 4–18–38 211.4 g (7.46 oz) Ca(NO3)2 113.4 g (4.00 oz) CaCl2 16.0 g (0.56 oz) KNO3 249.5 g (8.8 oz) MgSO4 y Earth Juice 354 mL (12 fl oz) Grow 354 mL (12 fl oz) Catalyst 158 mL (5.33 fl oz) Bloom 118 mL (4 fl oz) 10% K --Magna Gro Recipesx 1 L (34 fl oz) HBMw 7 mL (0.25 fl oz) 19% N 59 mL (2 fl oz) 9% K2O z For 1 gal of stock injected at a rate of 1:100. y For 1 gal of stock injected at a rate of 1:20. x For 1 gal of stock injected at a rate of 1:70. w Hydroponic Base Mix.. ing media on the media pH (P = 0.0002). In both seasons, the media containing the P/PB substrate resulted in higher pH than the media containing C/PB, even though C/PB has a near-neutral pH and peat moss and pine bark blends are generally acidic. However, the commercial mix used for the P/PB substrate had been pH corrected by the manufacturer which led to a higher pH in these media than in the C/PB media. In F99, media containing worm compost had lower pH than media without compost. There were no significant differences. Stage 2 324.8 g (11.46 oz) 4–18–38 336.6 g (11.87 oz) Ca(NO3)2 113.4 g (4.00 oz) CaCl2 16.0 g (0.56 oz) KNO3 249.5 g (8.8 oz) MgSO4 473 mL (16 fl oz) Grow 473 mL (16 fl oz) Catalyst 118 mL (4 fl oz) Bloom 118 mL (4 fl oz) 10% K 118 mL (4 fl oz) Microburst 1 L (34 fl oz) HBM 79 mL (2.67 fl oz) 19% N 59 mL (2 fl oz) 9% K2O. between the two OG fertilizers on growing media pH (P = 0.6564). In the CV system, medium pH was above the optimal range in F98. In S99 it was within range and in F99, pH was very low, ranging from 4.8–5.2 (Fig. 2). In an effort to keep the OG and CV growing systems as similar as possible, media were amended with the same amounts of dolomitic limestone for all treatments. Since media pH was detrimentally high in the OG treatments in F98, the amount of dolomitic limestone amendment was reduced. Fig. 1. (a) Modified Virginia Tech Extraction Method (VTEM) pour-through medium extraction system— side view. (b) Modified VTEM pour-through system—tray and catch cup.. HORTSCIENCE, VOL. 39(2), APRIL 2004. Apr04HortScience.indb 225. Stage 3 324.8 g (11.46 oz) 4–18–38 352.9 g (12.45 oz) Ca(NO3)2 58.1 g (2.05 oz) CaCl2 235.9 g (8.32 oz) KNO3 249.5 g (8.8 oz) MgSO4 708 mL (24 fl oz) Grow 708 mL (24 fl oz) Catalyst 59 mL (2 fl oz) Bloom 236 mL (8 fl oz) 10% K 118 mL (4 fl oz) Microburst 1 L (34 fl oz) HBM 236 mL (8 fl oz) 19% N 473 mL (16 fl oz) 9% K2O. in S99 and omitted in F99. Since CV utilized acidic peat-based media and fertilizers, the omission of limestone in F99 resulted in excessively low pH for this system. In all growing seasons, the media solution pH was higher in OG than CV (Fig. 2). This result was considered to be unusual since organic fertilizers tend to contain a higher percentage of ammoniacal-N (NH4+-N) than conventional fertilizers. As plants take up NH4+-N, they exude hydrogen (H+) ions to maintain an electrical gradient within the roots. Additionally, the microbial process of nitrification, in which NH4+ is converted to nitrate (NO3–), results in the release of H+ ions. The abundance of H+ in the rhizosphere was expected to lower the pH. Other researchers and growers who have worked with OG systems have also noticed increased substrate pH when using carbon-based (P.V. Nelson, unpublished data) or organic (Biernbaum, 1998, personal communication) fertilizers. Soil H+ binds with ammonia (NH3) released from organic matter and forms ammonium ions (NH4+). If this were the case, then organic substances could be less acidifying than inorganic substances with equivalent reduced N (Nelson, 2000). From these results, it seems possible that substrate pH management is more critical for CV than OG systems. OG substrate pH was very high in S99 when the greatest harvest yields were produced. It was also high in F98 when low yields resulted. Interestingly, in F99, OG substrate was within the recommended range, but this season also resulted in low yields. CV harvest yields responded to substrate pH in accordance with generally understood pH management principles. When CV substrate pH levels were outside the range for optimum plant development (high in F98, low in F99), CV yields were correspondingly low. Likewise, CV yields were the highest when pH was within the optimal range (S99), Conversely, in this growing season, when OG pH was the highest, three of the four OG treatments produced greater harvest yields than CV, which were the same as those for the fourth OG treatment. Media solution EC. At ≈4 weeks (Fig. 3), EC was higher in OG than CV from transplanting to the 4-week sampling in all seasons. After that. 225. 3/25/04 10:58:33 AM.
(4) FEATURE. Fig. 2. Average media solution pH measured by a modified Virginia Tech Extraction Method (VTEM) pour-through media extraction procedure. EJ = Earth Juice; MG = Magna Gro; CV = conventional; and OM1, OM2, OM3, OM4, OM5, or OM6 = Organic Growing Medium 1, 2, 3, 4, 5, or 6.. period, EC levels were comparable among all treatments for the remainder of each growing season. It seems that the differences were due to the OG nutrient amendments that were added to the substrates. Neither OG fertilizers nor OG media resulted in significant differences in media solution EC (P = 0.0603 and P = 0.5325, respectively). Additionally, there were no significant fertilizer × media interactions (P = 0.8488). Nutritional status Table 3 lists the treatment means and analysis of variance (ANOVA) results of tissue analysis on samples of the fifth fully expanded leaf from the tops of eight plants per treatment. Data for N, P, K, Ca, and Mg from the middle of each growing season are reported. There were significant differences among growing seasons on levels of all elements analyzed except Ca and Mg. In F99, tissue levels of N, P, and K were significantly higher than those from other seasons. In F99, OG media pH was maintained within the optimal range for tomato plant growth of 5.5–6.8 (Maynard and Hochmuth, 1997). This is the range in which macronutrients are most readily available for plant uptake. In the previous growing seasons, OG media pH was above this range, causing most macronutrients to be less available for uptake (Maynard and Hochmuth, 1997). Effects of organic growing media. There were no significant effects of OG growing. 226. Apr04HortScience.indb 226. media on the tissue levels of any of the nutrients except Mg. In F98 and S99, plants grown in the media containing C/PB had lower levels of Mg than plants grown in the media containing the P/PB substrate. In these two growing seasons, both substrates were amended with equal amounts of dolomitic limestone. However, the media containing the commercial mix used for the P/PB substrate already contained dolomitic limestone to adjust for pH. Dolomitic limestone is a good source of Mg so it is probable that the difference in tissue levels of Mg were a result of the additional limestone in the growing media. Effects of organic fertilizers. OG fertilizers had no significant effects on the nutritional status of the leaf tissue. Likewise, there were no significant OG fertilizer × media interactions. Nitrogen (Table 3). In F98, plants that received MG had generally lower levels of N in leaf tissue than plants fertilized with EJ or CV. In F98 and S99, there was a trend for plants in the OG system to have the highest levels of N in tissue at the mid-season sampling (data not shown). It is possible that by then, nitrifying bacteria had converted some of the NH4+-N that is prevalent in OG nutrients into the more readily useable NO3– -N. During these periods, plants in the OG system had tissue levels of N that approximated those recommended by the NCDA. Plants grown in the CV system consistently had N levels in tissue that were equivalent to recommended levels. Phosphorous (Table 3). There was little difference among treatments in the levels of P in. leaf tissue. Generally, these levels were higher than recommended amounts. Media pH was near-neutral in both the OG and CV systems in F98 and S99 (Fig. 2). This condition allows P to be more available to plants than it is when pH is in the more acidic range that is optimal for the growth of most plants (Maynard and Hochmuth, 1997). Potassium (Table 3). Tissue levels of K were greater in CV than OG for F98 and S99. In F99, K levels were similar in all treatments. Leaf tissue levels of K were lower than the recommended levels in all treatments and for all growing seasons. This result was unexpected since this was one of the nutrients upon which calculations for all the fertilizer formulations were based. It is possible that there was competition with other cations such as Ca for binding sites in the growing media, and K was leached out. Calcium (Table 3). Tissue levels of Ca were higher in OG treatments containing the P/PB substrate than those using the C/PB substrate. This was most likely a reflection of the amount of dolomitic limestone, a source of Ca, which was in the growing medium (see discussion of Mg above). Levels of Ca were generally lower in the plants grown in the OG as opposed to the CV systems. In all cases, tissue Ca was within the range of recommended values. Plant development Effects of organic fertilizers and media. Table 4 lists data means for the OG and CV. HORTSCIENCE, VOL. 39(2), APRIL 2004. 3/25/04 10:58:39 AM.
(5) Fig. 3. Average media solution EC measured by a modified Virginia Tech Extraction Method (VTEM) pour-through media extraction procedure. EJ = Earth Juice; MG = Magna Gro; CV = conventional; and OM1, OM2, OM3, OM4, OM5, or OM6 = Organic Growing Medium 1, 2, 3, 4, 5, or 6.. treatments, as well as OG treatment ANOVA results for the number of days from seeding to the first fully reflexed flower on each of the first six clusters. There were no significant OG fertilizer or medium effects. Likewise, the OG fertilizer × media interactions were nonsignificant. System effects. Differences were negligible between OG and CV systems on the number of days from seeding to flower (Table 4). In F98, CV plants set flowers on the first two clusters. sooner than the organically grown plants, but this trend was reversed by the time flowers were set on the last two clusters. In S99, OG plants set flowers on the second and third clusters sooner than conventionally grown plants, but again, this trend was reversed for the sixth cluster. In F99, CV and OG plants set flowers on the first two clusters in the same amount of time, however, for each successive cluster, the CV plants produced flowers earlier than the OG plants.. Table 3. Organic (OG) and conventional (CV) treatment means, and OG treatment analysis of variance (ANOVA) results of the North Carolina Dept. of Agriculture (NCDA) tissue analysis of macronutrients from the mid-season sampling for each growing season. NCDA recommended values are included. Season F98. S99. F99. NCDA Rec. Season (S) Fertilizer (F) S×F Media (season) F × Media (season). Nutrients in leaves (%) N P K Ca 4.655 0.520 3.455 1.685 4.855 0.530 2.955 1.455 3.955 0.635 2.485 1.845 3.765 0.585 2.305 1.580 4.890 0.468 3.970 1.575 4.010 0.515 3.245 1.700 4.850 0.600 3.510 1.825 4.895 0.655 3.580 1.340 5.185 0.655 3.440 1.175 4.973 0.598 4.533 2.278 5.480 0.940 5.005 1.865 5.630 0.735 5.560 1.420 6.440 0.880 6.010 1.790 6.780 1.015 5.820 1.380 6.368 0.975 5.755 2.398 4.0–5.5 0.3–1.0 4.7 1.5 ANOVA P-values < 0.0001 0.0037 < 0.0001 0.0660 0.2569 0.1416 0.9331 0.2334 0.0932 0.6513 0.3227 0.9714 0.9798 0.8527 0.9855 0.3277 0.9997 0.4611 0.9984 0.9111. Treatment EJ1 (P/PB) EJ2 (C/PB) MG1 (P/PB) MG2 (C/PB) CV EJ3 (P/PB) EJ4 (C/PB) MG3 (P/PB) MG4 (C/PB) CV EJ5 (w/compost) EJ6 (w/o compost) MG5 (w/compost) MG6 (w/o compost) CV. HORTSCIENCE, VOL. 39(2), APRIL 2004. Apr04HortScience.indb 227. Mg 0.390 0.365 0.480 0.350 0.415 0.425 0.370 0.370 0.305 0.433 0.510 0.555 0.485 0.580 0.530 0.500 0.7695 0.9731 0.7173 0.0197 0.9582. Harvest yields Effects of organic fertilizers. Organic fertilizers did not significantly affect total yield (P = 0.3335), yield of No.1 fruit (P = 0.3046), or percentage of No. 1 fruit (P = 0.3574) according to the ANOVA (SAS Institute, Cary, N.C.) (Fig. 4). Within seasons, there were no significant differences between OG fertilizers for any of the harvest parameters measured. However, higher total yields and yields of No. 1 fruit from plants grown with EJ than with MG were observed in F98, while higher yields from MG were observed in S99 and F99 (Fig. 4). This could be attributed to the difficulty in delivering soluble organic fertilizers due to repeated clogging of the fertigation emitters. When emitters became clogged, plants were not receiving an adequate supply of nutrients. Analysis of leaf tissue samples revealed lower amounts of N in plants fertilized with MG in F98 and EJ in S99 (Table 3). Later in each season, the problem of clogging was partially overcome by keeping the concentrate stirred, flushing out the irrigation lines weekly, and checking emitters frequently for clogging. Other strategies to deal with the high particulate content could include using emitters with high flow rates, e.g., 7.6 L·h–1 (2.0 gal/h) instead of 1.89 L·h–1 (0.5 gal/h), and adjusting dilution ratios in the injectors to feed a less concentrated fertilizer solution. Effects of organic media. Differences in total yield, yield of No. 1 fruit, and percentage of No. 1 fruit were nonsignificant (P = 0.7404, P = 0.4327, and P = 0.7198, respectively) among media treatments within any growing season. There were no significant fertilizer ×. 227. 3/25/04 10:58:45 AM.
(6) FEATURE Table 4. Organic (OG) and conventional (CV) treatment means, and OG treatment analysis of variance (ANOVA) results from the number of days from seeding to the first, fully reflexed flower on the first through the sixth clusters for each growing season. Cluster numberz Season Treatment 1 2 3 4 5 6 F98 EJ1 47 55 61 66 72 80 EJ2 46 55 60 65 71 82 MG1 45 54 61 66 71 80 MG2 44 54 61 66 72 80 CV 44 52 61 66 73 83 S99 EJ3 59 67 73 80 87 98 EJ4 60 67 73 81 89 99 MG3 60 68 74 81 89 97 MG4 60 68 74 82 89 97 CV 60 69 76 81 89 93 F99 EJ5 51 61 69 77 84 92 EJ6 49 61 69 78 85 92 MG5 49 59 68 76 83 90 MG6 51 62 71 79 86 93 CV 51 61 68 75 82 90 ANOVA P-values Season (S) <0.0001 <0.0001 <0.0001 <0.0001 <0.0001 <0.0001 Fertilizer (F) 0.6102 0.6327 0.2999 0.3705 0.5967 0.0778 S×F 0.1384 0.4918 0.6772 0.6698 0.6400 0.8772 Media (season) 0.6911 0.4645 0.2668 0.4282 0.3636 0.6406 F × Media (season) 0.1850 0.4880 0.6104 0.7832 0.7974 0.6420 z Clusters are numbered in order of appearance on the plant (i.e., from the growing medium to the top of the plant.. media interactions for total yield (P = 0.3166), yield of No. 1 fruit (P = 0.6665), or percentage of No. 1 fruit (P = 0.7898). Although the differences were nonsignificant, it was observed that the organic media containing the P/PB substrate tended to produce higher total yields and yields of No. 1 fruit than media containing the C/PB substrate in F98 and S99 (Fig. 4). Systems effects. Figs. 4 and 5 are based on the average weight (kg) per plant for all treatments. In F98, total yields as well as yields of No. 1 fruit were higher in all OG treatments than in CV. The same was true in S99 with the exception that EJ plus C/PB produced slightly lower total and No. 1 yields than CV. However, the percentage of No. 1 fruit was comparable in both systems for these two growing seasons. Although total harvest yields were similar between OG and CV in F99, the percentage of No. 1 fruit was much lower in CV than OG. Likewise, the yield of No. 1 fruit for this season was higher in three of the four OG treatments than CV, which produced the same results as those from the EJ/without compost treatment. In this growing season, most of the CV fruit were very small. This phenomenon was most likely due to the exceptionally low substrate pH in this growing system. Conclusions. Fig. 4. Harvest yields of total fruit and No. 1 fruit. Total weight per plant (kg) from the second through fourth clusters. EJ = Earth Juice; MG = Magna Gro; and CV = conventional; OM1, OM2, OM3, OM4, OM5, or OM6 = Organic Growing Medium 1, 2, 3, 4, 5, or 6.. 228. Apr04HortScience.indb 228. In this study, there were no significant differences among the OG treatments for any of the criteria used to measure plant growth and development. The variations in the nutritional status of the plants that did occur were largely attributed to either the actual amounts of nutrients added, in the case of Ca and Mg, or the pH level of the media. These data suggest that media pH plays a greater role in nutrient availability, and consequently plant growth and harvest yields, in CV systems than it does in OG systems. EC measurements were exceptionally high in the OG system for about the first 4 weeks after transplant, followed by EC levels in the OG system that were comparable to those in the CV system for the remainder of each growing season. The OG media were mixed within 1 week of transplanting. These findings suggest that OG media might be more stable if they were allowed to stand for ≈4 weeks after mixing in order to achieve equilibrium. As with any system, growers need to modify standard practices to fit their own situation. There were only a few management practices that differed between the OG and CV systems. In the OG system, it was necessary to mix soluble fertilizers on a weekly basis and to keep the fertilizer stock tank agitated. It was also beneficial to flush the irrigation lines weekly with water, and to check the emitters regularly. Since organic and conventional growing systems are inherently different, it was impossible to control experiments for all but one variable. Nevertheless, when the growing systems are considered as a whole, our experience suggests that greenhouse tomatoes produced organically are comparable to those produced. HORTSCIENCE, VOL. 39(2), APRIL 2004. 3/25/04 10:58:50 AM.
(7) Fig. 5. Percentage of No. 1 fruit from the second through fourth clusters. EJ = Earth Juice; MG = Magna Gro; and CV = conventional; OM1, OM2, OM3, OM4, OM5, or OM6 = Organic Growing Medium 1, 2, 3, 4, 5, or 6.. conventionally in regards to nutritional status, plant development, and harvest yields. Literature Cited Abbott, J.D., M.M. Peet, D.H. Willits, and R.E. Gough. 1985. Water management of greenhouse. HORTSCIENCE, VOL. 39(2), APRIL 2004. Apr04HortScience.indb 229. tomatoes. HortScience 20(4):688–690. Carpenter, T.D. 1982. Analyzing and managing nutrition of vegetables grown in upright polyethylene bags. J. Plant Nutr. 5:1083–1089. Dimitri, C. and N.J. Richman. 2000. Organic Foods: Niche marketers venture into the mainstream. p. 11–15. Agr. Outlook. AGO-272.. Drews, M. and B. Rennert. 1992. Investigations on the combination of intensive fish farming and NFT procedure in growing cucumber and tomatoes in greenhouses. Gartenbauwissenschaft 57:44–48. Estes, E., T. Kleese, L. Lauffer, D. Treadwell, and R. Burton. 1999. An overview of the North Carolina organic industry. ARE Rpt. No. 17, N.C. Agr. Res. Serv., N.C. State Univ., Raleigh. Flynn, R.P. C.W. Wood, and E.A. Guertal. 1995. Lettuce response to composted broiler litter as a potting substrate component. J. Amer. Soc. Hort. Sci. 120:964–970. Greene, C. 2000. U.S. Organic agriculture gaining ground. Agr. Outlook, Apr. 2000, ERSAO-270. Can be accessed as pdf. <www.usda.gov/publications/agoutlook/apr2000/>. Greene, C.R. 2001. U.S. organic farming emerges in the 1990s: Adoption of certified systems. Agr. Info. Bul.: ERSAIB770. Greene, C., C. Dimitri, and N. Richman. 2001. Organic marketing features fresh foods and direct exchange, p. 31-37. Food Rev. No. 24-1. Grubinger, V.P. 1999. Sustainable vegetable production from start-up to market. NRAES-104. NRAES, Ithaca, N.Y. p. 229. Ingram, E.R. and M. Alms. 1999. Compost tea manual 1.1. Soil Foodweb. Growing Solution, Eugene, Ore. Copies obtainable from Organic Farming Res. Fdn., Santa Cruz, Calif. telephone 831-426-6670. Kraus, H.T., R.L. Mikkelsen, and S.L Warren. 2000. Container substrate temperatures affect mineralization of composts. HortScience 35:16–18. Kraus, H.T. and S.L. Warren. 2000. Performance of turkey litter compost as a slow-release fertilizer in containerized plant production. HortScience 35:19–21. Lampkin, Nicolas. 1990. Organic farming, p. 1. Ipswich Farming Press, Bridlington, U.K. Maynard, D.N. and G.J. Hochmuth. 1997. Knottʼs handbook for vegetable growers. 4th ed. Wiley, New York. p. 136, 138–139. Smith, M. 1994. The real dirt. Farmers tell about organic and low-input practices in the northeast, p 116. Northeast Organic Farming Assn., Burlington, Vt. Tyler, H.H., S.L. Warren, T.E. Bilderback, and W.C. Fonteno. 1993a. Composted turkey litter. I. Effect on chemical and physical properties of a pine bark substrate. J. Environ. Hort. 11:131–136. Tyler, H.H., S.L. Warren, T.E. Bilderback, and K.B. Perry. 1993b. Composted turkey litter. II. Effect on plant growth. J. Environ. Hort. 11:137–141. Uri, N.D. 1999. Agriculture and the environment. p.1. Nova Science Publishers. Commack, N.Y. Wright, R.D. 1986. The pour-through nutrient extraction method procedure. HortScience 21:227–229.. 229. 3/25/04 10:58:56 AM.
(8)
Figure


+3


Related documents
Figure 37: Boiling point curves and water phase diagrams and with relation to MH and zones of mineralization and fluid inclusion measurements; A-Hydrostatic and lithostatic
8) Building integration – Utilizing an integrated system design approach with the building and utility systems at the outset of the project to ensure the buildings mechanical
In the BA program, you must complete 42 credit hours in art, a satisfactory senior comprehensive, an advanced writing portfolio and participate in portfolio
In the presence of a high pH (alkalaemia):- a low PaCO 2 implies a primary respiratory alkalosis - a high PaCO 2 implies respiratory compensation for a primary metabolic alkalosis.
Note: Column 1 lists the models studied: the DSGE model with all parameters that are constant across time (DSGE-con), the DSGE model with two regimes in shock variances (DSGE-2v),
Complementing the majority of previous studies, reporting long term memory facilitations following left prefrontal anodal tDCS, the present findings show that cathodal tDCS of the
office hours and out-of-hours, regarding age, sex, acuity level (urgent or non-urgent), chief complaint, type of health problem (injury or no injury), diagnostic tests per-
A review of 64 studies on economic evaluations of smoking cessation identified only two Asian studies, both of which were conducted in high- income countries (Japan and
