Support Vector Machine-Based Classification
of AD on Bootstrap Method
R. Viswanathan 1, Dr. K. Perumal 2
Assistant Professor, Department of Information Technology and Management, Arul Anandar College, Karumathur,
Madurai, Tamilnadu, India1
Associate Professor, Department of Computer Applications, Madurai Kamaraj University, Madurai, Tamilnadu, India2
ABSTRACT: To present and evaluate a new automated method based on support vector machine (SVM) classification of whole-brain anatomical magnetic resonance imaging to discriminate between patients with Alzheimer’s disease (AD) and elderly control subjects. Here the main approach is based on the use of structural images of magnetic imaging, mild cognitive impairments and AD patients to distinguish the normal controls between their phase images. Independent Component Analysis technique is used for extracting the features from the inputs of support vector machine. Based upon the characteristics of gray matter extracted from each ROI, we used an SVM algorithm to classify the accuracy, effectiveness, subjects and statistical procedures based on bootstrap resampling to ensure the robustness of the results.
KEYWORDS: Alzheimer’s disease Diagnosis, ICA techniques, Support vector machine, Sensitivity, Specificity.
I. INTRODUCTION
Alzheimer’s disease (AD) is the leading cause of dementia in the elderly accounting for 50–60% of all cases. AD patients benefit from early cholinesterase inhibitors and would consequently gain from early and accurate diagnosis of AD. In recent years, the early clinical signs of AD have been extensively investigated, leading to the concept of amnestic mild cognitive impairment (MCI). Pathological studies have shown that neuro degeneration in AD begins in the medial temporal lobe, successively affecting the entorhinal cortex, the hippocampus, the limbic system, then extending toward neocortical areas. Therefore, there has been considerable effort put on the detection of medial temporal lobe atrophy (MTA), and particularly in the hippocampus, the entorhinal cortex, and the amygdala. MTA has been evaluated using visual rating scales, linear or volumetric measurements, and voxel-based approaches. Overall, the sensitivity and spec-ificity of hippocampus measurements for distinguishing AD patients from healthy aged subjects have been evaluated to range from 80% to 95%. Recent classification methods have been developed that allow an individual class prediction. Among them, ma-chine-learning techniques have been proposed to distin-guish magnetic resonance (MR) images from two groups of subjects (e.g., patients vs. healthy subjects). All these techniques require a training population, i.e., well-characterized subjects (for instance healthy subjects and patients with known diagnosis), in order to categorize new subjects, who belong to the so-called test population, into one of the classes the subjects of the training population belong to.
Support Vector Machines (SVM) has recently been used to help distinguish AD subjects from elderly control subjects using anatomical MR imaging (MRI). Classification methods have also been recently applied to the classification of MCI subjects compared to control subjectsor to help differentiate AD from front temporal lobar degeneration. Even though feature parameters can be determined from the whole brain, these parameters may have no relevant physio pathological interpretation, or only a selected set of most discriminating voxels or regions are eventually used to classify the subjects.
The purpose is to individually classify AD patients and healthy elderly control subjects by using a whole-brain MR image analysis. We use a histogram analysis of the MR images to extract feature parameters. Thereby, we focus on characteristics of the distribution of the gray matter (GM), white matter (WM), and cerebrospi-nal fluid (CSF), which intuitively makes sense when dealing with neurodegenerative diseases in general and AD in particular.
II. PROBLEM DEFINITION
The main approach is based on the use of structural images of magnetic imaging, mild cognitive impairments and AD patients to distinguish the normal controls between their phase images. Independent Component Analysis technique is used for extracting the features from the inputs of support vector machine. Based upon the characteristics of gray matter extracted from each ROI, SVM algorithm is used to classify the accuracy, effectiveness, subjects and statistical procedures based on bootstrap resampling method.
III. RELATED WORKS
Materials and methods: Patients and subjects:
More than ten patients with AD and twenty two healthy aged control subjects (CS) were recruited. All patients and control subjects signed an informed consent form after the nature of the procedures.
Inclusion criteria were the following:
1. Fulfillment of the National Institute of Neurological and Communication Disorders and Stroke/ Alzheimer Disease and Related Disorders Association criteria for probable AD.
2. Clinical Dementia Rating scale (CDR) ≥ 0.5 (all patients but two had CDR=1, two patients had CDR=0.5).
3. No clinical or neuroimaging evidence of focal lesions including brain tumor, subdural hematoma, and central nervous system infection.
4. No cortical or sub cortical vascular lesions on MRI visible on the structural image. 5. No medical conditions that may interfere with cognitive performance or follow up.
SVM classifier algorithm:
The SVM is a learning machine for two-class classification problems.SVM conceptually implements the idea that vectors are nonlinearly mapped to a very high dimension feature space. In this feature space, a linear separation surface is created to separate the training data by minimizing the margin between the vectors of the two classes. The training ends with the definition of a decision surface that divides the space into two subspaces. Each subspace corresponds to one class of the training data. Once the training is completed, the test data are mapped to the feature space.
“Support Vector Machine” (SVM) is a supervised machine learning algorithm which can be used for both classification and regression challenges. However, it is mostly used in classification problems. In this algorithm, the plotting of each data item as a point in n-dimensional space (where n is number of features you have) with the value of each feature being the value of a particular coordinate. Then, perform classification by finding the hyper-plane that differentiates the two classes. Support Vector Machine is a frontier which best segregates the two classes are hyper-plane and line.
IV. STATISTICAL ANALYSIS
Discriminate function of feature parameter:
The whole set of 90 ROIs was used to classify the patients. Nevertheless, it was important to evaluate the discriminating power of the feature parameter α2 and investigate whether and in which brain regions this parameter was indeed able to distinguish
AD patients from healthy controls. Group differences in the value of α2 in each ROI between AD patients and CS were assessed as
follows. For each ROI, tests whether the distribution of α2 in CS significantly differed from that in AD patients, by using a two -sample T test. As the number of subjects examined was relatively limited (nCS =22 healthy CS and nAD =11 AD patients), to assume
that this test was not robust enough. By using a bootstrap method, work with the null hypothesis H0 that there was no difference
between the two groups. The initial set of subjects S was divided into S1 of cardinal nCS, initially containing all the healthy CS, and
S2 of cardinal nAD, initially containing all the AD patients, and the initial value T0 of the T test was calculated.Then resample the set
S under the hypothesis H0, creating resampled sets S1 ; 1
and S2 ; 1
by drawing with replacement nCS and nAD subjects from the whole
set S. To perform n resampling and calculate the percentile corresponding to the initial value T0 of the T test in the set of values fT; i;
i 2 ½ 1; n & g, i.e., cardinal ð T; i T0 Þ=n. According to the bootstrap theory, this percentile is a good estimate of the p value of the T
test if n is large enough.
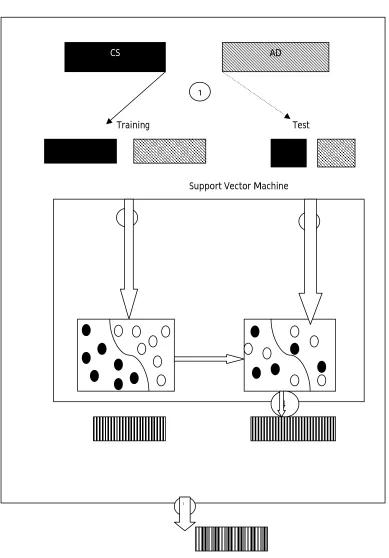
Testing a data using a bootstrap method:
Fig – 1: Method for Data Selection to perform classification
× 1000 times MEAN CORRECT CLASSIFICATION RATE
Training Test
Support Vector Machine
CS AD
1
3
4 2
Choice of SVM Parameters:
In this method, the two classes were “AD patient” or “CS”; each subject was represented by a vector of the α2 values in all 90 ROIs. A kernel function needs to be chosen for SVM: It reflects the nonlinear mapping from the input space to the feature space. A commonly used radial basis function of the form (x, y) K (x, y) = eγ|x - y|2 . To determined the optimal values of two constants: γ, width of the radial basis function, and C, an input parameter for the SVM algorithm, which represents the error/trade-off parameter that adjusts the importance of the separation error in the creation of the separation surface.
Most Significant different ROIs:
In this record of work five ROIs had a p value less than 10−4 and 34 ROIs had a p value less than 10−2 (Fig.2). These small p values indicate that there was a significant difference between AD patients and CS in the characteristics of gray matter in these ROIs as measured by the parameter α2. The most significant ROIs included regions classically affected in AD, such as the hippocampus or the para hippocampal gyrus. Those ROIs are listed in Table 1.
ROI Bootstrap estimate of the p value
Left parahippocampal gyrus <2.5×10⁻⁶
Right parahippocampal gyrus <2.5×10⁻⁶
Left hippocampus <2.5×10⁻⁶
Right lingual gyrus 5×10⁻⁶
Left lingual gyrus 5×10⁻⁶
Right insula 5×10⁻⁶
Left middle occipital gyrus 5×10⁻⁶
Left precuneus 3×10⁻⁵
Left middle temporal gyrus 3.75×10⁻⁵
Left inferior temporal gyrus 4.75×10⁻⁵
Table 1: ROIs discriminate patients with ALzhimers Disease and Control Subjects
Feature parameter:
The design feature parameter that showed a discriminating power between patients with AD and healthy CS, and this feature parameter is to create a classifier that can predict whether a single subject belongs to the AD or the CS group. As gray matter modifications are well known in AD, it makes sense to focus on the distribution of the gray matter for the choice of the feature parameter and, consequently, on the parameters (μ2, σ2 and α2) estimated by the Gaussian mixture model. All three parameters convey some information that could be used either separately or in combination as representative features for the ROIs in the classification algorithm. There are two main reasons. Firstly, α2 has a physiological meaning in that it is the relative weight of GM compared to WM and CSF. Therefore, it intuitively reflects the modifications that are well known to be induced by AD, namely, a decrease in GM compared to WM and CSF. Secondly, this parameter is more invariant with respect to the acquisition parameters, as opposed to μ2 and α2, which are more likely to depend on the contrast in the images.
Classification method:
The SVM classifier involves a nonlinear mapping from the input parameter space to the feature space. The nonlinear mapping was performed using a radial basis function. Bootstrap resampling methods were used both to select test and training data to evaluate the classification accuracy of our method and to estimate the SVM parameters. For this latter purpose, alternative approaches have been proposed in the literature, for instance, cross-validation methods such as leave-one-out or n-fold cross-validation. For instance, Vemuri et al. used a technique in which patients and controls were first divided in two groups (training and testing sets), the training group being in turn divided into three subgroups used for feature selection and model optimization and one subgroup used for testing. This leads to perform the classification on much smaller groups, and they repeated their method ten times and averaged the results to increase the robustness of their classification.
In our study, since a nonlinear mapping of the parameters is performed, bootstrap is the method of choice, as leave-one-out has been shown to be less robust than bootstrap when applied to nonlinear cases.
Classification results:
The results with the proposed classifier yielded a sensitivity of 91.5% and a specificity of 96.6%, for a 94.5% mean correct classification rate. The MR images of all subjects were of similar quality. However, the SVM classified four subjects with a correct classification rate less than 90%, as shown in Table 1, which may be explained by clinical considerations. Patient who was never classified correctly, had a very particular clinical evolution. At the time the MRI was performed, the scores for this patient were CDR= 1 and MMSE=19, which happened to be the lowest MMSE of all the subjects. The initial clinical examination was very suggestive of AD: starting with amnestic symptoms and an initially normal neurological examination in particular, no extra pyramidal syndrome.
SVM-based methods in Alzheimer’s disease classification:
reported correct classification rates and MMSE values, it can be concluded that the method proposed in this paper performs very well compared to existing classification approaches.
Possible improvements of the proposed method:
The use of bootstrap and resampling methods ensured a statistical robustness to the procedure. This allowed us to obtain significant results on relatively small MRI datasets. Nevertheless, the results of our study require confirmation in much larger groups of participants.
The classifier was developed using a specific procedure to parcellate the brain into ROIs. To perform parameter extraction at a regional scale, thus making the method robust to registration imperfections and anatomical variations across individuals. The current parcellation yielded good classification results, but it can be improved.
Indeed, the proposed method extracted one feature parameter for each ROI. Therefore, it cannot take variations of the feature parameter within the ROI into account. Consequently, using a parcellation into smaller ROIs could be sensitive to variations of the feature parameter at smaller scales and thus better fit the atrophy pattern of the disease and improve the classification results. However, it is expected that the smaller the ROIs, the less robust the estimation of the feature parameter, as possible registration errors would likely introduce larger errors when estimating the proportion of gray matter from the histogram analysis and hence yield a decrease in sensitivity. A parcellation at a finer scale should then take this trade-off issue into consideration. Improvement may also include other routines to denormalize the labeled anatomical template to the individual MRI or the use of a different labeled template.
V. CONCLUSION
To develop a method that is able to classify automatically patients with early Alzheimer’s disease from control subjects. This method has a potential for early diagnosis of Alzheimer’s disease. The method will be evaluated in MCI patients and for other neurodegenerative diseases and its robustness will be assessed in patients with images obtained from different MR scanners with various acquisition parameters.
REFERENCES
1. Brookmeyer R, Gray S, Kawas C (1998) Projections of Alzheimer’s disease in the United States and the public health impact of delaying disease
onset. Am J Public Health 88:1337–1342
2. Ferri CP, Prince M, Brayne C, Brodaty H, Fratiglioni L, Ganguli M, Hall K, Hasegawa K, Hendrie H, Huang Y, Jorm A, Mathers C, Menezes
PR, Rimmer E, Scazufca M (2005) Global prevalence of dementia: a Delphi consensus study. Lancet 366:2112–2117 doi:
10.1016/S0140-6736(05)67889-0
3. Ramaroson H, Helmer C, Barberger-Gateau P, Letenneur L, Dartigues J (2003) Prevalence of dementia and Alzheimer’s disease among subjects
aged 75 years or over: updated results of the PAQUID cohort. Rev Neurol (Paris) 159:405–411 (in French)
4. Winblad B, Wimo A (1999) Assessing the societal impact of acetylcholinesterase inhibitor therapies. Alzheimer Dis Assoc Disord 13(Suppl
2):S9–S19 doi:10.1097/00002093-199911002-00003
5. DeKosky ST, Marek K (2003) Looking backward to move forward: early detection of neurodegenerative disorders. Science 302:830–834
doi:10.1126/science.1090349
6. Petersen RC (2004) Mild cognitive impairment as a diagnostic entity. J Intern Med 256:183–194 doi:10.1111/j.1365-2796.2004.01388.x
7. Winblad B, Palmer K, Kivipelto M, Jelic V, Fratiglioni L, Wahlund L, Nordberg A, Bäckman L, Albert M, Almkvist O, Arai H, Basun H,
Blennow K, de Leon M, DeCarli C, Erkinjuntti T, Giacobini E, Graff C, Hardy J, Jack C, Jorm A, Ritchie K, van Duijn C, Visser P, Petersen RC (2004) Mild cognitive impairment—beyond controversies, towards a consensus: report of the International Working Group on Mild Cognitive
Impairment. J Intern Med 256:240–246 doi:10.1111/j.1365-2796.2004.01380.x
8. Braak H, Braak E (1995) Staging of Alzheimer’s disease-related neurofibrillary changes. Neurobiol Aging 16:271–278 (discussion 278–284)
doi:10.1016/0197-4580(95)00021-6
9. Bastos Leite AJ, Scheltens P, Barkhof F (2004) Pathological aging of the brain: an overview. Top Magn Reson Imaging 15:369–389