Abstract
BHATT, KETAN HARENDRAKUMAR. On-Chip Manipulation and Controlled Assembly of Colloidal Particles using Alternating Electric Fields. (Under the direction of Dr. Orlin D. Velev.)
Alternating (AC) electric fields have been investigated as a versatile tool for rapid particle and fluid manipulation in micro- Total Analysis Systems (µTAS). Different onchip electrode geometries and different particle suspensions were explored in this study with an aim to acquire a fundamental understanding of particle behavior under applied fields. Aqueous suspensions of particles of sizes ranging from nanoparticles to microspheres and having varied electrical properties (dielectric or conductive) were studied. For each system, detailed electrostatic simulations were carried out to identify the forces acting on the particles and fluid. Control of the particle-field, fluid-field and particle-particle interactions, by fine tuning the applied field, lead to the desired assembly of particles. Dielectrophoresis (DEP), the interaction between induced particle dipoles and the spatially non-uniform electric field, was used to assemble gold nanoparticles into microwires and for manipulating fluid droplets containing suspended particles in a novel liquid-liquid microfluidic system. AC Electrohydrodynamics (EHD) driven liquid flows were used for the transportation, redistribution and collection of suspended particles inside experimental cells.
controlled dielectrophoretic assembly of nanoparticles into on-chip electrical connectors, switches and networks.
A new EHD effect arising from the application of alternating electric fields to patterned electrode surfaces was observed. AC fields were applied to dilute suspensions of latex microspheres enclosed between a patterned silicon wafer and an ITO-coated glass slide in a small chamber. The latex particles became collected in the center of the conductive "corrals" on the silicon wafer acting as bottom electrode. The particle collection efficiency and speed depended only on the frequency and strength of the field and were independent of the material properties of the particles or the electrodes. EHD flow emerging from the spatially non-uniform field was described and interpreted by means of electrostatic and hydrodynamic simulations. The technique allowed three dimensional microfluidic pumping and transportation using two-dimensional patterns. On-chip collection of latex particles, yeast cells and microbes using EHD flows was demonstrated.
On-Chip Manipulation and Controlled Assembly of Colloidal
Particles using Alternating Electric Fields
by
Ketan H. Bhatt
A Dissertation Submitted to the Graduate Faculty of North Carolina State University
in partial fulfillment of the requirements for the Degree of
Doctor of Philosophy
Chemical Engineering
Raleigh, North Carolina May 2006
Approved By:
Veena Misra Saad Khan
Jan Genzer Orlin Velev
this dissertation is dedicated to my family
Biography
Ketan Bhatt, was born on New Year’s Day 1980 in Jaipur in the state of Rajasthan in India. The city of Jaipur, also known as the Pink City because of the pink facades of its old palatial buildings, is the state capitol and the largest city in Rajasthan. He was raised along with his sister in the city of Vadodara, in the Gujarat state of India. Vadodara is named after the Banyan trees (Vad in Gujarati) that grow in abundance on the banks of the Vishwamitri River and is home to major pharmaceutical, petrochemicals and plastics industries that include heavyweights such as the Gujarat State Fertilisers & Chemicals, Indian Petrochemicals Corporation Limited, Gujarat Alkalies and Chemicals Limited, Gujarat Refinery, ONGC and Alembic Industries. The vast industrial expanse around the city is one of the main reasons that Ketan decided to pursue the field of engineering. The high demand for chemical engineers in the state of Gujarat lead to the subsequent choice of Chemical Engineering as a major during his college career.
Acknowledgements
There have been many individuals along the path of my worldly adventures so far who deserve a great hoorah for my continuing success, both academically and otherwise. I thank each and every one of them, but the space constraints make me limit to a select few here. First and foremost I would like to thank my parents, Ranjana and Harendra Bhatt, for their continued love and support. They have provided me opportunities and resources to excel in any and all endeavors that I have desired. I thank my sister Ruchi for her everlasting cheerfulness which has been a constant source of joy in our family. Special thanks are due to the members of the Bhatt and Purohit families who have played a significant role in my life. The time spent with them, be either at Uttrayan in Vadodara or the summer vacations in Jaipur or the myriad of weddings and festivals celebrated elsewhere, hold a special place in my heart. I also owe a debt of gratitude to all my neighbors, especially the Parekhs from next door, who have kept a constant lookout for my welfare. The Sharad Poornima “Dudhpak” and the “Khichadi parties” are among the few things I have missed since leaving Vadodara. Thanks are also due to the teachers and staff at Lal Bahadur Shastri Vidhyalaya (where my mom is employed) for their support and encouragement.
I thank Professors Veena Misra, Saad Khan and Jan Genzer for serving on my dissertation committee and Professor John van Zanten for acting as a last minute substitute on the committe. I am also thankful to the CHE faculty members, who have let me use their lab facilities and equipment many times during my research. All the staff members of the CHE department have in one way or another helped me during my five years here at State and I thank every one of them for that.
system. Thanks are also due to Dr. Sonia Grego of RTI International in RTP for a successful collaboration on the EHD particle collection project.
Table of Contents
List of Figures . . . . ix
List of Tables . . . . xv
Chapter 1. Alternating Electric Field Applications in Micro-Total Analysis Systems . . . . . . 1
1.1. Introduction. . . 2
1.2. Micro- Total Analysis Systems . . . 2
1.3. Electrical Field Induced Forces on Colloids . . . 5
1.3.1. Electrical Double Layer Formation at Interfaces . . . 5
1.3.2. Electrophoresis and Electroosmosis. . . 8
1.3.3. Dielectrophoresis and Particle Chaining Force. . . 12
1.3.4. AC Electrohydrodynamics . . . 19
1.4. Layout of this Thesis . . . 23
1.5. References . . . 23
Chapter 2. Assembly of Colloidal Particles into Conductive Microwires by Dielectrophoresis . . . . 33
2.1. Introduction . . . . 34
2.2. Materials and Methods . . . . 35
2.2.1. Substrate Fabrication . . . . 35
2.2.2. Gold Nanoparticle Suspensions . . . . 36
2.2.3. Experimental Setup . . . . 36
2.3. Modes of Microwire Growth . . . . 37
2.4. Effect of Operating Parameters on Assembly Speed of Microwires . . . 41
2.4.1. Effect of Electrolyte Concentration . . . . 41
2.4.2. Effect of Frequency . . . . 43
2.4.3. Effect of Media Viscosity and Dielectric Constant . . . . . 44
2.4.4. Effect of Nanoparticle Concentration . . . . 45
2.5. Modeling of Microwire Growth Process by Electrostatics Calculations . . 46 2.5.1. Electrostatics Calculations using TRICOMP . . . . 46
2.5.2. Mechanism of Assembly . . . . 47
2.6. Microwire Assembly for Nanotechnology Applications . . . . . 52
2.6.1. Engineered Microwire Assembly . . . . 53
2.6.2. Microwires made from Other Materials . . . . 55
2.7. Conclusions . . . . 57
2.8. Acknowledgments . . . . 57
2.9. References . . . . 57
Chapter 3. AC Electrokinetic Collection of Particles and Cells . . . 62
3.1. Introduction . . . . 63
3.2. Materials and Methods . . . . 64
3.2.1. Experimental Apparatus . . . . 64
3.2.2. Materials . . . . 66
3.3. Results . . . . 66
3.4. Effect of Operating Parameters . . . . 68
3.4.1. Effect of Applied Field Strength . . . . 68
3.4.2. Effect of Field Frequency . . . . 70
3.4.3. Effect of Electrolyte Concentration . . . . 71
3.5. Interpretation of Results and Discussions . . . . 72
3.5.1. Simulation of Electric Field Distribution . . . . 72
3.5.2. Simulation of Fluid Velocity Distribution . . . . 76
3.5.3. Comparing Experimental Results with Simulation Predicted Behavior . . . . 77
3.6. Potential Applications of the EHD Flow Technique . . . . 79
3.6.1. EHD Focusing of Particles . . . . 80
3.6.2. Collection of Live Cells and Microbes . . . . 81
3.7. Conclusions . . . . 83
3.8. Acknowledgments . . . . 83
3.9. References . . . . 84
Chapter 4. Dielectrophoretic Manipulation of Freely Suspended Droplets 88 4.1. Introduction . . . . 89
4.2. Experimental Setup . . . . 90
4.4. Applications of the Liquid-Liquid Microfluidic System . . . . . 96
4.4.1. Controlled Parallel Transport of Many Droplets . . . . . 96
4.4.2. Mixing of Droplets and Encapsulation in Oil . . . . 98
4.4.3. Chemical Reactions and Precipitations . . . . 99
4.4.4. Anisotropic Particle Synthesis using Suspended Droplets . . . 100
4.5. Conclusions . . . . 105
4.6. Acknowledgements . . . . 105
4.7. References . . . . 105
Chapter 5. Summary & Outlook . . . . 109
5.1. Summary . . . . 110
List of Figures
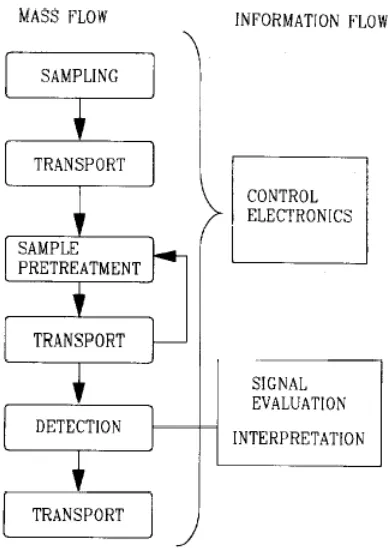
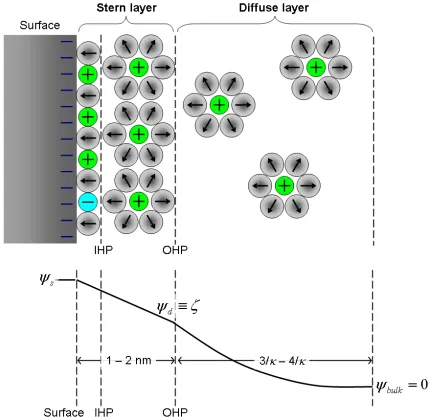
Figure 1.1. Flow chart of the steps necessary for a µTAS – The on-chip device envisioned should be able to do sampling, sample pretreatment and detection automatically. From Manz et al. [5]. . . . 3 Figure 1.2. Electrical double layer formation at substrate-electrolyte interface
and the plot of electric potential generated at the interface. The electric potential decays from ψs at the surface to zero in the bulk solution leading to an electroneutral substrate-double layer complex. 6 Figure 1.3. Schematics of forces in DC fields. (a) Electrophoresis – the
negatively charged particle is attracted towards the anode. (b) Electroosmosis – the cations in the double layer are attracted towards the cathode resulting in fluid flow towards the cathode. The particle velocity in both cases is indicated by the blue arrows. The net particle velocity under DC fields is the sum of the electrophoretic and the electroosmotic velocities. . . . 9 Figure 1.4. Dielectrophoretic force on suspended particles between planar
electrodes. The electric field intensity gradient is directed towards the plane of electrodes and towards the electrode edges. Positive DEP (right) – particle is more polarizable than the medium and is attracted towards regions of higher field intensity. Negative DEP (particle on the left) – particle less polarizable than the media is repelled from the high electric field regions. . . . . 13 Figure 1.5. Schematics of particle chaining force arising from dipole-dipole
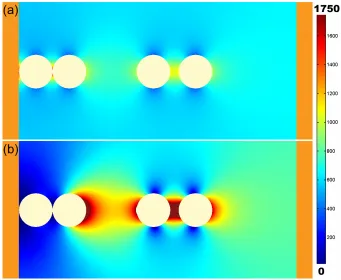
interaction. The electric field induced polarization is indicated by the arrows inside the particle. The yellow particles have higher polarizability compared to the medium and the green particles have lower polarizability. Particles of the same type (with polarizability either higher or lower) always align in the direction of the electric field, whereas mixtures of particles form chains perpendicular to the field direction. . . . 14 Figure 1.6. Simulation illustrating the two general cases of electric field
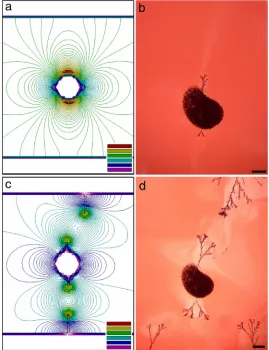
intensity distribution in chambers with colloidal particles. (a) Dielectric particles (ε = 5) and (b) conductive particles (ε→∞) suspended in a medium with lower relative dielectric permittivity
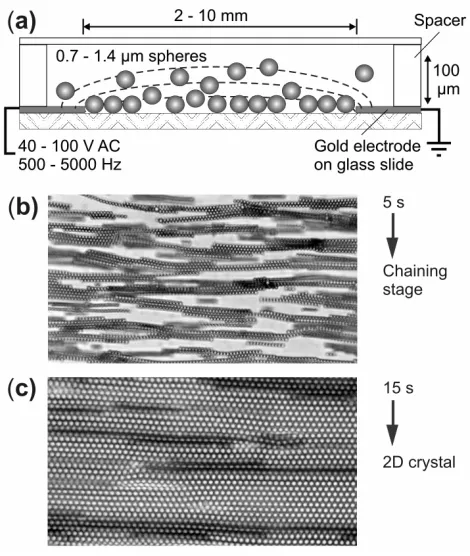
different. . . . 15 Figure 1.7. Dielectrophoretic assembly of latex spheres into 2D colloidal
crystals. (a) Schematics of the experimental cell designed for assembly of particles under DEP. (b) Optical micrograph taken during the initial rapid particle chaining stage. The latex spheres form chains due to dipole-dipole interaction. The chains are attracted towards the plane of electrodes by DEP slowly merging into 2D crystals. (c) Micrograph taken after the 2D colloidal crystal is formed. The particles in the micrographs are 1.4 µm in size. [88-90] . . . . 17 Figure 1.8. Origins of AC Electrohydrodynamics effects. The tangential electric
field present atop the electrodes close to the edges leads to EHD flow. The sign of the counterions in the double layers on the electrodes and the electric field change concurrently in subsequent half-cycles to give net fluid flow directed towards the electrodes. . 20 Figure 2.1. Outline of the experimental setup and schematics of the two
different modes of microwire growth – bulk microwire assembly and surface microwire assembly. The chamber and nanoparticle sizes are not to scale. . . . . 37 Figure 2.2. Typical experimental images of the two types of microwire
structures obtained. (a) Bulk microwire growth. Note that some of the branches are not in the focal plane. (b) Surface microwires. (c) Scanning electron micrograph of the surface microwire structure. Scale bars: (a) 100 µm; (b) 20 µm. . . . 38 Figure 2.3. Speed of microwire assembly in bulk and surface modes plotted as
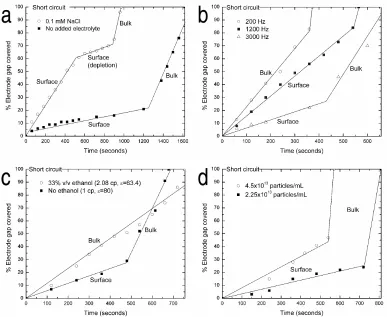
percentage of electrode gap covered versus time. Two microwires were grown in each assembly mode to evaluate the reproducibility of the process. Lines are guides to the eye. . . . 39 Figure 2.4. Effect of operating parameters on the assembly speed of microwires,
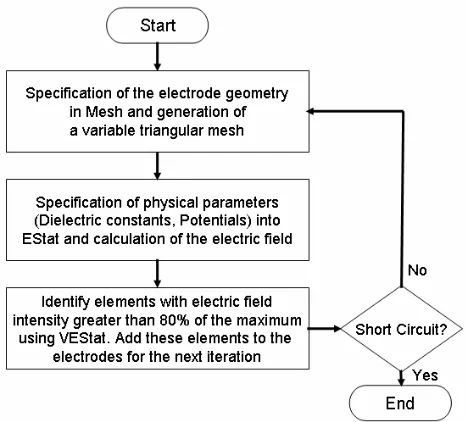
(a) electrolyte; (b) frequency; (c) viscosity and dielectric constant of the medium; and (d) particle concentration. In all experiments, the other parameters were kept constant. Note that in all plots the growth speed for bulk assembly is higher than that for the surface assembly. Solid lines are guide to the eye. . . . 42 Figure 2.5. Algorithm for electrostatic simulation of the mechanism of
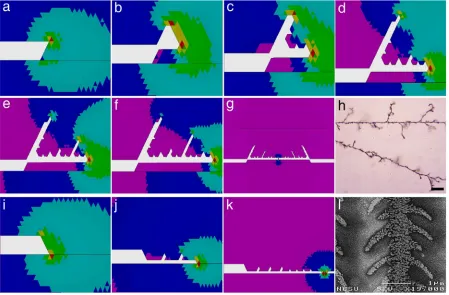
microwire growth. . . . 48 Figure 2.6. Snapshots of the simulation process at various growth stages for
80% of the maximum leading to termination, (f) the first branch stops growing, (g) short circuit of the wires growing from opposing electrodes. Surface microwire assembly – (i) initial geometry, (j) the wire stays on the surface and does not form long branches, (k) wires are still on surface even though nearing short circuit. The electrode and the microwires formed are shown in white, and the solid line next to electrode delineates the suspension and the glass surface. Actual experimental images: (h) branching pattern for bulk microwires, (l) scanning electron micrograph of surface microwires. Compare (g) and (h), (k) and (l). Note that a slight change in the initial geometry, (a) and (i), changes the assembly mode. Scale bar: 10 µm. . . . 49 Figure 2.7. Electrostatic calculations around conductive objects compared with
experimental images: (a) electric field intensity in the presence of a conductive island between planar electrodes; (b) actual experimental image proving that the wire growth starts at the island; (c) electrostatics calculations for wires growing from the island and from opposing electrodes, indicating that they will grow toward each other and short circuit; (d) experimental image depicting a situation similar to that in (c). Scale bars: 500 µm. . . . 51 Figure 2.8. Controlled assembly of microwires with a specific morphology:
(a) single unbranched microwire growth through the bulk nanoparticle suspension containing 50 % glycerol by volume; (b) array of parallel wires assembled on the surface of a glass slide. Scale bars: 50 µm. . . . 53 Figure 2.9. Various types of microwire electrical connections to conductive
islands between the electrodes. Islands connected through (a) bulk microwire growth only, (b) a combination of bulk and surface growth, or (c) surface assembly only. Scale bars: 500 µm. . . . 54 Figure 2.10. Microwires assembled from different materials. (a)
DMAP-stabilized 6 nm gold nanoparticles. (b) 640 nm Core-shell microspheres with polystyrene core and a thin gold shell. (c) Single walled carbon nanotubes. Scale bars: (a) and (b) 50 µm, (c) 500 µm. 55 Figure 3.1. Schematics of (a) the patterned silicon wafer and (b) the
experimental setup of the chamber used for particle collection. . . 65 Figure 3.2. Time-lapse images of 2 µm latex particles collected from a 0.01%
Figure 3.3. Particle velocities measured by video microscopy near photoresist-corral edges at 100 Hz. The lines are linear fits for (top) maximal particle velocity and (bottom) average particle velocity. . . . . 69 Figure 3.4. Effect of the frequency of the applied field (a) 2000 Hz, 4 V/mm,
(b) 5000 Hz, 6.67 V/mm. Both images show collection of 2 µm latex from 0.01% w/v suspensions and were taken 1 hour after the start of the experiment. Compare also with Fig. 3.2e. . . . . 70 Figure 3.5. Particle collection for 2 µm, 0.01% w/v latex suspensions with 0.5
mM NaCl under electric field of 4 V/mm, frequency of 100 Hz. (a) t = 1 hr, particles pack more closely compared to suspensions without electrolyte. (Compare with Fig. 3.2e) (b) Zoom in image at the center of the corral shows close packed colloidal quasi-crystals. (Compare with Fig. 3.2f). . . . 71 Figure 3.6. Simulation of the electric field distribution inside the chamber using
FEMLAB. (a) Boundary conditions and geometry specified, (b) Electric field vectors calculated for one conductive corral, (c) Zoom-in near the left photoresist-corral edge shows non-uniform field distribution. Black boxes illustrate the photoresist layer and are not to scale except in (c). . . . . 73 Figure 3.7. (a) Computed tangential electric field from FEMLAB simulation
and (b) Experimentally measured particle velocities. The comparison proves that the particles (and liquid) get accelerated in area of high tangential field outside the conductive corral edge. . . 75 Figure 3.8. Simulation of the fluid velocity distribution inside the chamber
using FEMLAB (a) Boundary conditions and the geometry specified, (b) Computed velocity distribution inside the chamber. The liquid is accelerated at the corral edges and drags along the particles which are deposited in the stagnant region in the middle. . 76 Figure 3.9. EHD focusing of particles – 2 µm latex particles collected using 4
V/mm, 100 Hz alternating electric field for 75 minutes at the foci of the 12 mm diameter circular corral. . . . 80 Figure 3.10. Micrograph of yeast cells collected in a conductive corral from a
suspension containing 0.0141% solids under an alternating electric field. . . . 81 Figure 3.11. Collection and concentration of microbes from river water samples.
suspended at the surface of fluorinated oil are manipulated by timed switching of the electrodes underneath the F-oil. (b) Example of the printed circuit board design. The red and green leads are on the top and bottom respectively and are connected through the holes. . . 90 Figure 4.2. On-chip manipulation of floating microdroplets using
dielectrophoresis. (a) Simulation of the electric field intensity distribution in the vertical plane at two distinct droplet equilibrium positions. For electrodes energized at the end of the array, the droplet is attracted towards the middle of the gap between energized and grounded electrodes; otherwise the droplet positions itself on top of the electrode. The color scale to the right is in the order of increasing electric field intensity. (b) Optical image of 750 nL droplets containing polymer microspheres (top) and gold nanoparticles (bottom) suspended above two tracks of electrodes. The experimental observed positions correspond to the theoretical predicted ones. . . . 92 Figure 4.3. Droplet speed plotted as a function of the field intensity squared.
The data are for 750 nL aqueous droplets submersed in a 1.15 mm deep F-oil layer. The speed was measured by the smallest time required for the droplet to traverse an automated 8-electrode sequence forwards and backwards. Frequency was 200 Hz. . . . 94 Figure 4.4. Parallel transport of multiple droplets. Four 750 nL water droplets
containing, from top to bottom, gold nanoparticles, 2% white polystyrene, 2% pink polystyrene and 0.2% white polystyrene microspheres, were moved in parallel by switching on single column of electrodes within the array to an applied AC signal of 300 V/300 Hz. The droplets covered approximately 15 mm distance in 14 seconds. . . . 96 Figure 4.5. Controlled transport of droplets. Water droplet containing latex
microspheres is diverted along the top branch at the fork using an extra electrode close to both the fork and the top branch. . . . 97 Figure 4.6. Mixing and encapsulation in oil. Droplets of aqueous suspensions of
gold nanoparticles and of white polystyrene latex (750 nL each) were mixed and subsequently encapsulated inside a 1000 nL dodecane droplet (initial position indicated by the arrow) transported separately. Sodium dodecyl sulfate (SDS) added to the dodecane droplet facilitated its dielectrophoretic control. Encapsulation is also facilitated by small amount of SDS inside the aqueous droplets. The columns of electrodes are energized at 400V/200Hz. . . . . 98 Figure 4.7. Chemical reactions and precipitation. Two separate precipitation
droplets. On the top track solutions of CaCl2 and K2HPO4 are
combined to form the white precipitate, Ca3(PO4)2. On the lower
track drops of FeSO4 and NaOH are mixed to form the green
precipitate, Fe(OH)2. The images at t = 600 seconds and t = 1200
seconds show the growth of the crystalline solids with time. All droplets are 750 nL in volume and driven by voltages of 400 V/200 Hz. . . . . . . 99 Figure 4.8. Anisotropic “eyeball” supraparticle assembly by the evaporation of
droplets from binary suspensions. Images show 1000 nL droplet containing suspended gold nanoparticles and polystyrene microspheres above the energized electrode, (a) 1 min after injection on F-oil, (b) 7 min of drying, (c) 18 min of drying, (d) 3 hours of drying. (e) Dried eyeball assembly. Inset shows the SEM of colloidal crystal formed by latex microspheres. (f) Array of eyeball particles entrapped on the chip. Scale bars: (a-d and f) 1 mm, (e) 500
µm, Inset 5 µm. . . . 101 Figure 4.9. Formation of “striped” multilayer particles by the evaporation of
droplets from ternary particle mixtures. (a) Segregated multilayer assemblies of dried gold nanoparticles (top layer), fluorescent red latex beads (middle) and silica microspheres (bottom), (b) Complementary image in fluorescence illumination. (c) Segregated multilayer assembly of dried yellow latex beads (top), gold nanoparticles (middle), and silica microspheres, (d) Complementary image in fluorescence illumination. . . . 102 Figure 4.10. Polymer-based and polymer-encapsulated particles: (a) Polymerized
List of Tables
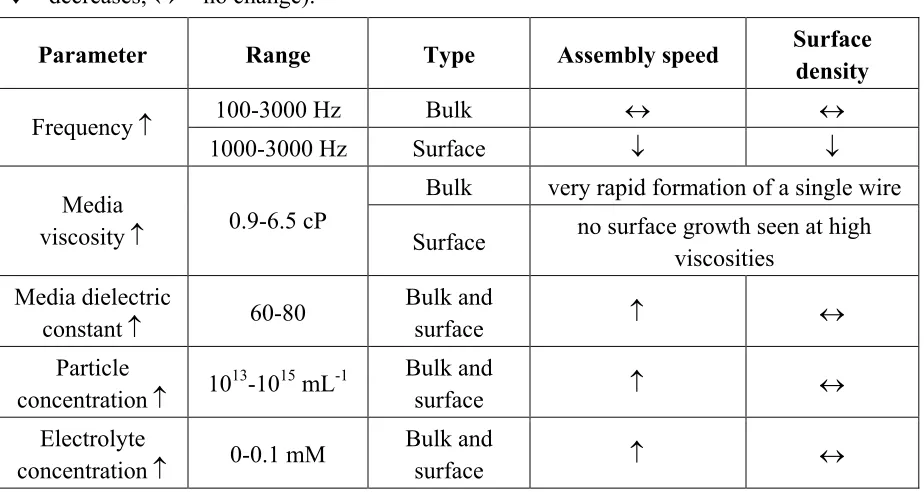
Table 2.1. Effect of different operating parameters on the assembly speed and the surface density of microwires growth in bulk and surface assembly modes (↑ = increases, ↓ = decreases, ↔ = no change). . 45 Table 2.2. “Switching parameters” identified that allow controlling the mode
of microwire assembly, bulk or surface. . . . . 46 Table 3.1. Expected EHD behavior and experimental observation for particle
collection under different operating parameters. Increases (↑), decreases (↓)or no effect (↔) . . . . 77 Table 4.1. Effect of experimental parameters on the responsiveness and
mobility of suspended microdroplets. Increases (↑), decreases (↓) or no effect (↔) . . . . 93 Table 4.2. Estimated energy required for moving a 500 nL water droplet, 1 cm
Chapter 1
Alternating Electric Field Applications in Micro- Total Analysis
Systems
∗
1.1. Introduction
Micro- Total Analysis Systems (µTAS) or Lab-on-a-Chip systems that carry out sample pretreatment, analysis and detection are revolutionizing the fields of drug delivery, chemical and materials syntheses and analyses, point-of-care clinical devices, biowarfare and biochemical agent detection, high throughput screening, and water quality control among others [1]. A recent survey among nanobiotechnology (NBT) experts conducted by the Nano2Life Consortium found that the highest overall impact and prospect among emerging nanobiotechnology applications is of Lab-on-a-Chip systems [2]. This survey, conducted by the Interdisciplinary Center for Technology Analysis at the Tel Aviv University was an effort to understand the view of worldwide NBT experts on the anticipated developments in NBT and the impacts and prospects of these developments. The other leading areas deemed to have highest overall impact were self-assembly, biomimetic materials, single molecule biosensors and biodetection with tailor made nanosurfaces. The aim of my graduate research has been to develop tools and techniques for manipulation and assembly of colloids using alternating electric fields that are suitable for Lab-on-a-Chip applications. To this aim, this chapter overviews the field of µTAS, elucidates the reasons why electric fields are very well suited for µTAS and explains the various forces available for manipulating and assembling colloidal particles using electric fields.
1.2. Micro- Total Analysis Systems
was introduced by Manz et al. [5]. It was envisioned that a small on-chip device would be capable of analyzing the input streams, performing the necessary pretreatment and concentration stages, and carrying out analysis and detection steps automatically without human intervention. The qualitative flow chart for such a device is shown in Fig. 1.1.
Early efforts in µTAS were focused on developing microfluidic devices for chemical analysis. These efforts lead to development of micro-pumps and micro-valves fabricated on-chips, for controlling and manipulating small volumes of fluid [6-9]. A further boost to µTAS concept was received when Manz et al. developed a device to achieve fast and efficient separation of amino acids using electroosmotic flows and electrophoretic separations in 100 µm capillaries [10, 11]. The use of electrophoresis and electrokinetic fluid handling has been a major cornerstone since then for development of µTAS devices.
consumption, very fast analysis, high throughput, extensively parallel architectures, compact design, reliability and ease-of-use. A large part of the popularity is also due to a belief that entirely new techniques will become available, opening up possibilities of experiments and innovations that would have been impossible by traditional methods. Excellent reviews on µTAS devices, their applications to separation systems, proteomic and genomic analysis, clinical and forensic analysis, point-of-care clinical diagnostic systems have been published in recent years [12-21].
From the early days, electric fields have been found to be of considerable significance in µTAS devices. A major advantage of using electric fields on a chip is the relative simplicity and availability of the experimental chips and equipment needed. The microlithography facilities used in electronic circuit fabrication allow facile fabrication of any kind of "chips" with microelectrodes for this type of application. The interfacing of the chips to the control circuitry is done by direct electrical contact and there are no mechanical or optical components involved (except for observation purposes). In contrast, for example, using optical “tweezers” for particle manipulation requires the construction of laser traps that include complex mechanical, optical and electronic components.
1.3. Electric Field Induced Forces on Colloids
Colloidal particles suspended in water readily respond to alternating (AC) or direct current (DC) electric fields. Charged particles in DC fields are attracted to oppositely charged electrodes by electrophoresis. Dielectrophoresis, particle mobility in AC fields, allows precise manipulation of particles through a range of parameters including field strength and frequency and electrode geometry. Simultaneously, DC or AC electrokinetics drive liquid flows inside the experimental cells, which also leads to transport and redistribution of the suspended particles. To understand the particle and fluid behavior in electric fields it is vital to examine the formation of electrical double layer around particles and at substrate–solution interfaces within the experimental cell which is discussed below.
1.3.1. Electrical Double Layer Formation at Interfaces
Electrical double layers are formed at all particle-solution interfaces irrespective of the presence of an applied field. For any material or phase, even for a metal in vacuum, there is a separation between the positive and negative components (electrons, atoms, molecules, ions), such as it generates potentials of the order of one volt across distances of the order of few molecular diameters at the surface [22]. Charge can also be generated by dissociation of surface groups or by adsorption of specific ions or molecules from the solution onto the surface. Thus, when a surface is brought into contact with an electrolyte solution, counterions bearing charge opposite to the charge on the surface are preferentially attracted towards the surface and form the electrical double layer as depicted in Fig. 1.2.
The ions in the diffuse layer are farther away from the surface and have the ability to move transverse to the particle surface or in and out of the double layer to the bulk solution phase. The plane between the Stern layer and the diffuse double layer is called the outer Helmholtz plane (OHP). The thickness of the diffuse layer is characterized by the Debye length of the suspension, 1/κ and is usually of the order of 3/κ to 4/κ. The Debye length of the suspension is dependent solely on the liquid properties and is given by
2 / 1 2 2
1 ∞ −
⎟⎟ ⎠ ⎞ ⎜⎜ ⎝ ⎛ =
∑
i o i i T k z e ε ε ρκ [meters] (1.1)
where, ρ∞ is the bulk concentration of ions, e is the electron charge, z is the ion valency, ε and ε0 are the dielectric permittivities of the medium and vacuum respectively, k is the Boltzmann’s constant and T is the temperature of the system. The summation is over all species i of the ions. Small amounts of added electrolyte can drastically change the behavior of particles in aqueous suspensions. For ultra pure water at 25 °C, the Debye length is 960 nm, whereas it is 30.4 nm and 9.6 nm for 0.1 and 1 mM NaCl solutions respectively. The Debye length also plays an important role in suspension stability by maintaining electrostatic repulsion between particles and prevents them from aggregating due to van der Waals forces. However, addition of about 50 mM NaCl (or similar monovalent salt) can decrease the Debye length and sequentially the electrostatic repulsion and leads to particle aggregation.
The potentials generated at the surface-solution interface and at the outer Helmholtz plane are denoted by ψs and ψd respectively. The electric potential decays as one goes away from the particle surface and through the diffuse layer and reaches zero in the bulk of the solution phase as seen in Fig. 1.2. For aqueous suspensions, it has been found that the OHP is also the plane of no-shear observed for electrokinetic fluid flow. Thus the OHP potential, ψd is the equivalent to the so-called zeta potential, ζ. The zeta potential is usually of the order of 100 mV and based on the surface charge could be positive or negative. The zeta-potential can be independently measured by a Zetasizer, which measures the dynamic light scattering spectra of particles drifting due to an applied electric field.
The zeta potential and the electrical double layer play important roles in electrokinetic phenomena. The amount of counterionic charge in the diffuse layer and hence the surface conductivity of the particle can be easily calculated from the zeta potential. The conductivity of the particle, necessary for determining dielectrophoretic force, is the sum of this surface counterionic conductivity and the bulk particle conductivity. The charge density for the diffuse layer is given by
κ ζ ε ε σ / 1 o
d=− (1.2)
constant (DC) electric field is applied to the suspension, the field “strips” away the counterions present in the diffuse layer, resulting in a particle with apparent potential, ζ. The particles of effective potential ζ are then attracted to the opposing electrode. This motion of particles is termed electrophoresis. If instead alternating (AC) electric fields are applied, the ions in the counterionic layer diffuse around the particle and concentrate at the point nearest to the opposing electrode at the particle surface, thus, creating an electric dipole. The particle behavior in the AC field is strongly dependent on the strength of this “induced” dipole, and the force is termed dielectrophoresis. Furthermore, the counterionic double layer plays an important role in all electrokinetic flow phenomena, as the flow velocity is directly proportional to the zeta-potential. The different forces acting in a simple system where particles are suspended between two planar electrodes can now be understood in context of the interaction of the electric field with the ions in the electrical double layer.
1.3.2. Electrophoresis and Electroosmosis
The motion of a charged particle in a constant DC field is known as electrophoresis. The qualitative schematic of the electrophoretic force on a particle suspended in a system with planar electrodes is shown in Fig. 1.3a. As has been discussed above, application of a DC field will strip away some of the counterionic surface charge around a particle, revealing a surface of effective potential ζ. The parameter that characterizes the response of a charged particle to applied electric field, is the electrophoretic mobility, µ defined as the ratio of the particle velocity, u to the applied electric field, E and is given by
E u r r =
µ (1.3)
The electrophoretic mobility is dependent on the particle zeta-potential and the viscosity of the surrounding media, η. It increases with an increase in the zeta-potential and decreases on increasing the viscosity. The electrophoretic mobility is also dependent on the Debye length of the suspending media. The mobility of a “small” particle, defined as having radius r << 1/κ, is given by the Hückel equation
η ζ ε ε µ
3
2 0
The electrophoretic mobility of particles much larger than the Debye length, r >> 1/κ is given by the Helmholtz-Smoluchowski equation
η ζ ε ε µ = 0
(1.5)
Tabulated values for the numerical coefficient in the right hand side of these equations for the case of particles of size comparable to the Debye length are available in the literature [23]. The electrophoretic mobility determined by measuring the particle velocity as a function of the applied external field, as done by a Zetasizer allows measuring the particle ζ-potential. The actual velocity of a charged particle in a real experimental situation of two electrodes inside a cell, however, is going to be equal to the theoretical one only in a very limited volume, where the liquid in the cell is immobile and there is no contribution of electroosmotic force.
The interaction of the counterions in the double layer around an “immovable object” (typically, the experimental cell walls) with a tangential DC field leads to a net bulk fluid flow. This phenomenon has been termed electroosmosis and is illustrated schematically in Fig. 1.3b. The ions in the diffuse layer are attracted towards the oppositely charged electrode. These ions in turn drag the liquid or solvent molecules around them resulting in a bulk fluid flow. The fluid velocity is zero at the substrate surface and the electric potential at this “no-slip” plane is same as the ζ potential of the substrate. Since the substrate can be considered a particle with an effective radius r much greater than 1/κ, the electroosmotic velocity is well estimated by the Helmholtz-Smoulchowski equation (Eqn. 1.5). However, to account for the “inverse” direction of the fluid velocity, it needs to be multiplied by -1. Thus, the electroosmotic velocity is given by
E
ur r
η ζ ε ε 0 −
= (1.6)
The electroosmotic liquid flow can drag the particles and the net particle velocity will be equal to the one caused by the electrophoretic effect, plus the electroosmotic velocity of the surrounding liquid (which changes with the position inside the cell). This is a common problem arising in particle characterization or assembly experiments with DC fields. For example, while using a Zetasizer to determine particle ζ potential it is necessary to identify regions of the experimental cell where there is no electroosmotic liquid flow. The moving liquid can also drag the particles in arbitrary direction and hence distort the assembled structures. Thus, care must be taken while using DC fields for particle manipulation in µTAS devices.
deposition of dense particle crystals that would otherwise be formed under gravity. Wide cells are usually used in order to decrease the magnitude of electroosmotic flows.
Direct electrophoretic control of the deposition speed of silica spheres for the fabrication of high quality crystals was first reported by Holgado et al. [25]. DC field applied in the vertical direction in cylinders with sedimenting spheres was used to control the speed at which the spheres deposit on the bottom. The vertical electrophoretic mobility of the spheres can add up to the Stokes sedimentation velocity so crystals from small spheres can be assembled rapidly. When the field is applied in the opposite direction, it can slow the downward mobility of large spheres whose Stokes sedimentation speed is too high in order to slowly grow well-ordered crystals. Electrophoretic deposition of colloidal particles has been used to prepare various crystals and multilayered deposits [26-35]. Electrophoretic redistribution of encapsulated particles has been used in "electronic ink" and flexible displays [36, 37].
The electroosmotic effect is conveniently utilized in microfluidic pumps [38, 39]. By placing electrodes at the ends of a capillary or a channel, electroosmotic fluid flow can be produced along the entire length of the capillary. One main advantage of electroosmotic pumps is that they do not contain any mechanically moving parts and hence lead to uniform flow in the channel. Moreover, the flows in different branches can be controlled independently by switching on/off different electrodes without needing valves. Harrison et al. used electroosmotic pumping to drive fluid flow and electrophoresis to separate amino acids in 1 to 10 cm long capillaries with 300 µm2 cross-section etched in glass chips within
electroosmosis and electrophoretic separation in capillaries, also known as Capillary Electrophoresis, has been a major tool for biological separation of proteins and DNA molecules based on their electrophoretic mobility [44-48].
1.3.3. Dielectrophoresis and Particle Chaining Force
The application of a non-uniform AC field across particle suspensions leads to emergence of dielectrophoretic (DEP) force. As the sign of the electrode polarization changes constantly, the particles are not attracted by direct charge-electrode electrostatic interactions (apart from oscillations at low frequencies of the order of tens of Hertz). Instead, the DEP force arises via interaction of the induced dipoles with the gradient of the (inhomogeneous) field as shown in Fig. 1.4. The resultant force, FDEP, is dependent on the gradient of the field squared, ∇E2 and
the particle radius, r [49-53]
( )
3 2 1Re2 K r E
FDEP = πε ω ∇ (1.7)
Its sign and magnitude are dependent on the effective polarizability of the particle, which is described by the real part of the Clausius – Mossotti function, K
( )
(
)
(
)
2(
2 2)
1 2 1 2 2 1 1 2 1 2 1 2 3 2 Re MW MW K τ ω σ σ τ σ ε σ ε ε ε ε ε ω + + − + + − = (1.8)In the above formulae, ε1 and σ1 are the dielectric permittivity and conductivity of the media and ε2 and σ2 that of the particles. If Re(K) > 0, the particles are attracted towards the areas of high electric field intensity and the DEP force is said to be positive DEP. Metallic and other highly polarizable particles are always attracted along the gradient to the regions of high field intensity and undergo positive DEP. However, if the medium is more polarizable than the particle, i.e., Re(K) < 0, the particles are repelled from the areas of high electric field intensity and undergo negative DEP. Negative dielectrophoresis is often used for levitating particles above electrodes.
1 − = MW C τ
ω (1.9)
where τMW is the Maxwell-Wagner charge relaxation time given by
1 2
1 2
2σ σ
ε ε τ
+ + =
MW (1.10)
This frequency-dependent change of sign of the force is commonly observed with polymer microspheres in water [49-52] and allows a high degree of particle control via the field frequency.
The dielectrophoretic force is not limited to AC fields. The largest possible magnitude of the induced dipoles will be realized in DC fields and DEP effects will be present in inhomogeneous fields in electrophoretic cells. The use of DC dielectrophoresis, however, is impractical, due to the much smaller magnitudes of the fields that could be applied in aqueous media. The use of AC voltage, on the other hand, allows manipulation of virtually any type of particle in any type of media and has the advantage of permitting high field strengths without water electrolysis and strong electroosmotic flows.
field induces a dipole within each particle. These induced dipoles interact not only with the external field, but also with each other if the particles are close enough. The biggest energy gain is realized when the particles align in chains along the direction of the field lines (see Fig. 1.5). This “chaining” force, Fchain is dependent on the field strength, E. A generalized expression for the force between adjacent particles is
2 2 2 1r K E C
Fchain =− πε (1.11)
where the coefficient C ranges from 3 to > 103 depending on the distance between the particles and the length of the particle chain [50]. Particles of the same type always align along the field lines, regardless of whether their polarizability is higher or lower than the media, while mixtures of particles of lower and higher polarizabilities than the media could form alternating chains in the perpendicular direction [54]. Dipolar chaining and 3D structuring were first observed and studied in relation to electrorheological fluids, and are presently a major tool in the assembly of organized particle materials and various structures and devices.
distinctive cases of particle behavior under AC fields is presented in Fig. 1.6. The color-coded plot of the simulated intensity of the field allows easy visualization of the direction and range of the forces that arise within the system. Dielectric particles with effective permittivity higher than the medium will be attracted in the direction of the higher intensity (warmer colors in Fig. 1.6a). The simulation shows how the field intensity between two polarizable particles increases and the particles moves towards each other (similarly to the predictions based on dipole-dipole interactions, Eqn. 1.11). The disturbances of the field around the particles, however, are relatively minor, regardless of the position of the chain within the chamber.
The application of electric field across suspension of conductive (typically metallic) particles creates a different electrostatic pattern in the cell. The metallic particles are nearly infinitely polarizable, and the Clausius – Mossotti factor takes its limiting value of K = 1. The DEP and chaining forces are maximized. In addition, particles at the electrode edges will connect to the electrode, effectively extending it to the outer end of the particle chain (see the simulated example in Fig. 1.6b). The tip of the conductive chain formed will distort the field intensity across the whole cell, and establish a gradient towards the end particle. Other particles will then be attracted to the tip, extending it further out into the suspension in the direction of the other electrode. The conductive chain of metallic particles will keep on extending until the electrodes become short-circuited. An example of such a process is the aggregation of gold nanoparticles into microwires discussed later in Chapter 2 and also one recently demonstrated by a study where gold nanoparticles form a pearl chain between electrodes separated by micron sized gaps [55].
1.3.3.1. Dielectrophoretic Manipulation and Assembly of Nonconductive Particles
field intensity are created where the glass beads touch each other laterally. The yeast cells are preferentially concentrated by positive DEP in these regions. In both of these methods, switching off the field allows for the release and collection of the trapped particles and cells.
electrodes by dielectrophoresis. The chains confined to the surface assemble and crystallize into hexagonal particle crystals arrays, one axis of which is always aligned in the field direction (transverse to the electrode gap). This second slower crystallization stage is also driven by lateral attraction between the particle chains. The model for crystallization driven by a combination of induced dipole chaining and dielectrophoresis is supported both by direct microscopy observation and by reconstructing the structure from the laser diffraction pattern. The threshold field intensity for crystallization Eth of particles of different radii r has been measured at varying frequencies and shown to form a constant group Eth2 r2 =const as expected on the basis of Eqn. 1.11 [90].
The size of these switchable 2D crystals could be larger than 25 mm2. The laser diffraction patterns of all consecutively formed crystals are identical, which points out to the formation of a single crystal domain, unlike the multicrystalline materials assembled by convective deposition [89, 90]. If the field is turned off, the arrays disassemble within seconds as the particles diffuse out of the crystal plane. Thus, the electrically tunable crystallization can be used to make rudimentary optical switches. The transitions between ordered and disordered states can be repeated tens of times, although the quality of the crystals in the vicinity of the electrode edges slowly degrades due to the action of the AC electrokinetic flows. The precision of determining the lattice constant from the laser diffraction pattern is ≈10 nm, which allows quantifying how the electrolyte concentration can be used to tune the electrostatic repulsion between the spheres. Various combinations of DEP, EP and chaining forces are likely to find applications in more elaborate techniques for precise assembly of ordered structures [91].
circuit including the particle patch. More recently, silver enhancement of DNA strands functionalized with gold nanoparticles and complimentarily captured onto substrates have been used for detecting the presence of target DNA molecules [93, 94]. Zheng et al. describe the use of a lock-in-amplifier to measure the impedance of DNA and proteins trapped under positive DEP [95]. Electric measurements and detection is a natural combination to electric field assembly that reveals the full potential of on-chip devices.
1.3.3.2. Dielectrophoretic Assembly of Conducting Particles
The assembly of conducting colloidal particles provides means to making electrical microcircuits and other functional structures such as biosensors, DNA detecting probes, etc. The use of dielectrophoresis offers the combination of speed, easy control and precision that might not be readily available through the more traditional colloidal assembly techniques. Quantum dots (CdSe semiconductor nanoparticles), carbon nanotubes (CNT), gold nanoparticles, DNA and protein molecules and oligonucleotides functionalized with gold nanoparticles, metal nanowires and nanorods can all be assembled using dielectrophoresis between suitably spaced electrodes. The state of the art in the preparation and use of nanoparticles in different biological, electrical and optical applications is given, e.g., in recent reviews by Alivisatos [96] and Tang and Kotov [97]. The assembly of CNTs [98-106] and gold nanoparticle conjugated to DNA [94, 107], in particular, has been extensively studied due to their potential in biosensors.
1.3.4. AC Electrohydrodynamics
The external applied voltage at electrode surfaces modifies the native charge on the surface thereby leading to an "induced" zeta potential different from the intrinsic zeta potential. Furthermore, for AC fields the induced double layer charge changes sign synchronously with the electric field frequency. For example, in the next half-cycle for Fig. 1.8, the left electrode will have positive applied voltage which leads to accumulation of negative counterions in the double layer. Thus, the ions in the double layer have to move in and out of the layer during subsequent half-cycles of the electric field. This leads to induced zeta potentials that may be different for the positive and negative half-cycles of the AC field, but are always of sign same as that of the field applied to the electrodes [108]. The electric field is normal to electrode surface; however, there is a tangential component of the electric field at the electrode edges. The ions in the double layer then react to these tangential electric fields and lead to a bulk electrohydrodynamic flow directed towards the electrodes. Notably even though an AC field is applied, the bulk flow in different half cycles points in the same direction along the field gradient resulting in a net fluid flow.
As the applied electric field induces double layer formation and then leads to bulk fluid flow by acting on its own induced charge, these flows are also referred to as “Induced Charge Electro Osmosis (ICEO)” [109, 110]. AC EHD and electroosmosis are types of ICEO flows. The AC EHD flow velocity is given by
η ζ ε
ε indEt
u =− 0 (1.12)
where, ζind is the induced zeta potential due to the applied external field and Et is the tangential component of the electric field [111, 112].
As AC EHD is not dependent on the particle properties, it is suitable for application in µTAS devices where the liquid, rather than the particles is manipulated. Ramos et al. [113] were first to identify AC EHD flow generated at low frequencies (< 500 kHz) on microelectrode structures. During their experiments with latex particles undergoing positive DEP in a system with parallel finger electrodes, they observed that instead of concentrating at the electrode edges, where the field intensity is highest, the particles become collected on top of the electrodes. They attributed this flow to the interaction of the electric field with the ions in the double layer on top of the electrode. In their subsequent papers they made a detailed investigation of the EHD flow velocity as a function of field frequency and the position on the electrode and found that the particles are moving from the interelectrode gap towards the electrode [114] as demonstrated in Fig. 1.8. The particle velocity was found to be highest at the electrode edge and decreased as it moved across the electrode. The velocity was also found to depend on the frequency with a maximum occurring at a characteristic frequency and tending to zero at low and high frequencies [115].
Various particle-trapping techniques that use AC EHD have been developed. Chang et al. [118-120] designed impedance spectroscopy detectors that take advantage of AC EHD to rapidly concentrate bioparticles, leading to enhanced sensitivity due to reduction of the transport time to the detector. Chip designs that combine DEP with EHD flow for particle concentration have been extended by Hoettges et al. [121] and Wong et al. [122] Particle separation can also be achieved by utilizing the ability of negative DEP to levitate particles and thereby allowing EHD to form distinct patterns of collected particles [84].
1.4. Layout of this Thesis
The case for the use of electric fields for µTAS applications has been laid out in the preceding sections. My graduate research has focused on the manipulation and assembly of colloidal particles of any size scale using alternating electric fields as a way to develop new tools and techniques for µTAS. Chapter 2 describes the use of dielectrophoresis for assembling on-chip microwires from metallic nanoparticle suspensions. These wires can be used for in situ wet electronic circuits, for bioelectronic interfacing of live cells, as detectors for biosensors, and for anisotropic thermal and electrical conductors. Chapter 3 details the use of device where dielectrophoresis and AC electrohydrodynamics were combined to make a microfluidic device that collects and concentrates colloids from dilute suspensions. Latex microspheres, yeast cells, microbes and DNA strands were collected in patterned “corrals” in this device. A novel liquid-liquid microfluidic system that operates by manipulating floating liquid droplets using dielectrophoresis was developed. This novel system is presented in Chapter 4. This new chip allows performing chemical reactions, immuno-agglutination assays and forming “supraparticles”. Chapter 5 summarizes my graduate work and lays down areas conducive for extending this research, which can lead to new developments in the field of µTAS.
1.5. References
1. Stone, H. A. and Kim, S., Microfluidics: Basic Issues, Applications, and Challenges. AICHE J., 47: 1250-1254, 2001.
2. Hauptman, A. and Sharan, Y., Envisioned Developments in Nanobiotechnology, Interdisciplinary Center for Technology Analysis and Forecasting at Tel-Aviv University, Tel Aviv, 2006.
3. http://www.intel.com/technology/index.htm.
4. Terry, S. C., Jerman, J. H. and Angell, J. B., A Gas Chromatographic Air Analyzer Fabricated on a Silicon Wafer. IEEE Trans. Electron Devices, ED-26: 1880-1886, 1979.
5. Manz, A., Graber, N. and Widmer, H. M., Miniaturized Total Chemical Analysis Systems: A Novel Concept for Chemical Sensing. Sensor. Actuat. B - Chem., B1: 244-248, 1990.
7. Richter, A., Plettner, A., Hofmann, K. A. and Sandmaier, H., A Micromachined Electrohydrodynamic (EHD) Pump. Sensor. Actuat. A - Phys., 29: 159-168, 1991. 8. Liu, S. and Dasgupta, P. K., Flow Injection Analysis in the Capillary Format Using
Electroosmotic Pumping. Anal. Chim. Acta, 268: 1-6, 1992.
9. Harrison, D. J., Fluri, K., Seiler, K., Fan, Z. H., Effenhauser, C. S. and Manz, A., Micromachining a Miniaturized Capillary Electrophoresis-Based Chemical Analysis System on a Chip. Science, 261: 895-897, 1993.
10. Harrison, D. J., Glavina, P. G. and Manz, A., Towards Miniaturized Electrophoresis and Chemical Analysis Systems on Silicon: An Alternative to Chemical Sensors. Sensor. Actuat. B - Chem., 10: 107-116, 1993.
11. Manz, A., Effenhauser, C. S., Burggraf, N., Harrison, D. J., Seiler, K. and Fluri, K., Electroosmotic Pumping and Electrophoretic Separations for Miniaturized Chemical Analysis Systems. J. Micromech. Microeng., 4: 257-265, 1994.
12. Sanders, G. H. W. and Manz, A., Chip-Based Microsystems for Genomic and Proteomic Analysis. Trends Anal. Chem., 19: 364-378, 2000.
13. Reyes, D. R., Iossifidis, D., Auroux, P. A. and Manz, A., Micro Total Analysis Systems. 1. Introduction, Theory, and Technology. Anal. Chem., 74: 2623-2636, 2002.
14. Auroux, P. A., Iossifidis, D., Reyes, D. R. and Manz, A., Micro Total Analysis Systems. 2. Analytical Standard Operations and Applications. Anal. Chem., 74: 2637-2652, 2002.
15. Tudos, A. J., Besselink, G. A. J. and Schasfoort, R. B. M., Trends in Miniaturized Total Analysis Systems for Point-of-Care Testing in Clinical Chemistry. Lab Chip, 1: 83-95, 2001.
16. Huang, Y., Mather, E. L., Bell, J. L. and Madou, M., MEMS-Based Sample Preparation for Molecular Diagnostics. Anal. Bioanal. Chem., 372: 49-65, 2002.
17. Fung, D. Y. C., Rapid Methods and Automation in Microbiology. Comprehens. Rev. Food Sci. Food Safety, 1: 3-22, 2002.
18. Verpoorte, E., Microfluidic Chips for Clinical and Forensic Analysis. Electrophoresis, 23: 677-712, 2002.
19. Erickson, D. and Li, D. Q., Integrated Microfluidic Devices. Anal. Chim. Acta, 507: 11-26, 2004.
20. Auroux, P. A., Koc, Y., deMello, A., Manz, A. and Day, P. J. R., Miniaturised Nucleic Acid Analysis. Lab Chip, 4: 534-546, 2004.
21. Lee, S. J. and Lee, S. Y., Micro Total Analysis System (µ-TAS) in Biotechnology. Appl. Microbiol. Biotechnol., 64: 289-299, 2004.
23. Evans, D. F. and Wennerstrom, H., The Colloidal Domain: Where Physics, Chemistry and Biology Meet, 2nd edn., John Wiley & Sons Inc, New York, 1999.
24. Giersig, M. and Mulvaney, P., Preparation of Ordered Colloid Monolayers by Electrophoretic Deposition. Langmuir, 9: 3408-3413, 1993.
25. Holgado, M., Garcia-Santamaria, F., Blanco, A., Ibisate, M., Cintas, A., Miguez, H., Serna, C. J., Molpeceres, C., Requena, J., Mifsud, A., Meseguer, F. and Lopez, C., Electrophoretic Deposition to Control Artificial Opal Growth. Langmuir, 15: 4701-4704, 1999.
26. Rogach, A. L., Kotov, N. A., Koktysh, D. S., Ostrander, J. W. and Ragoisha, G. A., Electrophoretic Deposition of Latex-Based 3D Colloidal Photonic Crystals: A Technique for Rapid Production of High-Quality Opals. Chem. Mater., 12: 2721-2726, 2000.
27. Bailey, R. C., Stevenson, K. J. and Hupp, J. T., Assembly of Micropatterned Colloidal Gold Thin Films Via Microtransfer Molding and Electrophoretic Deposition. Adv. Mater., 12: 1930-1934, 2000.
28. Sun, J., Gao, M. and Feldman, J., Electric Field Directed Layer-by-Layer Assembly of Highly Fluorescent CdTe Nanoparticles. J. Nanosci. Nanotech., 1: 133-136, 2001. 29. Gu, Z. Z., Hayami, S., Kubo, S., Meng, Q. B., Einaga, Y., Tryk, D. A., Fujishima, A.
and Sato, O., Fabrication of Structured Porous Film by Electrophoresis. J. Am. Chem. Soc., 123: 175-176, 2001.
30. Gao, M., Sun, J., Dulkeith, E., Gaponik, N., Lemmer, U. and Feldman, J., Lateral Patterning of CdTe Nanocrystal Films by the Electric Field Directed Layer-by-Layer Assembly Method. Langmuir, 18: 4098-4102, 2002.
31. Wang, Y. C., Leu, I. C. and Hon, M. H., Effect of Colloid Characteristics on the Fabrication of ZnO Nanowire Arrays by Electrophoretic Deposition. J. Mater. Chem., 12: 2439-2444, 2002.
32. Kershner, R. J., Bullard, J. W. and Cima, M. J., The Role of Electrochemical Reactions During Electrophoretic Particle Deposition. J. Colloid Interf. Sci., 278: 146-154, 2004.
33. Golding, R. K., Lewis, P. C. and Kumacheva, E., In Situ Study of Colloid Crystallization in Constrained Geometry. Langmuir, 20: 1414-1419, 2004.
34. Choi, W. M. and Park, O., The Fabrication of Micropatterns of a 2d Colloidal Assembly by Electrophoretic Deposition. Nanotechnology, 17: 325-329, 2006.
35. Wang, N., Lin, H., Li, J. B., Yang, X. Z. and Chi, B., Electrophoretic Deposition and Optical Property of Titania Nanotubes Films. Thin Solid Films, 496: 649-652, 2006. 36. Comiskey, B., Albert, J. D., Yoshizawa, H. and Jacobson, J., An Electrophoretic Ink
for All-Printed Reflective Electronic Displays. Nature, 394: 253-255, 1998.
Displays: Large-Area Rubber-Stamped Plastic Sheets of Electronics and Microencapsulated Electrophoretic Inks. P. Natl. Acad. Sci. USA, 98: 4835-4840, 2001.
38. Haswell, S. J., Development and Operating Characteristics of Micro Flow Injection Analysis Systems Based on Electroosmotic Flow - a Review. Analyst, 122: 1R-10R, 1997.
39. Barz, D. P. J. and Ehrhard, P., Model and Verification of Electrokinetic Flow and Transport in a Micro-Electrophoresis Device. Lab Chip, 5: 949-958, 2005.
40. Jacobson, S. C., McKnight, T. E. and Ramsey, J. M., Microfluidic Devices for Electrokinetically Driven Parallel and Serial Mixing. Anal. Chem., 71: 4455-4459, 1999.
41. Morf, W. E., Guenat, O. T. and de Rooij, N. F., Partial Electroosmotic Pumping in Complex Capillary Systems. Part 1: Principles and General Theoretical Approach. Sensor. Actuat. B - Chem., 72: 266-272, 2001.
42. Guenat, O. T., Ghiglione, D., Morf, W. E. and de Rooij, N. F., Partial Electroosmotic Pumping in Complex Capillary Systems. Part 2: Fabrication and Application of a Micro Total Analysis System (µTAS) Suited for Continuous Volumetric Nanotitrations. Sensor. Actuat. B - Chem., 72: 273-282, 2001.
43. Moosavi, H. S., Tang, T. and Harrison, D. J., Electroosmotic Pumping of Organic Solvents and Reagents in Microfabricated Reactor Chips. J. Am. Chem. Soc., 119: 8716-8717, 1997.
44. Jorgenson, J. W. and Lukacs, K. D., Capillary Zone Electrophoresis. Science, 222: 266-272, 1983.
45. Grossman, P. D. and Colburn, J. C., eds., Capillary Electrophoresis: Theory & Practice, Academic Press, San Diego, 1992.
46. Polson, N. A. and Hayes, M. A., Electroosmotic Flow Control of Fluids on a Capillary Electrophoresis Microdevice Using an Applied External Voltage. Anal. Chem., 72: 1088-1092, 2000.
47. Culbertson, C. T., Ramsey, R. S. and Ramsey, J. M., Electroosmotically Induced Hydraulic Pumping on Microchips: Differential Ion Transport. Anal. Chem., 72: 2285-2291, 2000.
48. McKnight, T. E., Culbertson, C. T., Jacobson, S. C. and Ramsey, J. M., Electroosmotically Induced Hydraulic Pumping with Integrated Electrodes on Microfluidic Devices. Anal. Chem., 73: 4045-4049, 2001.
49. Pohl, H. A., The Motion and Precipitation of Suspensoids in Divergent Electric Fields. J. Appl. Phys., 22: 869-871, 1951.
51. Pethig, R., Huang, Y., Wang, X. B. and Burt, J. P. H., Positive and Negative Dielectrophoretic Collection of Colloidal Particles Using Interdigitated Castellated Microelectrodes. J. Phys. D. Appl. Phys., 25: 881-888, 1992.
52. Muller, T., Gerardino, A., Schnelle, T., Shirley, S. G., Bordoni, F., DeGasperis, G., Leoni, R. and Fuhr, G., Trapping of Micrometre and Sub-Micrometre Particles by High-Frequency Electric Fields and Hydrodynamic Forces. J. Phys. D. Appl. Phys., 29: 340-349, 1996.
53. Fuhr, G., Muller, T., Schnelle, T., Hagedorn, R., Voigt, A., Fiedler, S., Arnold, W. M., Zimmermann, U., Wagner, B. and Heuberger, A., Radiofrequency Microtools for Particle and Live Cell Manipulation. Naturwissenchaften, 81: 528-535, 1994.
54. Giner, V., Sancho, M., Lee, R. S., Martinez, G. and Pethig, R., Transverse Dipolar Chaining in Binary Suspensions Induced by RF Fields. J. Phys. D. Appl. Phys., 32: 1182-1186, 1999.
55. Kretschmer, R. and Fritzsche, W., Pearl Chain Formation of Nanoparticles in Microelectrode Gaps by Dielectrophoresis. Langmuir, 20: 11797-11801, 2004.
56. Washizu, M. and Kurosawa, O., Electrostatic Manipulation of DNA in Microfabricated Structures. IEEE T. Ind. Appl., 26: 1165-1172, 1990.
57. Washizu, M., Suzuki, M., Kurosawa, O., Nishizaka, T. and Shinohara, T., Molecular Dielectrophoresis of Biopolymers. IEEE T. Ind. Appl., 30: 835-843, 1994.
58. Washizu, M., Kurosawa, O., Arai, I., Suzuki, S. and Shimamoto, N., Applications of Electrostatic Stretch-and-Positioning of DNA. IEEE T. Ind. Appl., 31: 447-456, 1995. 59. Suzuki, S., Yamanashi, Tazawa, S., Kurosawa, O. and Washizu, M., Quantitative
Analysis of DNA Orientation in Stationary AC Electric Fields Using Fluorescence Anisotropy. IEEE T. Ind. Appl., 34: 75-83, 1998.
60. Kawabata, T. and Washizu, M., Dielectrophoretic Detection of Molecular Bindings. IEEE T. Ind. Appl., 37: 1625-1633, 2001.
61. Asbury, C. L., Diercks, A. H. and van den Engh, G., Trapping of DNA by Dielectrophoresis. Electrophoresis, 23: 2658-2666, 2002.
62. Chou, C. F., Tegenfeldt, J. O., Bakajin, O., Chan, S. S., Cox, E. C., Darnton, N., Duke, T. and Austin, R. H., Electrodeless Dielectrophoresis of Single- and Double-Stranded DNA. Biophys. J., 83: 2170-2179, 2002.
63. Fuhr, G., Arnold, W. M., Hagedorn, R., Muller, T., Benecke, W., Wagner, B. and Zimmermann, U., Levitation, Holding, and Rotation of Cells within Traps Made by High-Frequency Fields. Biochim. Biophys. Acta, 1108: 215-223, 1992.
64. Fiedler, S., Shirley, S. G., Schnelle, T. and Fuhr, G., Dielectrophoretic Sorting of Particles and Cells in a Microsystem. Anal. Chem., 70: 1909-1915, 1998.
66. Heida, T., Rutten, W. L. C. and Marani, E., Understanding Dielectrophoretic Trapping of Neuronal Cells: Modelling Electric Field, Electrode-Liquid Interface and Fluid Flow. J. Phys. D. Appl. Phys., 35: 1592-1602, 2002.
67. Huang, Y., Joo, S., Duhon, M., Heller, M., Wallace, B. and Xu, X., Dielectrophoretic Cell Separation and Gene Expression Profiling on Microelectronic Chip Arrays. Anal. Chem., 74: 3362-3371, 2002.
68. Gascoyne, P., Mahidol, C., Ruchirawat, M., Satayavivad, J., Watcharasit, P. and Becker, F. F., Microsample Preparation by Dielectrophoresis: Isolation of Malaria. Lab Chip, 2: 70-75, 2002.
69. Minerick, A. R., Ostafin, A. E. and Chang, H. C., Electrokinetic Transport of Red Blood Cells in Microcapillaries. Electrophoresis, 23: 2165-2173, 2002.
70. Minerick, A. R., Zhou, R. H., Takhistov, P. and Chang, H. C., Manipulation and Characterization of Red Blood Cells with Alternating Current Fields in Microdevices. Electrophoresis, 24: 3703-3717, 2003.
71. Frenea, M., Faure, S. P., Le Pioufle, B., Coquet, P. and Fujita, H., Positioning Living Cells on a High-Density Electrode Array by Negative Dielectrophoresis. Mater. Sci. Eng. C - Bio. S., 23: 597-603, 2003.
72. Prasad, S., Yang, M., Zhang, X., Ozkan, C. S. and Ozkan, M., Electric Field Assisted Patterning of Neuronal Networks for the Study of Brain Functions. Biomed. Microdevices, 5: 125-137, 2003.
73. Manaresi, N., Romani, A., Medoro, G., Altomare, L., Leonardi, A., Tartagni, M. and Guerrieri, R., A CMOS Chip for Individual Cell Manipulation and Detection. IEEE J. Solid-St. Circ., 38: 2297-2305, 2003.
74. Verduzco-Luque, C. E., Alp, B., Stephens, G. M. and Markx, G. H., Construction of Biofilms with Defined Internal Architecture Using Dielectrophoresis and Flocculation. Biotechnol. Bioeng., 83: 39-44, 2003.
75. Gray, D. S., Tan, J. L., Voldman, J. and Chen, C. S., Dielectrophoretic Registration of Living Cells to a Microelectrode Array. Biosens. Bioelectron., 19: 1765-1774, 2004. 76. Pohl, H. A. and Hawk, I., Separation of Living and Dead Cells by Dielectrophoresis.
Science, 152: 647-649, 1966.
77. Huang, Y., Holzel, R., Pethig, R. and Wang, X. B., Differences in the AC Electrodynamics of Viable and Non-Viable Yeast Cells Determined through Combined Dielectrophoresis and Electrorotation Studies. Phys. Med. Biol., 37: 1499-1517, 1992.
78. Huang, Y., Wang, X. B., Becker, F. F. and Gascoyne, P., Introducing Dielectrophoresis as a New Force Field for Field-Flow Fractionation. Biophys. J., 73: 1118-1129, 1997.
80. Gascoyne, P. R. C. and Vykoukal, J., Particle Separation by Dielectrophoresis. Electrophoresis, 23: 1973-1983, 2002.
81. Suehiro, J., Hamada, R., Noutomi, D., Shutou, M. and Hara, M., Selective Detection of Viable Bacteria Using Dielectrophoretic Impedance Measurement Method. J. Electrostat., 57: 157-168, 2003.
82. Astorga-Wells, J., Vollmer, S., Tryggvason, S., Bergman, T. and Jornvall, H., Microfluidic Electrocapture for Separation of Peptides. Anal. Chem., 77: 7131-7136, 2005.
83. King, M. R., Lomakin, O. A., Ahmed, R. and Jones, T. B., Size-Selective Deposition of Particles Combining Liquid and Particulate Dielectrophoresis. J. Appl. Phys., 97: 054902, 2005.
84. Zhou, H., White, L. R. and Tilton, R. D., Lateral Separation of Colloids or Cells by Dielectrophoresis Augmented by AC Electroosmosis. J. Colloid Interf. Sci., 285: 179-191, 2005.
85. Auerswald, J. and Knapp, H. F., Quantitative Assessment of Dielectrophoresis as a Micro Fluidic Retention and Separation Technique for Beads and Human Blood Erythrocytes. Microelectron. Eng., 67-8: 879-886, 2003.
86. Bennett, D. J., Khusid, B., James, C. D., Galambos, P. C., Okandan, M., Jacqmin, D. and Acrivos, A., Combined Field-Induced Dielectrophoresis and Phase Separation for Manipulating Particles in Microfluidics. Appl. Phys. Lett., 83: 4866-4868, 2003.
87. Suehiro, J., Zhou, G. B., Imamura, M. and Hara, M., Dielectrophoretic Filter for Separation and Recovery of Biological Cells in Water. IEEE. T. Ind. Appl., 39: 1514-1521, 2003.
88. Velev, O. D. and Lumsdon, S. O., in Handbook of Surfaces and Interfaces of Materials, ed. Nalwa, H. S., Academic Press, San Diego, 2002, vol. 3, pp. 125-163. 89. Lumsdon, S. O., Kaler, E. W., Williams, J. P. and Velev, O. D., Dielectrophoretic
Assembly of Oriented and Switchable Two-Dimensional Photonic Crystals. Appl. Phys. Lett., 82: 949-951, 2003.
90. Lumsdon, S. O., Kaler, E. W. and Velev, O. D., Two-Dimensional Crystallization of Microspheres by a Coplanar AC Electric Field. Langmuir, 20: 2108-2116, 2004.
91. Velev, O. D., in Colloids and Colloid Assemblies, ed. Caruso, F., Wiley VCH, Weinheim, 2004, pp. 437-464.
92. Velev, O. D. and Kaler, E. W., In Situ Assembly of Colloidal Particles into Minaturized Biosensors. Langmuir, 15: 3693-3698, 1999.
93. Moller, R., Csaki, A., Kohler, J. M. and Fritzsche, W., Electrical Classification of the Concentration of Bioconjugated Metal Colloids after Surface Adsorption and Silver Enhancement. Langmuir, 17: 5426-5430, 2001.