DOI: 10.1534/genetics.106.064386
The Rate, Not the Spectrum, of Base Pair Substitutions Changes at a
GC-Content Transition in the Human
NF1
Gene Region:
Implications for the Evolution of the Mammalian
Genome Structure
Claudia Schmegner, Josef Hoegel, Walther Vogel and Gu
¨nter Assum
1Institut fu¨r Humangenetik, Universita¨t Ulm, D-89081 Ulm, Germany Manuscript received August 4, 2006
Accepted for publication October 11, 2006
ABSTRACT
The human genome is composed of long stretches of DNA with distinct GC contents, called isochores or GC-content domains. A boundary between two GC-content domains in the humanNF1gene region is also a boundary between domains of early- and late-replicating sequences and of regions with high and low re-combination frequencies. The perfect conservation of the GC-content distribution in this region between human and mouse demonstrates that GC-content stabilizing forces must act regionally on a fine scale at this locus. To further elucidate the nature of these forces, we report here on the spectrum of human SNPs and base pair substitutions between human and chimpanzee. The results show that the mutation rate changes exactly at the GC-content transition zone from low values in the GC-poor sequences to high values in GC-rich ones. The GC content of the GC-poor sequences can be explained by a bias in favor of GC.AT mutations, whereas the GC content of the GC-rich segment may result from a fixation bias in favor of AT.GC sub-stitutions. This fixation bias may be explained by direct selection by the GC content or by biased gene conversion.
T
HE mammalian genome is not uniform in its long-range sequence composition, it is a mosaic of se-quence stretches of variable length that differ widely in their GC contents. Whether the majority of these stretches really meet the criteria of isochores, as de-fined by Bernardi(2000), or should be better called GC-content domains, as suggested by Lander et al. (2001), is a matter of debate at the moment (Li2002; Liet al. 2003; Zhangand Zhang2004; Cohenet al. 2005; Costantiniet al. 2006). Irrespective of this discussion, a correlation exists between the long-range GC content of DNA sequences and the structure of chromosomes on the one hand and a number of other structural and functional genomic features on the other (Holmquist 1992). Regarding chromosome structure, it became ap-parent that G-bands are composed of mostly GC-poor sequences, whereas R-bands are built up mostly of GC-rich sequences (Sacconeet al. 1993). Furthermore, the long-range GC content of genomic regions is cor-related with gene density, the distribution of repetitive elements (Lander et al. 2001), replication timing (Watanabeet al. 2002; Woodfineet al. 2004), and re-combination frequency (Konget al. 2002). The evolu-tionary stability of the GC-content distribution has been
demonstrated for a limited number of homologous genes in several species (Bernardi 2000; Federico
et al. 2004) and, on a genomewide level, for mice and humans (Waterstonet al. 2002). In both cases, GC-rich sequences from one genome were also demon-strated to be GC-rich in the other genome and vice versa. A very fine-scaled conservation of the GC content was demonstrated for the NF1gene region in humans and mice. In both species, theNF1gene is located in a GC-poor sequence domain several hundred kilobases in length, whereas the neighboringRAB11FIP4gene is located in a GC-rich domain of similar length. The boundaries between the two domains are sharp and located at exactly the same place in both species (Schmegneret al. 2005a). The evolutionary stability of the genome structure in mice and humans may be explained by hitherto unknown forces, which exert their effects to stabilize the structure of the mammalian genome. As candidates for these forces three mecha-nisms are under discussion,i.e., direct selection on the long-range GC content of sequences, regional variation in mutation biases, and biased gene conversion (for review see Eyre-Walkerand Hurst 2001). However, results published recently suggest that the mammalian genome is not in a compositional equilibrium; in par-ticular, the GC-rich domains are vanishing (Duretet al. 2002; Arndtet al. 2003; Belleet al. 2004; Meunierand Duret2004; Comeron2006; Khelifiet al. 2006). This
1Corresponding author: Institut fu¨r Humangenetik, Universita¨t Ulm, Albert-Einstein-Allee 11, D-89081 Ulm, Germany.
E-mail: [email protected]
led to a model according to which the GC-content domains evolved in the common ancestors of reptiles, birds, and mammals and henceforth the GC-content differences have been slowly eroding, at least in the mammalian lineage. In this case, the similarities in the GC-content distribution in the human and mouse genome would not result from an active process, but would simply reflect the common ancestry of the two species. This does not necessarily mean that the GC-content stabilizing forces are no longer active; they may merely be too weak to maintain the GC-rich domains, as suggested by Duretet al. (2002).
On a fine scale, the correlation between DNA-sequence composition and functional genomic features has been demonstrated for a few regions in which the long-range GC content changes abruptly. In humans, GC-content transitions located in theNF1gene region
on chromosome 17 and in the MN1/PITPNB gene
region on chromosome 22 are also demonstrated to be boundaries between regions showing high and low recombination frequencies (Eisenbarth et al. 2000, 2001). Boundaries between early- and late-replicating sequences were found to coincide precisely with GC-content transitions in the humanMHClocus (Tenzen
et al. 1997) and again in theNF1gene locus (Schmegner
et al. 2005a). Interestingly, both the replication timing during S phase and the recombination frequency of a sequence are supposed to influence the composition of DNA sequences (Eyre-Walker and Hurst 2001), the former through changes in the spectrum of base mis-incorporations during S phase and the latter through two possible mechanisms. The first is based on a postulated correlation between the recombination frequency in a genomic region, the mutation rate, and perhaps the mutation spectrum. The second mechanism derives from the following fact: Recombination and gene conversion are mechanistically connected in a manner by which sequences with different recombination rates ought also to have different conversion rates. Since gene conversion has been shown to be a biased process (Galtier2003), regional variation of conversion rates probably results in regionally varying patterns of evolutionarily fixed muta-tions. In summary, it can be assumed that the analysis of genetic variability patterns within a species and of fixed differences between species not only reveals whether GC-rich and GC-poor sequences are in a compositional equilibrium, but also allows for the differentiation be-tween the actions of the stabilizing forces mentioned above. Moreover, the variability patterns, if they result from processes relevant for the local differentiation of the GC content, probably differ according to the GC content of DNA sequences and change at GC-content transitions. For this reason, we analyzed the frequency and the spectrum of polymorphic sites in the human and of fixed mutational differences between human and chimpanzee in DNA sequences located around the GC-content tran-sition in theNF1gene region.
MATERIALS AND METHODS
Probands and cell lines: DNA from 29 randomly chosen human probands of self-reported German origin was isolated from peripheral blood. The project was approved by the local ethics committee. DNA from chimpanzee, orangutan, and gorilla was isolated from thePan troglodyteslymphoblastoid cell linePTR-EB176 (ECACC no. 89072704), the orangutan (Pongo pygmaeus) lymphoblastoid cell line PPY-EB185 (ECACC no. 89072705), and the lymphoblastoid cell line EB( JC) (ECACC no. 89072703) fromGorilla gorilla, which were purchased from the European Collection of Cell Cultures (http://www.ecacc. org.uk).
Resequencing:Overlapping primers for PCR were designed to span four different, mainly intronic, parts of theNF1gene, which altogether comprised 24.9 kb, plus two intronic parts of the neighboringRAB11FIP4gene, which comprised 19.8 kb. The locations of the sequenced regions within theNF1and the RAB11FIP4gene are given in Figure 1A. The average amplicon size used was 2.5 kb, and the average overlap between neigh-boring amplicons was 100 bp. These PCRs were performed using genomic DNA from all 29 human probands, as well as genomic DNA of one chimpanzee, one gorilla, and one orangutan. Samples were sequenced using Big-Dye Terminator chemistry (Applied Biosystems, Foster City, CA) on an ABI 3100 analyzer. Each PCR amplicon was sequenced from both ends and with at least eight additional internal primers to cover the whole 2.5 kb. Sequence data were assembled and compared using the Seq-Scape software (Applied Biosystems), and the entire sequence chromatograms were visually inspected.
Statistics:For the change-point analysis of the distributions of the GC contents and the interspecies divergence, a standard approach as described by Hawkins and Qiu (2003) was applied. This approach assumes normally distributed obser-vations and at most one change point in the mean value along the sequence. To this end, all possible two-group comparisons between two adjacent value windows were carried out. The minimum size of each window comprised five values of the respective curve;i.e., the first comparison is between values 1–5 and 6–60 with a partition at nucleotide position 25 kb (Figure 1). The partition for the second comparison takes place at nucleotide position 30 kb, and so on, until the last partition is at nucleotide position 275 kb. For all of the 51 tests, the values of thet-test statistic (allowing for variance heterogene-ity) as well as the correspondingP-values were recorded and a Bonferroni correction for 51 tests was carried out. The position where thet-test statistic takes its maximum value (see Figure 1B) is a guess of a potential change point.
One-way chi-square tests were used to compare frequencies of mutations to a model distribution. This model distribution was either 0.5:0.5, when investigating if the frequencies of two types of mutations were equal, or the actual GC:AT content of a sequence,i.e., 0.37:0.63 in the GC-poor domain and 0.51:0.49 in the GC-rich domain. To compare the ratio of AT.GC and GC.AT mutation frequencies (mutations that change an AT into a GC base pair or vice versa) between the domains which is adjusted for the AT contents and the GC contents of the underlying sequences, a test based on the logarithm of the odds ratio for an AT.GC mutation between the domains was used. For adjustment, the model under the null hypothesis claimed an odds ratio of (0.63:0.37)/(0.49:0.51) between the domains. The same procedure was applied to compare SNPs and fixed mutations, with a model odds ratio of 1.
RESULTS
we measured the interspecies divergence of altogether 300 kb of homologous noncoding sequences between human and chimpanzee. As only base pair exchanges were taken into account, the term divergence as used here applies only to a part of the overall genomic differences found between human and chimpanzee. For our comparisons, we used the human sequence AC004526 and the homologous chimpanzee sequen-ces, which are located on chimpanzee chromosome 19 between nucleotide position 30.00 Mb and 30.30 Mb (ensemble chimpanzee sequence release 31.2a). This chimpanzee sequence is composed of a number of contigs with just a few small gaps. A sliding window of 5 kb was moved in nonoverlapping 5-kb steps along the human sequence, and thus for each window the GC contents of human and orthologous chimpanzee se-quences were determined. The resulting GC-content curves for the two species are given in Figure 1A—they are almost, but not exactly identical. The values ob-tained for the windows around positions 175.5 and 212.5 kb differ to a larger degree between the species (4.5 difference percentage points each). The differ-ences are due to an adenylate kinase 3 pseudogene, present in one window of the human but not found in the chimpanzee genome, in addition to a 1.3-kb gap in the other window of the chimpanzee sequence. In addition to the GC content, the relative frequency of divergent sites was calculated for each window. The values obtained are given graphically in Figure 1A. For this analysis, only intergenic and intronic sequences
with a distance of.50 bp to the next coding exon were used. Nevertheless, varying sequence lengths between the windows are supposed to be negligible, since only the homologous sequences of each window were com-pared. Regarding the GC-content curves in Figure 1A, the sharp GC-content transition located in the inter-genic region between NF1 and RAB11FIP4 is clearly visible. In the same region, a transition from low to high values of sequence divergence occurs, with an average divergence of 0.82% in the GC-poor and 1.19% in the GC-rich region. To decide whether the observed distri-butional changes of GC content and divergence along the sequence are compatible with random variation and, if not, to specify a region where a change takes place, a statistical change-point analysis was performed. The advantage of this method is that, in addition to no prespecified regions being compared, a candidate position for a change between regions is estimated. For the GC content in human and chimpanzee, and for the divergence, change points were observed, which represent actual changes on the 5% level. Visual in-spection of thet-value curves given in Figure 1B actually results in the detection of a transition zone of 20 kb where changes of both features, the GC content of the sequences and the interspecies divergence, might oc-cur. The strongest change in the GC content could be assigned to the window around nucleotide position 212.5 kb; this coincides precisely with the strongest change in the interspecies divergence and hence in the substitution rates between GC-poor and GC-rich
sequences immediately contacting each other. The boundaries between the GC-content domains and the domains with differing divergences coincide precisely. Under the assumption of a neutral evolution (the reasons for this assumption are discussed below), the observed regional differences in the substitution fre-quencies can be interpreted as the result of regionally differing mutation rates.
When neutrally evolving sequences are analyzed in a homogeneous population, mutation-rate differences are expected to result in differing SNP densities. To elucidate the SNP densities in both GC-content do-mains, we resequenced 24.9 kb of intronic sequences from the GC-poor and 19.8 kb from the GC-rich regions in 29 randomly chosen probands of German origin. The sequenced regions (depicted in Figure 1A) were chosen without prior knowledge of GC content or interspecies divergence. The process of resequencing was chosen because reliable SNP densities can hardly be obtained from SNP databases due to varying methods of SNP ascertainment used by the submitters. All told, in our sample of 58 chromosomes, 47 variable sites were de-tected in the 24.9 kb ofNF1and 71 variable sites in the 19.8 kb ofRAB11FIP4. This results in SNP densities of 1.89 SNPs/kb inNF1and 3.58 SNPs/kb inRAB11FIP4, a difference that also points to mutation-rate differ-ences between the GC-rich and the GC-poor domains.
Next, we wanted to analyze whether or not the spectrum of base pair-changing mutations differs be-tween the two GC-content domains. As it is not possible to directly observe the spectrum of mutations by which a DNA sequence is affected, the spectrum of SNPs found in the human population was used in place of the mu-tation spectrum. SNPs represent evolutionarily young mutation events. The SNP spectrum is therefore sup-posed to resemble the mutation spectrum with only minor disturbances. For the analysis we used validated noncoding SNPs, from the dbSNP database, located in a 320-kb region around the GC-content transition at the NF1 locus. The ancestral allele for each SNP was determined through comparisons with the chimpanzee sequence. All SNPs were categorized into four groups: SNPs resulting from mutations that changed an AT base pair into a GC base pair (AT.GC), a GC into an AT (GC.AT), an AT into an TA (AT.TA), and a GC into
a CG (GC . CG). GC-rich and GC-poor sequence
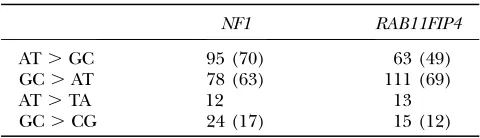
domains were analyzed separately. As a boundary between the domains, the 5-kb window with the peak in thet-value curve of the GC content (window around nucleotide position 212.5 kb in Figure 1) was used. The results given in Table 1 demonstrate that the SNP pattern is
clearly dominated by AT . GC and GC . AT SNPs,
which together are called GC-content-changing SNPs in the following text. Henceforth, only this category of SNPs is regarded, because this is the only one that is relevant for the evolution of the GC content of a sequence.
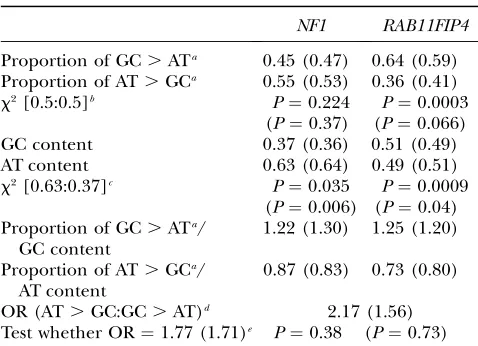
If the mutational input is responsible for the evolu-tionary stability of the GC content of a sequence, the number of GC.AT mutations is expected to be equal to the number of AT.GC mutations in this sequence, irrespective of its GC content. Therefore, in both do-mains a one-way chi-square test was used to determine
whether the observed proportions of GC . AT and
AT. GC SNPs are compatible with the assumption of equality. The results (given in Table 2) demonstrated that the assumption of equal proportions of GC.AT and AT.GC SNPs cannot be rejected for the GC-poor
domain (45% GC.AT:55% AT.GC in
GC-content-changing SNPs;P¼0.224), whereas a significant devia-tion from the assumpdevia-tion of equality was observed when SNPs from the GC-rich domain were analyzed, with an excess of GC.AT over AT. GC SNPs (64% GC.AT:36% AT.GC in GC-content-changing SNPs;
P¼0.0003). This excess may be mainly due to a high proportion of GC.AT SNPs resulting from mutations at CpG sites. If this type of SNP is excluded from the analysis, an excess of GC.AT over AT.GC SNPs is still observed in the GC-rich domain, but the differences are no longer statistically significant. (The values obtained under exclusion of SNPs at CpG sites are given in parentheses in Tables 1 and 2.) In the same way, the proportions of GC.AT and AT.GC SNPs were com-pared to the proportions of GC and AT base pairs in both domains. In this case, a significant excess of GC.
AT over AT.GC SNPs was found in both the GC-poor
region (45% GC . AT:55% AT. GC in
GC-content-changing SNPs in relation to 37% GC:63% AT; P ¼
0.035) and the GC-rich region (64% GC . AT:36%
AT. GC in GC-content-changing SNPs in relation to 51% GC:49% AT;P¼0.0009), irrespective of the in- or exclusion of SNPs at CpG sites. This excess can also be demonstrated by normalizing the proportions of GC.
AT SNPs by the GC content of the domains and the proportion of AT . GC SNPs by the AT content. For results see Table 2. Furthermore, the ratios of AT.GC to GC.AT SNP frequencies did not differ significantly between the GC-content domains when the GC-content differences were taken into account (observed odds ratio¼2.15, model odds ratio¼1.77;P¼0.38). Taken together, our results revealed the same mutational bias
TABLE 1
Spectrum of noncoding SNPs from dbSNP
NF1 RAB11FIP4
AT.GC 95 (70) 63 (49)
GC.AT 78 (63) 111 (69)
AT.TA 12 13
GC.CG 24 (17) 15 (12)
in favor of GC.AT over AT.GC mutations in both GC-content domains.
To test whether the sequences of both domains are in a compositional equilibrium, we performed a similar analysis on the basis of fixed base pair substitutions observed between human and chimpanzee. For this purpose, we sequenced the same stretches of DNA as mentioned above from the chimpanzee genome and compared the sequences to homologous GenBank se-quences of the human. In addition, homologous DNA fragments from the gorilla and the orangutan were sequenced and used as an outgroup to define the ancestral state of the divergent base pairs found in the human–chimpanzee comparison and, in consequence, to determine the direction of the substitutions. The results are given in Table 3. For both the GC-rich and the GC-poor sequences, a one-way chi-square test was used to analyze whether the proportions of AT . GC and GC.AT substitutions are compatible with the assump-tion of equality. In this case, in contrast to results obtained with the SNP data, the assumption of equal proportions of AT . GC and GC . AT substitutions could not be rejected for both GC-content domains (49:51% in GC-content-changing substitutions,P¼0.94 for the GC-poor, and 44:56% in GC-content-changing substitutions, P ¼ 0.11 for the GC-rich parts). These results demonstrate that the sequences in both domains
are in or close to a compositional equilibrium despite the absolute excess of GC.AT mutations found in the GC-rich domain.
DISCUSSION
Our analysis of the sequence diversity in theNF1gene region revealed low levels of interspecies divergence and SNP densities in the GC-poor parts, with high lev-els for both features in the GC-rich parts. A general correlation between GC content and divergence has also been reported for whole-genome comparisons of human and mouse and of human and chimpanzee (Waterston et al. 2002; Mikkelsen et al. 2005). In-terspecies divergence and SNP densities are influenced by the mutation rate, by selection on the function of proteins encoded in the region, and possibly by selec-tion on the GC content as well. The potential influence of purifying selection on the obtained values for in-terspecies divergence and SNP densities due to protein function was minimized by the exclusion of coding and exon-flanking sequences from the analysis. Regarding SNP densities, the low values obtained for the GC-poor
NF1 gene may have also resulted from an evolution-arily recent selective sweep, which, due to the linkage disequilibrium pattern in the region, may have influ-enced the wholeNF1gene but not the neighboring GC-rich sequences. However, the variability pattern of the
NF1 gene in the European population (Schmegner
et al. 2005b) clearly excludes this possibility. Therefore, the observed pattern of diversity and substitutions in the NF1 gene region most likely reflects differences in the mutation rates between the GC-poor and GC-rich sequence domains. A possible reason for the mutation-rate differences may be a higher density of hypermuta-ble CpG sites in the GC-rich region as compared to the GC-poor region. Reanalysis of the data under elimina-tion of SNPs and substituelimina-tions involving CpG sites resulted in a reduction of SNP densities (from 1.89 to 1.24 SNPs/kb in the GC-poor and from 3.58 to 2.47 SNPs/kb in the GC-rich domain) and interspecies di-vergence (from 0.76 to 0.57% in the GC-poor and from 1.14 to 0.79% in the GC-rich domain), but not in an erosion of the differences between the domains.
TABLE 2
Statistical analysis of the collected SNP data
NF1 RAB11FIP4
Proportion of GC.ATa 0.45 (0.47) 0.64 (0.59) Proportion of AT.GCa 0.55 (0.53) 0.36 (0.41)
x2[0.5:0.5]b P¼0.224 P¼0.0003 (P¼0.37) (P¼0.066)
GC content 0.37 (0.36) 0.51 (0.49)
AT content 0.63 (0.64) 0.49 (0.51)
x2[0.63:0.37]c P¼0.035 P¼0.0009 (P¼0.006) (P¼0.04) Proportion of GC.ATa/
GC content
1.22 (1.30) 1.25 (1.20)
Proportion of AT.GCa/ AT content
0.87 (0.83) 0.73 (0.80)
OR (AT.GC:GC.AT)d 2.17 (1.56) Test whether OR¼1.77 (1.71)e P¼0.38 (P¼0.73)
Values in parentheses are obtained under exclusion of SNPs at CpG sites.
a
With respect to the GC-content-changing SNPs. b
Test whether the true ratio of AT.GC and GC.AT mu-tations is 0.5:0.5.
c
Test whether the true ratio of AT.GC and GC.AT mu-tations is 0.63:0.37.
d
Odds ratio of AT . GC mutation between NF1 and RAB11FIP4.
e
Test whether the true odds ratio of AT.GC mutation be-tweenNF1andRAB11FIP4¼(0.63/0.37)/(0.49/0.51)¼1.77 (0.71).
TABLE 3
Spectrum of fixed base pair substitutions between human and chimpanzee
NF1 RAB11FIP4
AT.GC 77 (55) 83 (55)
GC.AT 75 (55) 106 (71)
AT.TA 12 8
GC.CG 23 (16) 30 (17)
Hence, mutations of CpG dinucleotides contribute substantially to the numbers of polymorphic and di-vergent sites in both domains, although they do not explain the mutation-rate differences.
The analysis of the GC content and the human– chimpanzee divergence in a sliding window of 5 kb showed that both characteristics change abruptly within the same narrow transition region. Results published earlier and the inspection of HapMap data (I nter-nationalHapMapConsortium2005) assigned change
points for the recombination frequency (Eisenbarth
et al. 2000) and the timing of replication (Schmegner
et al. 2005a) to this same transition region. Taken together, these results demonstrate a covariation of all four features—GC content, mutation rate, recombina-tion frequency, and replicarecombina-tion timing—on an aston-ishingly fine scale. On a large scale, various pairwise correlations between these features have been de-scribed and a number of causal connections from these correlations have been inferred, especially to explain the mutation-rate variation in the human genome. Covariation of the GC content with the recombination frequency (Kong et al. 2002; Montoya-Burgos et al. 2003; Meunier and Duret 2004), with the mutation rate (Smithet al. 2002), and with the timing of DNA replication (Watanabe et al. 2002; Woodfine et al. 2004) were described for several chromosomes and the human genome as a whole. The direct influence of the GC content on the mutation rate of a sequence due to a higher rate of cytosine deamination in GC-poor DNA was reported (Fryxelland Zuckerkandl2000; Fryxell and Moon 2005). One hypothesis describes the de-pendency of both the mutation rate and the mutation spectrum of a sequence on the time in S phase, during which the sequence is replicated. The basis for this hypothesis comes from the observation that the con-centrations of free deoxyribonucleotides in a cell fluc-tuate during S phase and affect the fidelity of DNA replication (Wolfeet al. 1989; Wolfe1991). A correlation between recombination frequency and the mutation rate of a genomic region has been demonstrated by several groups (Hellmann et al. 2003; Huang et al. 2005). A causal relationship has been suggested in the sense that the process of recombination itself may be mutagenic (Lercherand Hurst 2002b; Filatovand
Gerrard 2003; Filatov 2004). Due to the observed
covariation of all characters, the results of our work are compatible with all these hypotheses and cannot be used as arguments in favor of or against any of them. Instead, our results suggest that the correlations be-tween structure and function of a genomic region may be more complex than expected from pairwise compar-isons of the relevant characters.
To test whether regional variations of the proportions of GC.ATvs. AT.GC mutations were responsible for the creation and the maintenance of the pronounced GC-content differences and the sharp boundary
be-tween the sequence domains in the NF1 gene region, the spectrum of base pair exchanges leading to SNPs in the human population was analyzed and taken as a proxy for the mutation spectrum. The results revealed a higher GC.AT than AT. GC mutation rate in both sequence domains, confirming similar observations at theMHClocus, published by Eyre-Walker(1999) and Smithand Eyre-Walker(2001), and for a number of genes on various chromosomes (Alvarez-Valinet al. 2002). Moreover, it turned out that the bias in favor of GC.AT mutations was equally strong in both GC-content domains. These results reject the mutation-bias variation hypothesis as a possible explanation for the compositional heterogeneity of GC-content domains.
A higher rate of GC.AT than AT.GC mutations will lower the GC content of a sequence to,50% over time until an equilibrium is reached, at which both types of mutations occur with the same absolute frequency. This equilibrium appears to be reached for the GC-poor sequences from the NF1 gene locus because the pro-portions of GC.AT and AT.GC mutations have been found to be equal in this region. As the vast majority of
human genomic DNA shows a GC content of ,45%,
with a peak in the distribution of the GC content in 20-kb windows at 37.5% (Lander et al. 2001), the GC content of the GC-poorNF1gene region may be taken as representative of the majority of the genomic sequen-ces. In which case, it can be assumed that the sequence composition of the greatest part of the mammalian genome is a direct result of the mutation-rate bias.
NF1 gene region, an abrupt regional change in the action of either of the two forces has to be assumed, because the fixation bias has to be postulated only for the GC-rich but not for the GC-poor domain. Intrigu-ingly, a change in the recombination frequencies of the underlying sequences was observed exactly at the boundary between the two GC-content domains, with a low frequency in the GC-poor and a high recombina-tion frequency in the GC-rich region (Eisenbarth
et al. 2000). Moreover, HapMap data (International HapMapConsortium2005) revealed not only a higher density of recombination hot spots in the GC-rich than in the GC-poor domain, which actually is completely devoid of hot spots, but also substantially elevated recombination rates in the regions outside of the hot spots in the GC-rich compared to the GC-poor domain. Therefore, it can be assumed that the gene-conversion frequency is also higher in the GC-rich domain, a fact that will result in a stronger fixation bias in this domain, if there is a bias in the conversion rates. This postulated correlation was confirmed by data published recently. Kudlaet al. (2004) showed that paralogous sequences undergoing gene conversion have a higher GC content than sequences not involved in this process. Webster
et al. (2005) demonstrated an effect of the recombina-tion rate of a genomic region on the substiturecombina-tion patterns of Alu sequences but not on their polymor-phism pattern and explained the differences in the observations by biased gene conversion. This mecha-nism can lead to regional differences in the GC content only if regional differences in the conversion rates are stable over long periods of time. Whether this condition has really been met cannot be reported upon at present. The exact location of recombination hot spots and the recombination rates measured over short distances (50 kb) are not well conserved between human and chimpanzee (Ptaket al. 2005), but these results tell us little about the conservation of regional differences of recombination frequencies on a scale that is relevant for the evolution of GC-content domains.
In summary, our results suggest a model according to which the GC content of GC-poor sequence domains, representative of the majority of human genomic DNA, is the result of a mutation bias. The higher GC content of the GC-rich domains cannot be explained by actual regional variation of the mutation bias. For this domain, the action of postmutational processes that lead to a preference in the fixation of AT.GC mutations over GC.AT mutations or an evolutionary very recent change in the mutation bias has to be assumed to ex-plain the data.
LITERATURE CITED
Alvarez-Valin, F., G. Lamolleand G. Bernardi, 2002 Isochores,
GC3 and mutation biases in the human genome. Gene 300:
161–168.
Alvarez-Valin, F., O. Clay, S. Cruveiller and G. Bernardi,
2004 Inaccurate reconstruction of ancestral GC levels creates a ‘‘vanishing isochores’’ effect. Mol. Phylogenet. Evol.31:788– 793.
Arndt, P. F., D. A. Petrovand T. Hwa, 2003 Distinct changes of
genomic biases in nucleotide substitution at the time of mamma-lian radiation. Mol. Biol. Evol.20:1887–1896.
Belle, E. M., L. Duret, N. Galtierand A. Eyre-Walker, 2004 The
decline of isochores in mammals: an assessment of the GC con-tent variation along the mammalian phylogeny. J. Mol. Evol.58:
653–660.
Bernardi, G., 2000 Isochores and the evolutionary genomics of
ver-tebrates. Gene241:3–17.
Cohen, N., T. Dagan, L. Stoneand D. Graur, 2005 GC
composi-tion of the human genome: in search of isochores. Mol. Biol. Evol.22:1260–1272.
Comeron, J. M., 2006 Weak selection and recent mutational
changes influence polymorphic synonymous mutations in hu-mans. Proc. Natl. Acad. Sci. USA103:6940–6945.
Costantini, M., O. Clay, F. Aulettaand G. Bernardi, 2006 An
isochore map of human chromosomes. Genome Res.16:536– 541.
Duret, L., M. Semon, G. Piganeau, D. Mouchiroudand N. Galtier,
2002 Vanishing GC-rich isochores in mammalian genomes. Genetics162:1837–1847.
Eisenbarth, I., G. Vogel, W. Krone, W. Vogel and G. Assum,
2000 An isochore transition in the NF1 gene region coincides with a switch in the extent of linkage disequilibrium. Am. J. Hum. Genet.67:873–880.
Eisenbarth, I., A. M. Striebel, E. Moschgath, W. Vogeland G.
Assum, 2001 Long-range sequence composition mirrors
link-age disequilibrium pattern in a 1.13 Mb region of human chro-mosome 22. Hum. Mol. Genet.10:2833–2839.
Eyre-Walker, A., 1999 Evidence of selection on silent site base
com-position in mammals: potential implications for the evolution of isochores and junk DNA. Genetics152:675–683.
Eyre-Walker, A., and L. D. Hurst, 2001 The evolution of
iso-chores. Nat. Rev. Genet.2:549–555.
Federico, C., S. Saccone, L. Andreozzi, S. Motta, V. Russoet al.,
2004 The pig genome: compositional analysis and identifica-tion of the gene-richest regions in chromosomes and nuclei. Gene343:245–251.
Filatov, D. A., 2004 A gradient of silent substitution rate in the
human pseudoautosomal region. Mol. Biol. Evol.21:410–417. Filatov, D. A., and D. T. Gerrard, 2003 High mutation rates in
human and ape pseudoautosomal genes. Gene317:67–77. Fryxell, K. J., and W. J. Moon, 2005 CpG mutation rates in the
human genome are highly dependent on local GC content. Mol. Biol. Evol.22:650–658.
Fryxell, K. J., and E. Zuckerkandl, 2000 Cytosine deamination
plays a primary role in the evolution of mammalian isochores. Mol. Biol. Evol.17:1371–1383.
Galtier, N., 2003 Gene conversion drives GC content evolution in
mammalian histones. Trends Genet.19:65–68.
Hawkins, D. M., and P. Qiu, 2003 The changepoint model for
sta-tistical process control. J. Qual. Technol.35:355–366.
Hellmann, I., I. Ebersberger, S. E. Ptak, S. Paabo and M.
Przeworski, 2003 A neutral explanation for the correlation
of diversity with recombination rates in humans. Am. J. Hum. Genet.72:1527–1535.
Holmquist, G. P., 1992 Chromosome bands, their chromatin
fla-vors, and their functional features. Am. J. Hum. Genet. 51:
17–37.
Huang, S. W., R. Friedman, N. Yu, A. Yuand W. H. Li, 2005 How
strong is the mutagenicity of recombination in mammals? Mol. Biol. Evol.22:426–431.
InternationalHapMapConsortium, 2005 A haplotype map of
the human genome. Nature437:1299–1320.
Khelifi, A., J. Meunier, L. Duretand D. Mouchiroud, 2006 GC
content evolution of the human and mouse genomes: insights from the study of processed pseudogenes in regions of different recombination rates. J. Mol. Evol.62:745–752.
Kong, A., D. F. Gudbjartsson, J. Sainz, G. M. Jonsdottir, S. A.
Gudjonssonet al., 2002 A high-resolution recombination map
Kudla, G., A. Helwak and L. Lipinski, 2004 Gene conversion
and GC-content evolution in mammalian Hsp70. Mol. Biol. Evol.
21:1438–1444.
Lander, E. S., L. M. Linton, B. Birren, C. Nusbaum, M. C. Zody
et al., 2001 Initial sequencing and analysis of the human ge-nome. Nature409:860–921.
Lercher, M. J., and L. D. Hurst, 2002a Can mutation or fixation
biases explain the allele frequency distribution of human single nucleotide polymorphisms (SNPs)? Gene300:53–58.
Lercher, M. J., and L. D. Hurst, 2002b Human SNP variability
and mutation rate are higher in regions of high recombination. Trends Genet.18:337–340.
Lercher, M. J., N. G. Smith, A. Eyre-Walkerand L. D. Hurst,
2002 The evolution of isochores: evidence from SNP frequency distributions. Genetics162:1805–1810.
Li, W., 2002 Are isochore sequences homogeneous? Gene 300:
129–139.
Li, W., P. Bernaola-Galvan, P. Carpena and J. L. Oliver,
2003 Isochores merit the prefix ‘iso’. Comput. Biol. Chem.
27:5–10.
Meunier, J., and L. Duret, 2004 Recombination drives the
evolu-tion of GC-content in the human genome. Mol. Biol. Evol.21:
984–990.
Mikkelsen, T. S., L. W. Hillier, E. E. Eichler, M. C. Zody, D. B.
Jaffeet al., 2005 Initial sequence of the chimpanzee genome
and comparison with the human genome. Nature437:69–87. Montoya-Burgos, J. I., P. Boursotand N. Galtier, 2003
Recom-bination explains isochores in mammalian genomes. Trends Genet.19:128–130.
Ptak, S. E., D. A. Hinds, K. Koehler, B. Nickel, N. Patilet al.,
2005 Fine-scale recombination patterns differ between chim-panzees and humans. Nat. Genet.37:429–434.
Saccone, S., A. DeSario, J. Wiegant, A. K. Raap, V. G. Dellaet al.,
1993 Correlations between isochores and chromosomal bands in the human genome. Proc. Natl. Acad. Sci. USA90:11929– 11933.
Schmegner, C., A. Berger, W. Vogel, H. Hameisterand G. Assum,
2005a An isochore transition zone in the NF1 gene region is a conserved landmark of chromosome structure and function. Genomics86:439–445.
Schmegner, C., J. Hoegel, W. Vogeland G. Assum, 2005b Genetic
variability in a genomic region with long-range linkage disequi-librium reveals traces of a bottleneck in the history of the Euro-pean population. Hum. Genet.118:276–286.
Smith, N. G., and A. Eyre-Walker, 2001 Synonymous codon bias is
not caused by mutation bias in G1C-rich genes in humans. Mol. Biol. Evol.18:982–986.
Smith, N. G., M. T. Websterand H. Ellegren, 2002 Deterministic
mutation rate variation in the human genome. Genome Res.12:
1350–1356.
Tenzen, T., T. Yamagata, T. Fukagawa, K. Sugaya, A. Andoet al.,
1997 Precise switching of DNA replication timing in the GC content transition area in the human major histocompatibility complex. Mol. Cell. Biol.17:4043–4050.
Watanabe, Y., A. Fujiyama, Y. Ichiba, M. Hattori, T. Yadaet al.,
2002 Chromosome-wide assessment of replication timing for human chromosomes 11q and 21q: disease-related genes in timing-switch regions. Hum. Mol. Genet.11:13–21.
Waterston, R. H., K. Lindblad-Toh, E. Birney, J. Rogers, J. F.
Abrilet al., 2002 Initial sequencing and comparative analysis
of the mouse genome. Nature420:520–562.
Webster, M. T., and N. G. Smith, 2004 Fixation biases affecting
human SNPs. Trends Genet.20:122–126.
Webster, M. T., N. G. Smith, L. Hultin-Rosenberg, P. F. Arndtand
H. Ellegren, 2005 Male-driven biased gene conversion
gov-erns the evolution of base composition in human alu repeats. Mol. Biol. Evol.22:1468–1474.
Wolfe, K. H., 1991 Mammalian DNA replication: mutation biases
and the mutation rate. J. Theor. Biol.149:441–451.
Wolfe, K. H., P. M. Sharpand W. H. Li, 1989 Mutation rates differ
among regions of the mammalian genome. Nature337:283–285. Woodfine, K., H. Fiegler, D. M. Beare, J. E. Collins, O. T. McCann
et al., 2004 Replication timing of the human genome. Hum. Mol. Genet.13:191–202.
Zhang, C. T., and R. Zhang, 2004 Isochore structures in the mouse
genome. Genomics83:384–394.