METHODOLOGY FOR ASSESSING SHOCK DAMAGE DUE TO
AIRCRAFT IMPACT
Randy James1 and Jeremy Wiesner 2
1
Senior Associate, Director of Structures, ANATECH Corp., San Diego, CA, USA
2
Senior Engineer, ANATECH Corp., San Diego, CA, USA
ABSTRACT
The effects of impact from a large commercial aircraft are being considered in the licensing basis for the next generation of nuclear power plants worldwide. The intent is to identify design enhancements and procedures that can mitigate the consequences of such events with minimal operator action. The NEI 07-13 methodology, NEI (2011), developed in the United States for use in performing these aircraft impact assessments requires detailed structural modelling for damage assessments and detailed system engineering assessments to quantify the consequences considering shock and ensuing fire. This methodology has been accepted by the U. S. Nuclear Regulatory Commission, USNRC (2011) and is being used for aircraft impact assessments for all new plant designs in the U.S. to meet regulatory requirements. For assessing shock damage, the NEI methodology employs rule sets for determining when systems and equipment are disabled based on the distance of the equipment from the impacted location and the general robustness of the equipment. This approach works well as an assessment tool to quickly identify equipment that would be non-functional due to any specific impact condition. However, the NEI methodology does not provide guidance for performing more detailed assessments or developing mitigation measures if the rule set screening assessment indicates that the loss of the equipment is unacceptable. This paper discusses methodology developed for performing detailed assessments for consequences of shock considering fragility for the various types of safety equipment. This detailed assessment methodology provides specific shock demands on the equipment that can be used to develop mitigation measures if the detailed assessment also results in an unacceptable consequence.
INTRODUCTION
impact of large commercial aircraft and also structural configurations considered representative of typical nuclear power plant designs.
METHODOLOGY
The methodology used to develop guidance for assessing shock propagation is based on structural modelling methods consistent with NEI 07-13 methodology for assessing structural damage. These methods are adapted for capturing shock propagation traveling through the concrete radiating away from the impact location. Because impact from large commercial aircraft is considered a beyond design basis event, a fundamental basis of the methodology is that the assessments performed can be based on best estimate analyses rather than design minimum or worst case conditions. Since there are many variables affecting the shock propagation, the approach is to perform a series of calculations with variations in those parameters that are considered primary variables and treat the analysis results as data sets similar to experimental test sampling results. The data developed from these NEI 07-13 based structural analyses are acceleration time history responses for locations at various locations within the structure where the structure is subjected to different strike locations relative to the points collected. These acceleration time histories for the response are then processed to provide response spectra data (spectral acceleration versus frequency) at these data set locations. The response spectra data is processed assuming a log normal distribution of response to develop general equations that relate spectral acceleration as a function of frequency content and distance from the impact.
ASSESSING SHOCK PROPAGATION
Modelling Approach
This study concerns shock propagation in reinforced concrete structures typical of reactor building or auxiliary buildings housing safety related equipment needed to maintain cooling to the reactor core and spent fuel pool. A generic structural model was developed which is representative of the configurations typically found in an Auxiliary Building for typical nuclear power plants. The model contains a variety of wall thicknesses and bay sizes and is substantial in size to minimize the influence of artificial boundary conditions on shock propagation. The large size of the model also allows for capturing the shock response for points at a large distance away from the strike location and for a diversity of locations relative to structural influences. Even though the size of the model is significant, the sides and the back of the model terminate with vertical section cuts. If a typical roller boundary condition is used, which fixes the displacements normal to the cut surface, shock waves can reflect off of the boundaries which could potentially influence the captured shock response. This effect is mitigated by using non-reflecting pressure boundary conditions on the sides and back of the model, which prevents the reflection of stress waves at the boundaries. These structures are typically embedded in the foundation with several floors below grade and connected to a heavy basemat. For this study, the model is terminated at two and a half floors below the lowest strike location.
The intent of this study is to consider shock propagation where the physical damage is stopped at the exterior wall. If the exterior wall fails, then experience has shown that the consequences for the plant are dominated by the physical extent of damage and subsequent fire spread rather than shock propagation. For this study, the external wall is a robust reinforced concrete with a thickness and reinforcement sufficient to prevent perforation by a strike at the mid-span of a wall panel. The reinforcement in the external wall is varied in order to consider a range of wall damage. All other structural components in the model include a nominal amount of reinforcement that is typical for the design-basis of a nuclear power plant.
numbered Strike 1 and Strike 2, which represent strikes on the hardest and softest points of the external wall. The hard-spot of the external wall is positioned at the connection between an interior wall and slab, and this is generally thought to be the worst-case strike location for causing shock damage. The soft-spot of the external wall is positioned at the mid-span position between floor slabs and transverse walls, which is a typical strike location for a physical damage assessment. The combination of Strike 1 and Strike 2 provide the bounding cases for examining the possible damage states caused by an aircraft impact on a flat wall. Strike 3 and Strike 4 are similar but are positioned at the top of the structure to consider the effect of inducing moment loads in the building. Strike 4 is centered on the interior transverse wall with the top of the fuselage tangent to the roof elevation.
Figure 1. Illustration of finite element model, front view with exterior wall removed
The arrangement of the points for capturing the shock response on each floor is shown in Figure 2 which shows a lateral section cut view just above one of the floor slabs. For each floor there are 46 history points which gives a total of 230 points in the entire model. The acceleration history is recorded for a point right at the position of the impact and at a series of points up to 100’ away from the strike location in a radial pattern. This means that some of the data points are as far as 140’ away from the impact since there are points at a 100’ radius from the strike location but are up or down two floor elevations. The collection of the 46 points on each floor slab includes points that are near the center of a floor slab span and also connected to a heavy interior wall; therefore, the points provide a good sampling of various possible locations of equipment inside the structure. It is important to note that the same series of points is used for Strike 3 and Strike 4 which are at the top of the structure.
Figure 2. Illustration of shock response calculation points for one elevation, section cut view
Figure 3. Illustration of model for wide bay variation, front view with exterior wall removed
Analysis Results
For each case, an explicit dynamics analysis is performed using a pressure loading on the exterior wall representative of the aircraft threat under consideration with an analysis duration of one second. The duration of this analysis is well beyond the length of a typical structural assessment for physical damage, but is necessary to ensure that the complete acceleration response of a point, which may be far from the impact, is accurately captured. Since shock propagation is the primary interest of these assessments, Rayleigh structural damping is used with a baseline damping that is consistent with seismic analysis for Safe Shutdown Earthquake (SSE) loads.
A series of analysis cases are performed to consider a broad variation of modeling and input parameters, including damping, transmission distances, strikes on hard spots versus wall panels, impacted bay size, and rebar configuration. The goal is to obtain a combined data set covering all variations that conservatively represents a wide range of possible structural configurations and strike locations. The three-dimensional acceleration response is recorded for each of the 230 calculation points during the analysis at a time interval of 0.5 milliseconds. For every calculation point, each component of the acceleration history is used as an input to a 5% damped single degree-of-freedom system to compute the shock response spectrum, which is the relationship between frequency and spectral acceleration. Per NEI 07-13 guidance, the acceleration time history data is filtered to remove frequency content above 200 Hz. Structural response associated with frequencies higher than 200 Hz will have a hard time propagating through reinforced concrete due to microcracking and aggregate, and thus calculated response at high frequencies is considered an artefact of the computational process.
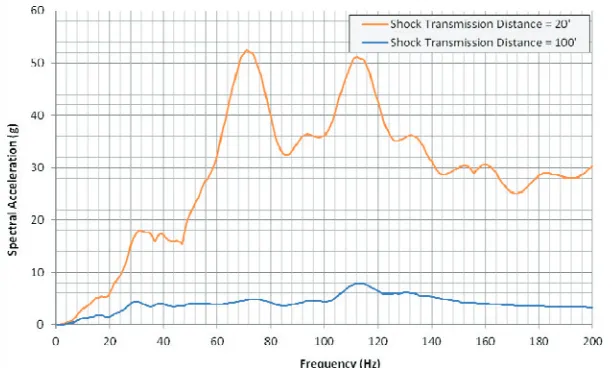
For each of the analysis cases, the result is a collection of shock response spectra for each of the three directional components: the lateral direction parallel to the impact, the lateral direction perpendicular to the impact, and the vertical direction. A given calculation point also has the added information of being located a known distance away from the impact, which is referred to as the shock transmission distance. The shock transmission distance is the linear path that a shock wave travels from the origin of the strike location through the concrete to reach the calculation point. This ultimately yields a three-dimensional relationship between the shock transmission distance, frequency, and spectral acceleration. Figures 5 and 6 provide examples of the shock response spectra for a strike on a hard spot and a soft spot, respectively, each with a near field point and a far field point. These illustrate the differences in magnitude and frequency for shock propagation due to the relative stiffness of the impacted location, but also the general dissipation of shock with distance from the strike location.
Figure 6. Sample shock response spectra for strike on soft-spot in direction of strike
Shock Damage Assessment
Rather than trying to derive an equation consisting of three dependent variables, the shock damage relationship is simplified by breaking up the frequency response into three ranges: low (less than or equal to 10Hz), medium (greater than 10Hz and less than or equal to 100Hz) and high (greater than 100 Hz and less than or equal to 200Hz). As a result, all the data points within a given frequency range can be grouped together and a trend can be extrapolated across each range providing a basis for a shock damage rule.
All of the spectral acceleration values within each frequency range are grouped together and then averaged to establish the mean of the data points for trend fitting. For example, the lateral direction for the low frequency range covers a frequency less than or equal to 10Hz. The spectral acceleration values that fall within this range were calculated from 1 to 10Hz at an interval of 0.5Hz. Therefore for each calculation point there are 19 spectral acceleration values falling inside the low frequency range for each lateral direction. Since the two lateral directions are arbitrary, a single lateral acceleration value is taken as the largest value between the direction perpendicular to the strike and the direction parallel to the strike. Then all of these acceleration values are grouped together across the 230 calculation points resulting in 4,370 data points representing acceleration versus shock transmission distance.
Figure 7. Sample shock transmission distance versus spectral acceleration
The averaged values for spectral acceleration are combined from all analysis cases into a single shock profile to develop a data fit equation that encompasses all of the data. Figure 7 illustrates the processed spectral accelerations versus transmission distance for the averaged data case. This figure shows lateral and vertical accelerations for each of the 3 frequency ranges considered. It can be seen that the data is very consistent as distances increase away from the impact location, even considering all the variations for analysis cases included in the data sets. This implys that the uncertainty dimishes with distance from the strike. Alternatively, there is more scatter or uncertainty for closer distances to the impact location. Large accelerations are indicated near the strike location for the cases where a large amount of physical damage occurs in the impacted wall. The magnitude of these accelerations becomes even more significant at the higher frequencies. This behavior suggests that the results near the impact are highly sensitive to the amount of physcial damage in the external wall, meaning if there was slightly more physical damage the results could be noticably worse, or noticable less if the wall is stregthened to reduce damage. The magnitude of these accelerations are also large enough that it’s unlikely that equipment would survive the shock if it’s located very near the strike location. As a result, it is
reasonable to assume that all equipment within a certain shock transmission distance close to the impact will fail. This is referred to as a kill zone. The implication of this assumption is that all data points can be ignored within this distance for the purposes of fitting a curve to the data. Based on observation of all the data, a distance of 20’ was established as the kill zone for the averaged acceleration data, which is indicated by the pink band in Figure 8. The uncertainty of the results within the kill zone is only due to the fact that there are possible structural configurations that haven’t been investigated that could have more severe physical damage than what was determined for analysis cases performed, and therefore worse shock damage close to the impact. It also seems logical and realistic that equipment near the impact point is not likely to remain functional.
The pink shaded region in Figure 8 represents the kill zone area, so only the points outside of this region are considered in developing the generalized equation for the shock damage rule set. Any equipment located within the kill zone for any given strike location is assumed to be nonfunctional. The rule set is established based on the generalized equation (1).
Where Sa is the spectral acceleration d is the distance from the impact location
dk is the kill zone distance = 20’ for averaged data, = 30’ for 95% confidence value
and A1 and A2 are parameters that depend on the frequency range and direction of interest
(a) Lateral Response for Low Frequency (b) Vertical Response for Low Frequency
(c) Lateral Response for Medium Frequency (d) Vertical Response for Medium Frequency
(e) Lateral Response for High Frequency (f) Vertical Response for High Frequency
SUMMARY AND CONCLUSIONS
The equation parameters are determined so that the equations bound the averaged or expected
values from all the analysis cases as illustrated in Figure 8. The A1 parameter provides the peak spectral
acceleration acting at the edge of the kill zone, and A2 determines the decay shape of the spectral
acceleration with distance from the impact location. The current study establishes pairs of A1 and A2 for
each of the 3 ranges of frequency and for lateral and vertical spectral acceleration components for each frequency range. The same can be done for establishing the 95% confidence values for spectral acceleration. Additional efforts could be performed to break the rule set into more refined frequency ranges and to provide a factor for considering a damping range for mounted equipment. For this study, a nominal value of 5% damping is used in developing the response spectra data, but additional damping values can also be considered.
This study confirmed the belief that strikes on a hard spot of the building will propagate higher levels of shock farther into the building. This is mainly due to the higher stiffness of the target at these hard spots, which generates more force since the momentum of the impacting object is stopped over a shorter duration. However, an interesting observation is that the magnitude of shock at the impacted site is governed by the magnitude of damage at the impacted site, the more damage suffered, the higher the high frequency shock near the impacted site. This is attributed to high frequency shock waves generated as the damage develops where energy is released from the rapid cracking of the concrete.
Fragility based Shock Damage Rule Set
The generalized shock damage equation allows for the calculation of the spectral acceleration as a function of the shock transmission distance for different ranges of frequency. The NEI 07-13 guidance groups equipment into categories based on fragility levels of generic equipment. For each category, a median fragility limit is provided which is representative of all the equipment in the category. The generalized shock damage data developed in this study can be used to determine “susceptibility distances” for these groups of equipment. This allows for quick and conservative category-based screening of equipment, and any critical equipment that fails the screening can be more closely investigated using the generalized equation approach outlined in the following section. Since the NEI 07-13 guidance does not distinguish between frequency content or direction in defining the median fragility of the equipment groups, all of the generated study data must be considered (all frequencies as well as lateral and vertical directions). The equipment fragilities specified by NEI 07-13 are median values, therefore it is appropriate to only consider the 50% confidence results from this study for comparison to NEI 07-13 fragility categories.
Assessing Survivability of Specific Equipment
For cases when the shock damage rule set is applied according to the NEI 07-13 guidance and a piece of equipment is deemed to have failed, the integrity of the equipment can be more closely inspected using the generalized shock damage rule set equation. The application of the shock damage rule set for a specific equipment is performed according to the following steps. It is important to note that the application of the shock damage rule sets assumes that the equipment is not exposed to aircraft wreckage entering the building or fire spread. If physical damage or fire enters the vicinity of the equipment then the equipment is assumed lost on this basis.
1. Calculate the shock transmission distance
2. Compare shock transmission distance with kill zone
If the equipment is located within the kill zone, then the equipment is assumed to fail, else continue to Step 3.
3. Determine the frequency range of interest and select a confidence interval
The frequency of interest could be based on the natural frequency of the mounted equipment or from a fragility spectra for the equipment. The desired confidence interval (50% or 95%) can be selected according to licensing requirements.
4. Calculate spectral acceleration for the lateral and vertical directions
Based on the desired confidence internal and the frequency of interest, the spectral acceleration acting on the equipment based on nominal 5% spectral damping is calculated from equation 1 and the equations parameters.
5. Compare the spectral acceleration with the fragility limit of the equipment
If a directionless fragility limit is available for the equipment, compare this value with the maximum value of the lateral and vertical spectral accelerations. If lateral and vertical fragility limits are available then compare each fragility value with the corresponding spectral acceleration. If the calculated spectral acceleration value is less than the fragility limit then the equipment can be assumed to remain functional for that strike location.
REFERENCES
USNRC (2011), “Guidance for the Assessment of Beyond-Design-Basis Aircraft Impacts,” Regulatory Guide 1.217, United States Nuclear Regulatory Commission, Washington, DC, USA, August 2011. NEI (2011), “Methodology for Performing Aircraft Impact Assessments for New Plant Designs,” NEI
07-13, Rev 8, Nuclear Energy Institute, USA, April, 2011.