DOI: 10.1534/genetics.104.026997
The Inheritance and Evolution of Leaf Pigmentation and Pubescence in Teosinte
Nick Lauter,*
,†,1Charles Gustus,*
,2Anna Westerbergh*
,3and John Doebley
†,4*Department of Plant Biology, University of Minnesota, Saint Paul, Minnesota 55108 and†Laboratory of Genetics, University of Wisconsin, Madison, Wisconsin 53706
Manuscript received February 10, 2004 Accepted for publication May 6, 2004
ABSTRACT
To investigate the genetic mechanisms that underlie morphological evolution in natural populations, we employed QTL mapping to dissect the inheritance of leaf sheath characters that distinguish Chalco from Balsas teosinte. Abundant macrohairs (trichomes) and intense anthocyanin accumulation are found in Chalco teosinte sheaths whereas Balsas teosinte leaf sheaths are green and glabrous. These character states may represent adaptations to the cooler highland (Chalco)vs. warmer middle-elevation (Balsas) climates. QTL mapping in multiple populations revealed a mix of major- and minor-effect QTL affecting both sheath color (anthocyanin) and macrohair abundance. The major QTL for macrohairs accounts for 52% of the parental difference. Epistatic interactions were detected between the major-effect QTL and multiple other QTL for both traits, accounting for substantial portions of phenotypic variance. Develop-mental analyses suggest that regulatory program changes underlie the phenotypic differences. Sheath anthocyanin QTL are clearly associated with b1 and a3, both of which are regulators of anthocyanin biosynthesis. Our findings suggest that changes in a small number of QTL can lead to morphological evolution by modulating existing developmental programs.
A
fundamental challenge for evolutionary biologists and has red, hairy leaf sheaths, while Balsas teosinte is to elucidate the genetic mechanisms that under- (Z. mays ssp. parviglumis) grows at middle elevations lie phenotypic evolution in natural populations. One in southwestern Mexico and has green, glabrous leaf approach to addressing this issue is to employ quantita- sheaths (Figure 1, a and b). The red and hairy sheath tive trait locus (QTL) mapping to dissect the genetic phenotypes are thought to be adaptations to the cooler basis of morphological differences between natural pop- climate where Chalco teosinte grows (Doebley 1984; ulations of cross-compatible taxa. Since QTL mapping Lauter2001). Increased absorption of radiant energy can be used to estimate both the number of genetic due to dark pigmentation may significantly improve me-loci that control trait differences and the relative magni- tabolism and translocation in thermophilic C4 plants tudes of their effects (Mackay2001), it is possible to growing in cool climates (Galinat 1967). Improved establish whether morphological evolution has pro- heat retention would have a similar benefit, concordant ceeded via a change in a single gene, via changes of with the view that plant hairs may create a boundary large effect in a few genes, or via changes of small effect layer that reduces heat loss (Daubenmire1947; Carl-in numerous genes. Beyond characterizCarl-ing the mode quist1974). The large trichomes (macrohairs) of Zea of inheritance for trait differences, QTL mapping also may be especially well suited for this, since they become provides information about the modes of action for indurated with silica at maturity, which gives them a the individual QTL. Additive, dominance, and epistatic high heat capacity (Lauter2001). Leaf sheath pubes-effects can all be estimated so that their relative contri- cence and pigmentation are also excellent characters butions to the evolution of traits can be evaluated. to examine because the genetics of both trichome for-We have analyzed differences in leaf traits between mation in Arabidopsis and anthocyanin biosynthesis in two closely related subspecies ofZea maysthat grow in maize have been extensively studied (reviews by Hol-separate regions of Mexico. Chalco teosinte (Z. mays tonandCornish1995;Szymanskiet al. 2000). ssp.mexicana) grows at high elevations in central Mexico Here we report the results of multiple QTL mappinganalyses of the genetic basis for the sheath pubescence and pigmentation differences between Chalco and 1Present address:Department of Crop Sciences, University of Illinois
Balsas teosintes. In addition, the developmental under-Urbana-Champaign, Urbana, IL 61801.
2Present address:Department of Agronomy and Plant Genetics, Univer- pinnings of these phenotypic differences are investi-sity of Minnesota, St. Paul, MN 55108. gated. Consistent with some other recent studies of
mor-3Present address:Department of Plant Biology and Forest Genetics,
phological traits in other natural systems, we found that Swedish University of Agricultural Sciences, SE-750 07 Uppsala, Sweden.
the trait differences are inherited oligogenically and 4Corresponding author:445 Henry Mall, Madison, WI 53705.
E-mail: [email protected] that epistatic interactions among QTL make significant
scores on a seven-unit scale ranging from 0 to 6. The scores contributions to the phenotypes. We show that both
were based collectively on the uppermost two sheaths of each major and minor QTL for anthocyanin pigmentation
plant and were replicated and averaged. F2individuals scoring map near known genes in the anthocyanin pathway and 0 were equivalent to the green-sheathed individuals in the that the major QTL for macrohairs maps near the maize TC1population. F2individuals scoring 1’s and 2’s were lighter than any of the red-sheathed TC1individuals, and those scor-gene,macrohairless1. Results from developmental
analy-ing 6’s were darker than any TC1individuals. Thus, the four-ses suggest that the trait differences are regulatory in
unit pigment intensity scale for the red-sheathed TC1 individu-nature.
als falls in the range of 3–5 on the F2scale. Pigment coverage was not scored in the F2population. To establish the mean parental difference for anthocyanin intensity, 55 and 53 plants MATERIALS AND METHODS of the respective Chalco and Balsas teosinte accessions from which the F2population was derived were scored using the
Plant materials and breeding:Several populations were
cre-seven-unit scale. ated for mapping leaf trait QTL. First, pollen from a Balsas⫻
Genetic markers:Molecular markers with full genome cov-Chalco teosinte F1hybrid was used to pollinated the maize
erage in the TC1population were obtained by using the maize inbred A158 to generate a testcross (TC1) population of 295
core RFLP marker set as described inLauterandDoebley plants. The Balsas and Chalco teosinte parents of the F1were
(2002). We also used probes for several candidate genes in grown from seed collected near Teloloapa´n, Mexico (Iltis and
the anthocyanin biosynthesis pathway (b1,r1,pl1,c1,c2, and Cochrane, collection 81), and Chalco, Mexico (Iltis et al.,
whp1). The F2population was probed with a subset of 24 RFLP collection 28622), respectively. Second, a Balsas⫻Chalco F1
markers that covered areas of the genome where bona fide plant was self-pollinated to generate an F2population of 165
QTL and nearly significant LOD peaks for sheath macrohairs plants. The Balsas and Chalco teosinte parents of the F1were
and anthocyanins mapped in the TC1study (Figure 2). Each grown from seed collected near Teloloapa´n, Mexico (Iltis and
of the four sets of linked markers used for making and analyz-Cochrane, collection 81), and Texcoco, Mexico (Iltis et al.,
ing the NILs contained at least three markers (Figure 2). collection 28620), respectively. Third, we developed nearly
QTL mapping and statistical analyses:The genetic distances isogenic lines (NILs) for four QTL by introgressing
QTL-between markers were calculated using Mapmaker v2.0 containing Chalco teosinte chromosome segments into maize
(Landeret al. 1987).QTLCartographer v1.14 (Bastenet al. inbred A158. This was accomplished by marker-assisted
breed-2000) was used for all QTL mapping procedures as described ing with no attention paid to phenotype. For QTL on
chromo-inLauterandDoebley(2002). For each statistically signifi-somes 2, 5, and 10, fourth-generation backcross plants were
cant QTL detected by composite interval mapping, the chro-selfed to create BC4F2 families (116 plants each) for QTL
mosomal location, magnitude, and direction of both additive analysis. For the chromosome 9 QTL, a BC3F2 family (116
and dominance effects and percentage of the phenotypic vari-plants) was used. The TC1, F2, and chromosome 9 BC3F2
popu-ance explained (PVE) are reported. A QTL was considered lations were grown in winter nurseries on Molokai, Hawaii.
statistically significant only if its LOD score exceeded the corre-All three BC4F2populations were grown in a summer nursery
sponding experiment-wise significance threshold (P⫽0.05) at the University of Wisconsin at Madison.
determined using 1000 permutations of the data (Churchill
Sheath macrohair counting: Macrohair counts were
ob-andDoerge 1994). Correlations,t-tests, and ANOVAs were tained in the same way from the sheath of the second leaf
performed using JMP v3.0 (SAS Institute). from the top of every plant in our six experimental
popula-Scanning electron microscopy: Since macrohairs tend to tions. Since Balsas teosinte sheaths have macrohairs along
sustain damage during standard SEM specimen preparation, we their edges, macrohairs were counted in an area of the sheath
used low-temperature, low-voltage SEM to obtain images of devel-where only Chalco teosinte is hairy (centered between midrib
oping macrohairs (Ahlstrand1996). Fresh sheath tissue was and leaf margin, one-third of the way down the sheath from
affixed to aluminum stubs with carbon paint and cryofixed in its junction with the blade). Before macrohairs were counted,
liquid nitrogen. No metal coating was needed to obtain secondary this allometric location was measured out and marked with a
electron images at up to⫻1250 magnification (Lauter2001). small ink dot, upon which the microscope field of view was
centered, thereby preventing field choice bias and reducing counting error due to field wandering. Only macrohairs whose
bases were inside the microscope’s ⫻50 field of view (14.8 RESULTS mm2) were counted. To establish the mean parental difference
for sheath pubescence, macrohairs were also counted in this Parental difference for macrohair development:To way for 26 plants of each teosinte accession from which the facilitate interpretation of the effects and functions of F2population was derived.
the QTL, the parental difference in sheath macrohair
Sheath color scoring:Two distinct color classes of plants
abundance was quantified and its developmental basis existed in the TC1population, allowing plants to be scored
was investigated. Both Chalco and Balsas teosinte plants in a Mendelian fashion according to whether they were red
sheathed or green sheathed. Among red-sheathed plants, vari- produce macrohairs in the upper (adaxial) epidermis ation in both anthocyanin intensity and coverage was ob- of the blade and at the edges of the outer (abaxial) served. Intensity varied from light to dark, while coverage
epidermis of the sheath. Away from the edges, Balsas varied according to how far up from the bottom of the sheath
teosinte sheaths are completely glabrous while equiva-the pigment extended. To measure equiva-these subtleties,
quantita-lent Chalco teosinte sheaths have 284 macrohairs/cm2 tive scores ranging from 1 to 4 were given to each of the 164
red-sheathed plants for both the intensity and the coverage (Figure 1, a and b; Table 1). Since Balsas teosinte plants traits. The scores were based collectively on the uppermost are able to initiate and develop macrohairs in some two sheaths of each plant and were replicated and averaged.
parts of their leaves, we considered whether macrohairs The F2population displayed a continuous range of pigment
never initiate or initiate but fail to develop on the medial phenotypes that was wider and more complex than that of
ques-Figure1.—Leaf sheath pubescence and pigmentation phenotypes of Chalco and Balsas teosintes. (a) The sheath of a mature Chalco teosinte plant with dense macrohairs and dark anthocyanin pigmentation. (b) The sheath of a mature Balsas teosinte plant with the glabrous and green phenotypes. Note that macrohairs are present on the adaxial surface of the leaf blade and that small patches of pigmented cells can be seen near the base of the sheath. (c) SEM of macrohair emergence on the ninth sheath of a 30-day-old Chalco teosinte plant. (d) SEM of a ninth sheath of a 30-day-old Balsas teosinte plant showing the characteristic absence of macrohair initials. (e) In Chalco teosinte plants as well as in progeny of their crosses with Balsas teosinte and maize, the subsidiary cells that form the macrohair pedestals are often pigmented with anthocyanin, despite the fact that surrounding epidermal cells remain green. (f) Macrohairs with a pigmented pedestal are shown from the side. (g) This mature Chalco teosinte plant shows a typical intensity and distribution of pigmentation in plants carryinga3and B1alleles. Multiple vertically oriented organs are pigmented, depending on genotype and exposure to light, as seen where a sheath has been removed (arrow). Black scale bars, 1 cm; white scale bars, 100m.
tion, we used SEM to examine multiple developmental of the plant (Figure 1). Whereas Chalco teosinte plants accumulate high levels of anthocyanins in nearly all stages of the sheath epidermis using the eighth, ninth,
and tenth leaves of 30-day-old Chalco and Balsas teosinte vertically oriented surfaces of the plant, most Balsas teosinte plants are almost totally green (Figure 1, a, b, plants. We found that macrohair initials expand out of
the epidermis on the central portion of Chalco teosinte and g). Some Balsas teosinte plants do produce anthocy-anins in their leaf sheaths, although the darkest of them sheaths just prior to the first signs of stomatal
differentia-tion when the sheath isⵑ3 mm tall (Figure 1c). Balsas are not as dark as the darkest Chalco teosinte plants. We repeatedly observed that Balsas teosinte plants had teosinte plants never produced any macrohair initials in
this region of their sheaths in any of the developmental less total anthocyanin coverage than Chalco teosinte plants. This is in part attributable to the fact that Balsas stages examined, including those surrounding the first
signs of stomatal differentiation (Figure 1d). teosinte plants do not produce anthocyanins on the uppermost portion of their sheaths, as most Chalco
Parental difference for sheath pigmentation:Similar
to the macrohair case, Balsas teosinte plants are capable teosinte plants do.
Sheath macrohair QTL:The TC1study identified one
of making anthocyanins, but simply produce them in
TABLE 1
Average phenotypes of TC1progeny, F2progeny, and the parental accessions
TC1progeny F2progeny
Trait (n⫽295) (n⫽164) Chalco teosintea Balsas teosinteb Maize A158c
Macrohairs 11.54⫾0.78 22.50⫾1.22 41.65⫾3.47 0.0⫾0.00 0.0⫾0.0 Pigment intensity 1.26⫾0.07d 2.79⫾0.16 3.37⫾0.16 1.51⫾0.12 0.0⫾0.0
Average phenotypes⫾SE are reported as the number of macrohairs counted per 14.8 mm2at the same allometric place on each plant and quantitative score units for pigmentation on a scale from 0 to 6.
an⫽26 for macrohair counts;n⫽55 for anthocyanin scoring. bn⫽26 for macrohair counts;n⫽53 for anthocyanin scoring. cn⫽20 for macrohair counts and for anthocyanin scoring.
dFor the purpose of comparison, the TC1scores were converted to the F2scale as described inmaterials
and methods.
(Table 2; Figure 2). A single Chalco allele at the major ment, the 9L, 2C, and 10L QTL showed additive to domi-nant modes of gene action in the F2(Table 3). The 9L effect QTL on the long arm of chromosome 9 (9L QTL)
adds an average of 18.5 macrohairs to the count area QTL had the largest additive effect (11 macrohairs) in the F2, with the first Chalco allele contributing 13 of TC1 progeny carrying it, accounting for 46% of the
PVE and approximately half of the mean difference macrohairs to the count area of progeny and the second only 9, hence the dominance deviation of 2 macrohairs between the parental taxa (Tables 1 and 2). In
compari-son, the Chalco alleles at the minor-effect QTL explain (Table 3). While the single-copy effect (a ⫹d) of this QTL was lower in the F2 as compared to the TC1 (13 only small amounts of phenotypic variance. Their
com-bined effect, however, is not insignificant; TC1individu- vs. 18.5), the single-copy effects of the Chalco alleles at the 2C and 10L QTL were correspondingly higher als carrying Chalco alleles at the 9L, 5S (S, short arm),
10L and 2C (C, centromeric) QTL had 30 more mac- (Tables 2 and 3).
Sheath pigmentation QTL:The TC1population
segre-rohairs per count area than individuals carrying Balsas
alleles at these loci. Thus, collectively the minor QTL gated into two discrete groups of 164 red- and 131 green-sheathed plants, which is not statistically different from a contribute nearly as much to the phenotype as the major
QTL on 9L. 1:1 expectation that a single-factor model would predict.
Membership in red-sheathed and green-sheathed classes The map positions and magnitudes of effect of the
9L, 2C, and 10L QTL for sheath macrohairs were re- cosegregated perfectly with the respective Chalco and Balsas alleles of theb1gene, a transcriptional regulator affirmed by the F2study (Tables 2 and 3; Figure 2). The
5S and transgressive 4L QTL identified in the TC1study of anthocyanin synthesis in vegetative tissues of Zea (Chandleret al. 1989). We infer that our Chalco parent were not detected in the F2, perhaps because different
sets of parents were used in the crosses or sampling effects. carried a functionalB1allele and that our Balsas parent carried a recessive, nonfunctional (or weakly func-Consistent with their detection as QTL in the TC1
experi-TABLE 2
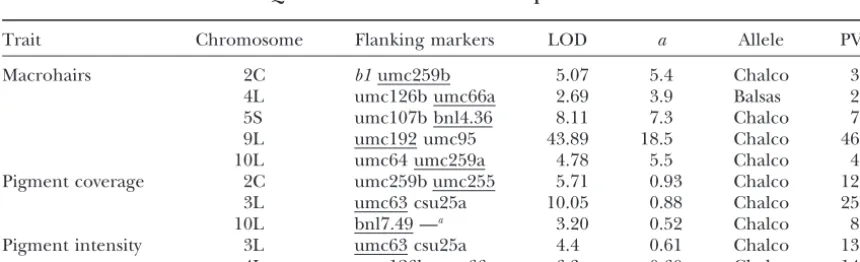
QTL detected in the testcross experiment
Trait Chromosome Flanking markers LOD a Allele PVE
Macrohairs 2C b1umc259b 5.07 5.4 Chalco 3.9
4L umc126b umc66a 2.69 3.9 Balsas 2.0 5S umc107b bnl4.36 8.11 7.3 Chalco 7.2 9L umc192 umc95 43.89 18.5 Chalco 46.0 10L umc64 umc259a 4.78 5.5 Chalco 4.0 Pigment coverage 2C umc259b umc255 5.71 0.93 Chalco 12.6 3L umc63 csu25a 10.05 0.88 Chalco 25.2
10L bnl7.49 —a 3.20 0.52 Chalco 8.9
Pigment intensity 3L umc63 csu25a 4.4 0.61 Chalco 13.7 4L umc126b umc66a 6.3 0.60 Chalco 14.0
QTL positions are reported by chromosome with S and L indicating cytologically defined short and long arms and C denoting centromeric, as well as by the markers on each side of the LOD peak with the closer marker underlined. The peak LOD score, additive effect estimate listed as a trait unit contribution, parental source of the allele, and percentage of the phenotypic variance explained are listed for each QTL. The threshold LOD values for the three traits were 2.64, 2.62, and 2.53, respectively.
Figure2.—Genetic linkage map of the 10 gametic maize-teosinte chromosomes of the TC1population, shown together with two chromosomal segments of NILs carrying macrohair QTL alleles that can exert effects in a maize genetic background. Estimates of positions for statistically significant QTL affecting macrohair density, pigment coverage, and pigment intensity on the leaf sheaths of TC1plants are shown as box and whisker plots. A box vertically delineates the region of a chromosome for which the LOD score of the QTL is within 1.0 LOD unit of its peak, the peak LOD score is indicated by a horizontal line through the box, and the whiskers of each box vertically delineate the region of a chromosome for which the LOD score is between 1.0 and 2.0 LOD units of its peak. The positions of RFLP markers are indicated by horizontal lines along the chromosomes. Each chromosome is depicted with its cytologically defined short arm on top. Bulges on the chromosomes indicate centromere position except on chromosome 9, where the entire short arm is collapsed in the TC1population but not in the NIL for the 9L QTL. Markers included in the F2study have their names highlighted in gray. The introgression segments of the NILs are shown as white lines along the TC1chromosomes. The NIL chromosome segments are drawn to the same centimorgan scale and have their terminal markers indicated by dotted lines.
tional)b1allele. To test for QTL that modify the sheath 2; Figure 2). The LOD by position plots for the intensity and coverage QTL on chromosome 3L were highly con-pigmentation phenotype in plants withB1, subtle
varia-tion for both anthocyanin intensity and coverage was gruent (data not shown), suggesting that the same QTL may affect both aspects of sheath pigmentation. Notably, scored and analyzed among the 164 carriers of the
ChalcoB1allele. Several QTL were detected for each this 3L QTL maps to the same position asanthocyanin3 (a3), a regulatory locus known to affect anthocyanin bio-trait (Table 2), indicating that the phenotypic variation
seen in the TC1 population is controlled by a single synthesis (Styles andCoe 1986;Robinettet al. 1995). Moreover, RNase protection assays have shown that domi-gene (b1) that acts to “switch on” anthocyanin
produc-tion plus minor QTL or “modifiers.” nantA3alleles lower transcript levels ofb1as well as those of enzymatic genes involved in anthocyanin biosynthesis In the TC1study, we observed QTL for both
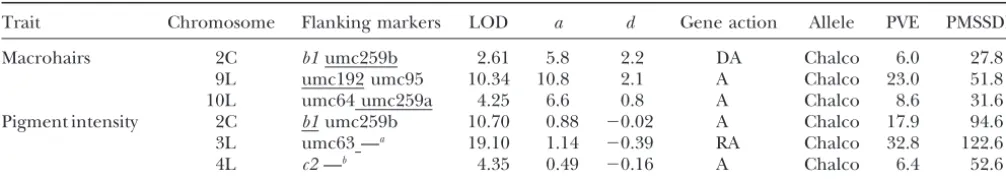
TABLE 3
QTL detected in the F2experiment
Trait Chromosome Flanking markers LOD a d Gene action Allele PVE PMSSDD
Macrohairs 2C b1umc259b 2.61 5.8 2.2 DA Chalco 6.0 27.8
9L umc192 umc95 10.34 10.8 2.1 A Chalco 23.0 51.8 10L umc64 umc259a 4.25 6.6 0.8 A Chalco 8.6 31.6 Pigment intensity 2C b1umc259b 10.70 0.88 ⫺0.02 A Chalco 17.9 94.6 3L umc63 —a 19.10 1.14 ⫺0.39 RA Chalco 32.8 122.6
4L c2—b 4.35 0.49 ⫺0.16 A Chalco 6.4 52.6
QTL positions are reported by chromosome with S and L indicating cytologically defined short and long arms and C denoting centromeric, as well as by the markers on each side of the LOD peak with the closer marker underlined. The peak LOD score under a hypothesis that allows both additive (a) and dominance (d) effects is given and those effect estimates are listed as trait unit contributions. Gene action is inferred fromd/a: recessive (R) is ford/a⬍ ⫺0.67, recessive to additive (RA) for⫺0.67⬎ d/a⬎ ⫺0.33, additive (A) for⫺0.33⬎d/a⬎0.33, dominant to additive (DA) for 0.33⬎d/a⬎0.67, and dominant (D) for d/a⬎ 0.67. The parental source of the allele, percentage of the phenotypic variance explained, and the percentage mean subspecies difference (PMSSD) are also listed for each QTL. PMSSD⫽100⫻[2a/MSSD]. The threshold LOD values for the two traits were 2.87 and 2.62, respectively.
aThe LOD curve is still rising at the terminal marker (see Figure 2). bNo markers flankingc2were mapped (see Figure 2).
and V.Chandler, personal communication). Thus, we and Balsas alleles such that the 3L QTL has only a small effect. However, the effects of this QTL are fully would expect an allelic difference at this candidate locus
to affect both aspects of sheath pigmentation pleiotropi- discernible in the F2since both homozygous classes are present. In fact, the Chalco allele of the 3L pigmentation cally.
The F2 study reaffirmed the presence of all three QTL has a strong and negative dominance deviation in the F2 population, meaning that it behaves recessively pigmentation intensity QTL that were observed in the
TC1study on chromosomes 2C (b1), 3L, and 4L (Tables relative to the Balsas allele (Table 3). This is consistent with our inference that thea3locus is allelic to this QTL. 2 and 3). Nevertheless, the inheritance of pigmentation
was not identical in the two populations. In the F2, the Epistatic interactions among QTL:We used two-way ANOVAs to test for interaction effects between the ma-3L QTL had the strongest additive effect and highest
PVE (33%), while theb1gene had a much smaller effect jor (9L) and minor (2C and 10L) macrohair QTL from the TC1study using the genotypes from markers closest and a PVE value of only 18%. By contrast, b1had the
strongest additive effect in the TC1, behaving like a to the three QTL. We observed interaction effects of five and six macrohairs for the 2C⫻9L and 10L⫻9L Mendelian locus, while the 3L QTL had only a modest
effect that we observed among plants carryingB1(Table combinations, respectively (P ⫽0.01,P⫽ 0.03). Since the 2C and 10L QTL have similar synergistic interactions 2). The 4L QTL had a similarly small effect in both
the F2 and the TC1. Thus, althoughb1 behaved like a with the 9L QTL and map between paralogous marker pairs in duplicated segments of the Zea genome (Table Mendelian locus or switch in the TC1, it behaved like
an intermediate effect QTL in the F2. 2; Figure 2;Helentjariset al.1988), it is quite possible that a pair of duplicate genes may underlie these QTL.
A QTL complementation test for a3: Our
chromo-some 3L QTL maps near the a3 locus, which acts as Therefore, a full factorial three-way ANOVA for mac-rohairs with three QTL was performed. Analyzed in this either a recessive intensifier or a dominant inhibitor of
anthocyanin production (StylesandCoe1986;Robi- way, the 9L⫻2C and 9L⫻10L interaction effects were both about eight macrohairs (Table 4), hinting that the
nettet al.1995). The coincident map positions suggest
that a3 and our 3L QTL may be allelic. We used an 2C and 10L QTL may have overlapping functions. The three-way ANOVA also shows that the epistatic effects a3 tester stock to investigate this hypothesis. This test
revealed that Balsas teosinte⫻tester stock and A158⫻ are nearly equivalent to the additive effect of the 9L QTL among individuals that do not carry Chalco alleles tester stock F1’s were all green sheathed, indicating that
Balsas teosinte and the A158 inbred line carry the domi- at either of these partner loci (Table 4). These inter-action effects are quite strong in the context of the mean nantA3allele, while Chalco teosinte⫻tester stock F1’s
were all red sheathed, indicating that Chalco teosinte difference between parental taxa (Table 1).
Epistatic interactions for macrohair QTL were also carries the recessivea3allele (Lauter2001). These data
offer a simple explanation for why the 3L QTL behaved suggested by the F2study. The difference between zero and two copies of the Chalco allele at the 2C QTL for so differently in the TC1 vs. the F2population. In the
TABLE 4
Macrohair QTL interact synergistically in the TC1population
Genotype at QTL Expected phenotype
Observed based on additive Nonadditive ANOVA effect 10L 2C 9L phenotype⫾SE QTL interactions interaction effect testP-value
B B B 1.2⫾1.7
C B B 3.9⫾1.6 ⬍0.001
B C B 3.5⫾1.7 ⬍0.001
C C B 5.5⫾1.4 6.2 ⫺0.7 0.171
B B C 10.9⫾1.8 ⬍0.001
C B C 21.9⫾1.9 13.6 ⫹8.3 0.017
B C C 21.7⫾1.6 13.2 ⫹8.5 0.014
C C C 26.8⫾1.7 15.9 ⫹11.9 0.267
Full factorial three-way ANOVA was used to tease apart the Chalco teosinte allelic effects. The genotypes are from the nearest flanking markers to the QTL, with B and C representing the Balsas teosinte/maize and Chalco teosinte/maize TC1genotypes, respectively. The observed phenotypes for the eight genotypic classes are ANOVA least-squares means of the number of macrohairs per count area. The expected phenotypes are computed by adding the single locus contributions to the baseline number of hairs. For example, the 10L⫹ 9L expectation is (3.9⫺1.2)⫹(10.9⫺1.2)⫹1.2⫽13.6 macrohairs. A positive number from (observed⫺ expected) indicates a synergistic or more-than-additive interaction.
9L QTL (t-testP⫽0.48), but accounts for a difference of and 10 were introgressed into maize A158 genetic back-ground so that their independent effects could be as-15 macrohairs among individuals carrying two copies
of the Chalco allele at the 9L QTL (t-test P ⫽ 0.03). sessed and their positions more finely mapped. Both the 9L and 10L QTL were able to evince statistically Interestingly, this apparent case of epistasis was not
sta-tistically significant in a two-way ANOVA, likely due to detectable phenotypic effects in A158 maize genetic background (Table 6; Figure 2). The positions of the the small numbers of F2plants in the most informative
marker-genotype classes. LOD peaks were consistent with the TC1and F2studies;
however, the use of additional RFLP markers (umc25 Epistatic interactions for sheath anthocyanin QTL
were also suggested by the F2study. Among plants car- andglossy15) in the 9L NIL improved the localization of the 9L QTL (Tables 2, 3, and 6; Figure 2). Interest-rying two Balsas alleles at the 3L QTL and thereby two
A3alleles, the phenotypes of individuals carrying zero, ingly, both the 9L and 10L QTL act in a more recessive manner in the NIL compared to the F2 (Tables 3 and one, and two copies of the ChalcoB1allele are
statisti-cally indistinguishable (Table 5). In contrast, the geno- 6). The fact that no effect was detected in either the 2C or the 5S NIL may result from an inability to exert type at theb1locus has a significant effect when even
onea3allele from the Chalco parent is present, demon- phenotypic effects without other Chalco teosinte QTL alleles or from a failure of the introgressed segment to strating an interaction effect (Table 5). Again, this
ap-parent case of epistasis was not statistically significant encompass the QTL (Figure 2).
Correlation of pigmentation and pubescence:Despite
in a two-way ANOVA, likely due to the small numbers
of F2 plants in the most informative marker-genotype the existence of TC1 and F2 plants with glabrous, pig-mented sheaths as well as hairy, unpigpig-mented sheaths, classes.
Macrohair QTL in NILs: Chalco teosinte alleles of two lines of evidence suggest that sheath pubescence
and pigmentation may not be entirely independently the sheath macrohair QTL on chromosomes 2, 5, 9,
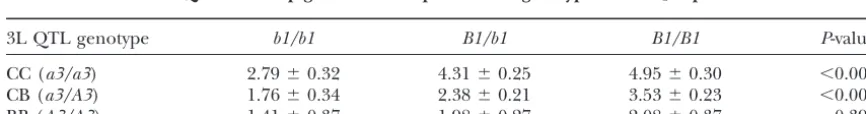
TABLE 5
The 3L QTL affects pigmentation response tob1genotype in the F2experiment
3L QTL genotype b1/b1 B1/b1 B1/B1 P-value
CC (a3/a3) 2.79⫾0.32 4.31⫾0.25 4.95⫾0.30 ⬍0.001
CB (a3/A3) 1.76⫾0.34 2.38⫾0.21 3.53⫾0.23 ⬍0.001
BB (A3/A3) 1.41⫾0.37 1.98⫾0.27 2.08⫾0.37 0.393
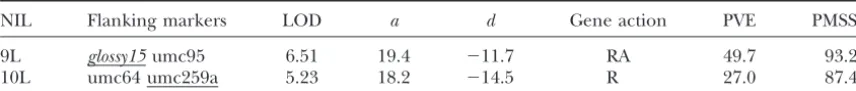
TABLE 6
Macrohair QTL detected in the NIL experiments
NIL Flanking markers LOD a d Gene action PVE PMSSD
9L glossy15umc95 6.51 19.4 ⫺11.7 RA 49.7 93.2
10L umc64 umc259a 5.23 18.2 ⫺14.5 R 27.0 87.4
The QTL position for each NIL is reported by the markers that flank the LOD peak, with the closer marker underlined. The peak LOD score under a hypothesis that allows both additive (a) and dominance (d) effects is given and those effect estimates are listed as trait unit contributions. Gene action is inferred from d/a: recessive (R) is ford/a⬍ ⫺0.67, recessive to additive (RA) for⫺0.67⬎d/a⬎ ⫺0.33, additive (A) for⫺0.33⬎ d/a⬎0.33, dominant to additive (DA) for 0.33⬎d/a⬎0.67, and dominant (D) ford/a⬎0.67. The parental source of the allele, percentage of the phenotypic variance explained, and the percentage mean subspecies difference (PMSSD) are also listed for each QTL. PMSSD⫽100⫻[2a/MSSD]. The threshold LOD values for the two studies were 1.99 and 1.90, respectively.
regulated. First, anthocyanin accumulation in the sub- types. Once these are identified, one could construct transgenic lines that differ for the relevant alleles and sidiary cells of macrohairs was commonly seen in
other-wise unpigmented upper portions of TC1, F2, and Chalco assay their fitness in warm vs. cool environments. A similar approach has proven informative for pollinator teosinte sheaths (Figure 1, e–g). Since subsidiary cells
are likely recruited by each macrohair via a non-cell- attraction QTL in Mimulus (SchemskeandBradshaw
autonomous mechanism (Lauter 2001), the unique 1999). Our identification of the major QTL for these presence of anthocyanins in these cells is suggestive traits is the first step toward this goal.
of an overlap between the regulation of anthocyanin Inheritance of quantitative trait differences:Our re-biosynthesis and macrohair formation. Second, sheath sults suggest that genetic control of the difference be-pubescence in the TC1population was significantly, al- tween the red and hairy sheaths of Chalco teosinte and though weakly, correlated with anthocyanin coverage green and glabrous sheaths of Balsas teosinte involves (r⫽0.16,P⫽0.006), but was not correlated with pig- a relatively small number of genes, a few of which have ment intensity (r⫽ ⫺0.08,P⫽0.313), despite the fact large phenotypic effects. These results as well as those that the two anthocyanin traits were well correlated (r⫽ of some other investigators who have used QTL map-0.47,P⬍0.001). If the basis for the correlation between ping to study morphologically divergent cross-compati-macrohairs and pigment coverage in the TC1study were ble taxa cannot be reconciled with a strict interpretation genetic, one might expect to detect QTL that pleiotropi- of the infinitesimal model for quantitative trait evolu-cally affect these traits without affecting anthocyanin tion (Fisher 1930). Oligogenic inheritance including intensity. Consistent with this possibility, the LOD peak some QTL of large effect has been inferred in multiple of the minor effect QTL on 2C that affects pigment crosses between crop plants and their wild relatives coverage, but not pigment intensity, is contained within (DoebleyandStec1993;CamargoandOsborn1996; the broad LOD peak of the sheath macrohair QTL on Grandilloand Tanksley1996), as well as in crosses
2C (Table 3; Figure 2). between natural species pairs(Vlotet al. 1992;
Brad-shawet al. 1995;HombergenandBachmann1995; Gai-ling et al. 1999), although more polygenic inheritance DISCUSSION has also been observed in other studies (Burkeet al.2002;
Fishmanet al.2002;WesterberghandDoebley2002). Previous studies in multiple plant species have shown
Although purely recessive QTL would have gone un-an association of both pigmentation un-and hairiness with
detected in our genome-wide TC1 study, it is unlikely cool temperatures (Daubenmire1947;Galinat1967;
that our results have substantially underestimated the
Carlquist 1974). Similarly, we note that Chalco
teo-number of QTL while simultaneously overestimating sinte plants of the relatively cool Mexican highlands
their effect magnitudes, as has been shown to be a poten-have increased pigmentation and pubescence on
verti-tial bias of standard interval mapping (Beavis 1994). cally oriented organs as compared to their lowland
Our TC1 study used composite interval mapping and Balsas teosinte counterparts. We suggest that these
char-analyzed contributions of dominance and epistasis. In acter states arose in Chalco teosinte because they
im-addition, the large effects of the major QTL detected prove metabolism and translocation by helping the
for each trait were also seen in subsequent experimental plants absorb and retain radiant energy, particularly at
populations (Tables 2, 3, and 6). dawn and dusk when the sun is low in the sky (see also
Epistatic contributions to morphological differences: Galinat1967;Doebley1984). Testing this hypothesis
The synergistic epistatic interactions among TC1 QTL would be facilitated by the identification of the genes
of the mean difference between parental taxa, demon- nents are separated either statistically by ANOVA (Table 4) or genetically by using NILs (Table 6), the single-strating how epistasis could make a significant
contribu-tion to morphological evolucontribu-tion (Tables 1, 4, and 5). copy effect of the Chalco 9L QTL allele is equivalent in the TC1and NIL studies and is considerably smaller Together with other QTL studies of morphological
dif-ferences that revealed epistatic interactions among QTL than its single-copy effect in the TC1 per se (Table 2), demonstrating how the presence of QTL alleles at other (DoebleyandStec1993;Bradshawet al. 1998;
Gai-linget al.1999), our results are congruent with models loci alters the degree of dominance for the 9L QTL allele.
that attribute a prominent role to epistasis in the control
of quantitative traits (LynchandWalsh1998). An evolutionary implication of this phenomenon is that novel alleles may arise with comparatively subtle or We observed more and stronger epistatic interactions
in the TC1 than in the F2 population. This difference cryptic phenotypic effects that can escape removal by purifying selection, giving them a chance to acquire may partly reflect the statistical limitations associated
with having fewer individuals spread over more geno- much stronger effects when combined with partner al-leles at other loci. Thus, synergistic epistatic interactions typic classes in the F2 population. However, epistatic
interactions typically seem to be more prominent when may be important for generating novel phenotypes us-ing alleles that already exist within a population, alleviat-examined in isogenic and foreign genetic backgrounds
(Doebleyet al. 1995;Longet al. 1995;EshedandZamir ing the need for the perfectly timed appearance of new alleles that significantly alter phenotypes on their own 1996;LukensandDoebley1999;KimandRieseberg
2001). An implication of this observation is that epistasis (LauterandDoebley2002).
Candidate genes and QTL functions:Our two
largest-may more strongly affect traits for which fewer genetic
differences are segregating. Consistent with this infer- effect QTL for sheath pigmentation appear to represent allelic differences atb1(2C) anda3(3L), both regula-ence, epistasis has not been detected in studies of
heter-osis, a trait that has many contributing genetic factors tors of anthocyanin biosynthesis in maize (Stylesand
Coe1986;Chandleret al. 1989;Robinettet al.1995). (Stuberet al. 1992;Xiao et al. 1995).
It has also been suggested that the role of epistasis is We associateb1with the 2C QTL since they cosegregate and since b1is known to control sheath pigmentation reduced as the genes in question become less directly
linked to the phenotype, such that epistasis is easier in maize (Radicellaet al.1992). We associatea3with the 3L QTL on the basis of our complementation tests. to detect for traits with fewer developmental pathways
feeding into them (ClarkandWang1997). This would Since both Balsas and Chalco teosinte are capable of producing anthocyanin, the allelic differences atb1are account for the difference in the levels of epistasis seen
between our studies of anthocyanins and epidermal likely cis-regulatory differences for the spatial distribu-tion of pigment rather than differences in protein func-hairs and studies of more complex traits like plant
height and yield (Edwards et al. 1992;Stuber1994). tion. We make this inference sinceb1is known to harbor sheath-specificcis-regulatory variants that confer distinct
Dominance and the creation of novel phenotypes:
Taken together, the F2 and NIL populations offer an spatial patterns of anthocyanin expression (Radicella
et al. 1992;SelingerandChandler1999). Becausea3 opportunity to compare dominance effects of the
Chalco alleles in maize-teosintevs.maize genetic back- has not yet been cloned and characterized, there is no adequate foundation from which to predict the nature grounds. The 9L and 10L QTL were detected in the
TC1population, suggesting that the Chalco alleles have of the functional difference between the Balsas and Chalco alleles.
additive or dominant modes of gene action (Table 2).
The F2 results affirmed this hypothesis, showing large One minor-effect QTL (4L) for sheath pigmentation in teosinte may represent allelic differences atcolorless2 additive effects and a positive dominance deviation for
both of these QTL (Table 3). Nevertheless, the NIL (c2), which encodes an enzymatic step (chalcone syn-thase) in anthocyanin biosynthesis (Wienandet al.1986). experiments indicated that Chalco alleles at both of
these QTL have more recessive modes of action in maize We make this inference since our QTL maps near c2 (Figure 2). Since the 4L QTL affects pigment intensity genetic background as indicated by negative dominance
deviations (Table 6). but not coverage (spatial distribution), an allelic
differ-ence at this enzymatic gene might involve either protein Genetic background has been shown to affect the
degree of dominance of QTL in other maize-teosinte function or concentration, rather than its spatial expres-sion pattern.
experiments.Doebley et al. (1995) demonstrated for
two QTL affecting plant and inflorescence architecture For macrohair QTL, we associate our major QTL on 9L with the maize mutantmacrohairless1(mhl1;Moose
that the teosinte alleles behaved more dominantly in
teosinte genetic background and more recessively in et al.2004). We make this inference principally because mhl1is located within the narrowest interval to which the maize genetic background. QTL ⫻ QTL interactions
such as those detected in our TC1experiment represent 9L QTL was localized (Table 6). However, the nature of the phenotypic differences controlled by this QTL and a mechanism that could explain such a shift in mode
enable us to make a more explicit prediction about
ering time inBrassica oleracea.Theor. Appl. Genet.92:610–616. the underlying gene. Specifically, both maizemhl1and Carlquist, S., 1974 Island Biology. Columbia University Press, New ArabidopsisGLABROUS1(GL1) mutants have initiation- York.
Chandler, V. L., J. P. Radicella, T. P. Robbins, J. ChenandD.
specific defects (variants) that block medial laminar,
Turks, 1989 Two regulatory genes of the maize anthocyanin but not marginal laminar trichome formation (Herman pathway are homologous: isolation ofbutilizingrgenomic
se-andMarks1989;Mooseet al.2004). Similarly, our 9L quences. Plant Cell1:1175–1183.
Churchill, G. A., andR. W. Doerge, 1994 Empirical threshold QTL affects medial but not marginal trichome
forma-values for quantitative trait mapping. Genetics138:963–971. tion. Thus, it seems plausible that the 9L QTL is a maize Clark, A. G., andL. Wang, 1997 Epistasis in measured genotypes:
homolog ofGL1. DrosophilaP-element insertions. Genetics147:157–163.
Daubenmire, R., 1947 Plants and Environment: A Textbook of Plant
Knowledge of the molecular genetic basis of trichome
Autecology. John Wiley & Sons, New York.
development in Arabidopsis may also help explain the Doebley, J., 1984 Maize introgression into teosinte—a reappraisal. epistatic interactions among QTL that we observed. Tri- Ann. Mo. Bot. Gard.71:1100–1113.
Doebley, J., andA. Stec, 1993 Inheritance of the morphological chome initiation in Arabidopsis is regulated by MYB
differences between maize and teosinte: comparison of results (GL1), bHLH (GL3), and WD40 (TTG) repeat con- for two F2populations. Genetics134:559–570.
taining proteins (Oppenheimeret al. 1991;Walker et Doebley, J., A. StecandC. Gustus, 1995 teosinte branched1and the origin of maize: evidence for epistasis and the evolution of al.1999;Payneet al.2000). GL1 and GL3 proteins form
dominance. Genetics141:333–346.
a MYB-bHLH complex that requires a WD40 repeat Edwards, M. D., T. Helentjaris, S. WrightandC. W. Stuber, 1992 protein to confer wild-type trichome densities (Payne Molecular marker facilitated investigations of quantitative trait
loci. Theor. Appl. Genet.83:765–774. et al.2000). The dependence of high trichome density
Eshed, Y., andD. Zamir, 1996 Less-than-additive epistatic interac-on the formatiinterac-on of a multimeric protein complex could tions of quantitative trait loci in tomato. Genetics143:1807–1817. form the basis for synergistic genetic interactions among Fisher, R. A., 1930 The Genetical Theory of Natural Selection. Clarendon
Press, Oxford. loci that promote trichome initiation, similar to what
Fishman, L., A. J. KellyandJ. H. Willis, 2002 Minor quantitative was seen between sheath macrohair QTL. Given their trait loci underlie floral traits associated with mating system diver-dominant modes of action in teosinte genetic back- gence inMimulus.Evolution56:2138–2155.
Gailing, O., E. J. HombergenandK. Bachmann, 1999 QTL map-ground and their capabilities to interact more than
addi-ping reveals specific genes for the evolutionary reduction of mi-tively, it would not be surprising if the 9L, 2C, and 10L crosporangia inMicroseris(Asteraceae). Plant Biol.1:219–225. QTL encoded macrohair initiation regulators homolo- Galinat, W., 1967 Plant habit and the adaptation of corn. Mass.
Agric. Exp. Stn. Bull.565:1–16. gous to Arabidopsis trichome regulatory genes.
Grandillo, S., andS. D. Tanksley, 1996 QTL analysis of horticul-We thank Justin Thomas and Steve Bull for technical assistance; tural traits differentiating the cultivated tomato from the closely related speciesLycopersicon pimpinellifolium.Theor. Appl. Genet. Gib Ahlstrand for assistance with cryofixation and SEM; and the
Uni-92:935–951. versity of Missouri-Columbia RFLP laboratory, Eric Grotewold,
Mar-Helentjaris, T., D. WeberandS. Wright, 1988 Identification of cela Hernandez, Jerry Kermicle, and Bob Schmidt for providing clones
the genomic locations of duplicate nucleotide sequences in maize or seed. This research and N.L. were supported by the Charles Brand
by analysis of restriction fragment length polymorphisms. Genet-and Doctoral Dissertation Fellowships from the University of
Minne-ics118:353–363.
sota, National Institutes of Health grant GM-58816, and National Herman, P. L., andM. D. Marks, 1989 Trichome development in Science Foundation grant DEB-9509074. A.W. was supported by a Arabidopsis thaliana. II. Isolation and complementation of the fellowship from the Swedish Council for Forestry and Agricultural GLABROUS1gene. Plant Cell1:1051–1055.
Research. Holton, T. A., andE. C. Cornish, 1995 Genetics and biochemistry of anthocyanin biosynthesis. Plant Cell7:1071–1083.
Hombergen, E. J., andK. Bachmann, 1995 RAPD mapping of three QTL determining trichome formation inMicroserishybrid H27. Theor. Appl. Genet.90:853–858.
LITERATURE CITED
Kim, S.-C., andL. H. Rieseberg, 2001 The contribution of epistasis to species differences in annual sunflowers. Mol. Ecol.10:683–
Ahlstrand, G. G., 1996 Low temperature low voltage scanning
elec-690. tron microscopy of uncoated frozen biological materials: a simple
Lander, E. S., P. Green, J. Abrahamson, A. Barlow, M. Dalyet al., alternative. Proceedings of Microscopy and Microanalysis, San
1987 MAPMAKER: an interactive computer package for con-Francisco, pp. 918–919.
structing primary genetic linkage maps of experimental and
natu-Basten, C., B. WeirandZ-B. Zeng, 2000 QTL Cartographer Version
ral populations. Genomics1:174–181.
1.14: A Reference Manual and Tutorial for QTL Mapping. Program
Lauter, N., 2001 The inheritance and evolution of quantitative in Statistical Genetics, Department of Statistics, North Carolina
traits in teosinte. Ph.D. Dissertation, University of Minnesota, St. State University, Raleigh, NC.
Paul.
Beavis, W., 1994 The power and deceit of QTL experiments: lessons
Lauter, N., andJ. Doebley, 2002 Genetic variation for phenotypi-from comparative QTL studies. Proceedings of the Annual Corn
cally invariant traits detected in teosinte: implications for the and Sorghum Research Conference, Chicago, Vol. 49, pp. 250–
evolution of novel forms. Genetics160:333–342. 266.
Long, A. D., S. L. Mullaney, L. A. Reid, J. D. Fry, C. H. Langley Bradshaw, H. D., S. M. Wilbert, K. G. OttoandD. W. Schemske,
et al., 1995 High resolution mapping of genetic factors affecting 1995 Genetic mapping of floral traits associated with
reproduc-abdominal bristle number in Drosophila melanogaster. Genetics tive isolation inMimulus.Nature376:762–765.
139:1273–1291.
Bradshaw, H. D., K. G. Otto, B. E. Frewen, J. K. McKayandD. W.
Schemske, 1998 Quantitative trait loci affecting differences in Lukens, L. N., andJ. Doebley, 1999 Epistatic and environmental interactions for quantitative trait loci involved in maize evolution. floral morphology between two species of monkeyflower
(Mimu-lus). Genetics149:367–382. Genet. Res.74:291–302.
Lynch, M., andJ. B. Walsh, 1998 Genetics and Analysis of Quantitative Burke, J. M., S. Tang, S. J. KnappandL. H. Rieseberg, 2002 Genetic
Mackay, T. F. C., 2001 The genetic architecture of quantitative Stuber, C. W., S. E. Lincoln, D. W. Wolff, T. Helentjarisand
E. S. Lander, 1992 Identification of genetic factors contributing traits. Annu. Rev. Genet.35:303–339.
Moose, S., N. LauterandS. Carlson, 2004 The maizemacrohair- to heterosis in a hybrid from two elite maize inbred lines using molecular markers. Genetics132:823–839.
less1locus specifically promotes leaf blade macrohair initiation
in response to factors regulating leaf identity. Genetics166:1451– Styles, E., andE. Coe, 1986 Unstable expression of anRallele with
a3in maize. J. Hered.77:389–393. 1461.
Oppenheimer, D. G., P. L. Herman, J. Esch, S. Sivakumaranand Szymanski, D., A. M. LloydandM. D. Marks, 2000 Progress in the molecular genetic analysis of trichome initiation and
morpho-M. D. Marks, 1991 A myb-related gene required for leaf
tri-chome differentiation in Arabidopsis is expressed in stipules. Cell genesis inArabidopsis.Trends Plant Sci.5:214–219.
Vlot, E. C., W. Van Houten, S. MautheandK. Bachmann, 1992 67:483–493.
Payne, C. T., F. ZhangandA. M. Lloyd, 2000 Gl3encodes a bHLH Genetic and non-genetic factors influencing deviations from five pappus parts in a hybrid betweenMicroseris douglasiiandM.
bigelo-protein that regulates trichome development in Arabidopsis
through interaction with GL1 and TTG1. Genetics156:1349– vii.Int. J. Plant Sci.153:89–97.
Walker, A. R., P. A. Davison, A. C. Bolognesi-Winfield, C. M.
1362.
Radicella, J. P., D. Brown, L. A. TolarandV. L. Chandler, 1992 James, N. Srinivasanet al., 1999 TheTRANSPARENT TESTA GLABRA1locus, which regulates trichome differentiation and Allelic diversity of the maize b regulatory gene: different leader
and promoter sequences of twob1alleles determine distinct tissue anthocyanin biosynthesis inArabidopsis, encodes a WD40 repeat containing protein. Plant Cell11:1337–1349.
specificities of anthocyanin production. Genes Dev.6:2152–2164.
Robinett, D., E. CoeandK. Cone, 1995 Map location ofanthocya- Westerbergh, A., andJ. Doebley, 2002 Morphological traits
defin-nin3.Maize Genet. Coop. News Lett.69:46. ing species differences in wild relatives of maize are controlled
Schemske, D. W., andH. D. Bradshaw, Jr., 1999 Pollinator prefer- by multiple quantitative trait loci. Evolution56:273–283. ence and the evolution of floral traits in monkeyflowers (Mimu- Wienand, U., U. Weydemann, U. Niesbach-Klosgen, P. Peterson lus). Proc. Natl. Acad. Sci. USA96:11910–11915. andH. Saedler, 1986 Molecular cloning of thec2locus ofZea Selinger, D., andV. L. Chandler, 1999 Major recent and indepen- mays, the gene coding for chalcone synthase. Mol. Gen. Genet.
dent changes in levels and patterns of expression have occurred 203:202–207.
at theb1gene, a regulatory locus in maize. Proc. Natl. Acad. Sci. Xiao, J., J. Li, L. YuanandS. D. Tanksley, 1995 Dominance is the USA96:15007–15012. major genetic basis of heterosis in rice as revealed by QTL analysis
Stuber, C. W., 1994 Success in the use of molecular markers for using molecular markers. Genetics140:745–754. yield enhancement in corn. Proceedings of the Annual Corn and