A Case Study on Effects of Low Pass Filtering
over Facial Image Processing and Proper Edge
Detections
Dibyendu Sur 1, Sayanti Rudra 2, Srijita Mitra 2, Saikat Mitra 2
Assistant Professor, Department of Electronics and Instrumentation Engineering, Narula Institute of Technology, West
Bengal, India1
U.G. Student, Department of Electronics and Instrumentation Engineering, Narula Institute of Technology, West
Bengal, India 2
ABSTRACT: The proper information extraction from a digitized photo of human face has a great necessity in today’s
research work. Different types of high frequency noises must be removed in order to get smooth and ideal information from the picture. The choice of correct low pass filter is important in order to remove significant amount of high frequency noise components without affecting the facial information in the image. A case study has been performed with several low pass filtering techniques in order to suggest the probable better filtering techniques for different types of noises in different circumstances. The variations of different filter performances alongside their dimensions are also addressed in this paper.
KEYWORDS: Low Pass Filter, Mean Filter, Median Filter, Wiener filter, Gaussian Noise, Salt and Pepper Noise,
Poisson Noise.
I. INTRODUCTION
Information extraction from a digitized image of human face is one of the important applications in the recent digital image processing field. After acquiring a digitized image, several noises can attenuate the image and degrade its quality. Noise is a high frequency component to an image. The variation of its amplitude with respect to unit space is higher than the other pixels or regions of the image. A suitable low pass filter technique should be involved into this process in order to remove the noises without affecting or degrading the quality of the image. Degradation of the quality of the image involved loss of sharpness, removal of important edge or line information from the image while the filtering is in progress. Careful observation and choice of low pass filter with measured dimension is the key to achieve next to perfect reconstruction of the image free from noises. In this paper, case studies between different types of low pass filter with different dimension are examined for digitized human face images in order to suggest the better alternative for specific situations. Different types of noises are also addressed by this case study. Effects of these filtering over proper recovery of edges and lines in the image will also be monitored.
II. RELATED AND PREVIOUS WORK
In this case study process, the noises which will be addressed are 1) Gaussian Noise, 2) Salt and Pepper Noise, 3) Poisson Noise and 4) Speckle Noise.
ISSN(Online) : 2319-8753 ISSN (Print) : 2347-6710
I
nternational
J
ournal of
I
nnovative
R
esearch in
S
cience,
E
ngineering and
T
echnology
(An ISO 3297: 2007 Certified Organization)
Vol. 5, Issue 7, July 2016
is normally accredited as ‘salt’ whereas the minimum gray level is accredited as ‘pepper’ [2][3]. This highly fluctuating intensity variation noise can be helpful to study the effects of different type of low pass filtering in the noise attenuated digitized image. This noise is generated due to imperfect analog to digital conversion of images [4]. Poisson noise or shot noise is generated due to variation of quantum photon while generating the image. This noise obeys the Poisson distribution [4][5]. Speckle noise is a noise with multiplicative nature and can be seen in laser and radar operations [4][5]. Application of filters with images attenuated by one of these pre-mentioned noises will be observed and the effects of the filter operations with the variations of filter dimensions will also be notified.
Low pass filtering in digital images perform image smoothing, blurring. The sharp colour variation in RGB colour image and sharp variation of gray level in gray images per unit space provides high frequency region in that image. After suitable application of low pass filter towards that image, the sharp variation of gray level become smooth and the high contrasting regions (edge, line or isolated points) become blurred. Low pass filter is also used for reducing the contrast of the images. Some low pass filters are used to remove isolated and unwanted points. It is the choice of particular filter for particular problem which is the key to get the better results. In order to inspect the performances of different low pass filters in different ambient conditions, three types of low pass filters are chosen for this case study, 1) Linear mean or averaging filter, 2) Median filter and 3) Adaptive filter.
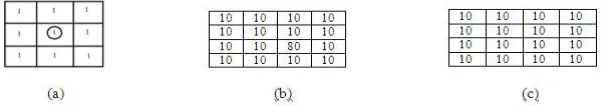
1) Linear mean or averaging filter: This filter performs the average of the surrounding pixels and places the final result into the target pixel. The averaging process transforms a sharp variation of gray levels into a smooth and slow variation of gray levels. In Fig. 1(a), a low pass averaging filter mask with 3×3 dimension. A 7×7 sized gray image has been shown in Fig. 1(b). The gray pixel values vary from 0 (black) to 100 (white). It can be clearly understood that the image has sharp vertical edge. After the image is being scanned or convoluted with the low pass averaging filter mask and replace the average values to the image, the sharp variation (from gray value 10 to 80) has been reduces and the resultant image is shown in Fig. 1(c).
Fig. 1. (a) 3×3 mask mean filter (b) Gray image with sharp vertical edge (c) Gray image after smoothing by mean low pass filter.
2) Median filter: In this filter, median values of the gray level are used rather than mean or average value. The median of the neighbour pixels is the resultant gray level of the concerned pixel. Thus the final pixel value is free from extreme gray level variations due to some isolated pixels. This filter is thus used to remove isolated or spurious points from the system. Fig. 2(a) shows a 3×3 dimension median filter. Fig. 2(b) shows a 4×4 gray image with an isolated spurious point. That point is removed after scanning by the median filter and the result is shown in Fig. 2(c).
Fig. 2. (a) 3×3 mask median filter (b) Gray image with isolated spurious point (c) Gray image isolated point removal by median low pass filter.
Fig. 3. (a) original RGB image1 (b) Gray version of image1 (c) original RGB image2 (d) Gray version of image2.
Next, these gray images are attenuated with zero mean 0.01 variance Gaussian noise. The resultant images are shown in Fig.4 (a) for image1 and 6(a) for image2. These noise attenuated images are then channelized through different type of noise reducing low pass filters. The effects for the respective images are shown in other figures of Fig. 4 and Fig. 6. The outcome images (for both image1 and image2) from 5×5 and 11×11 dimensioned filters are then transformed into edge detected image by suitable Sobel’s edge detection operator. The respective Sobel’s edge detected images are shown in Fig. 5 for image1 and Fig. 7 for image2.
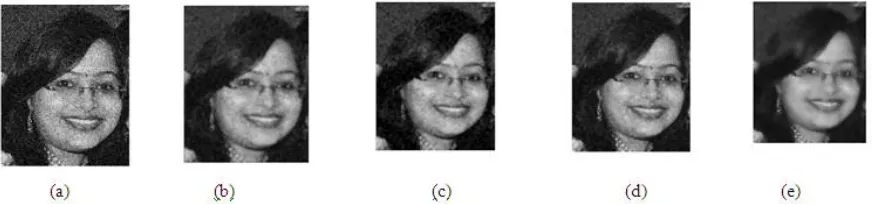
Fig. 4. (a) Gaussian noise attenuated gray image1 (b) image1 after 5×5 mean filtering (c) image1 after 5×5 median filtering (d) image1 after 5×5 adaptive Wiener filtering (e) image1 after 11×11 adaptive Wiener filtering
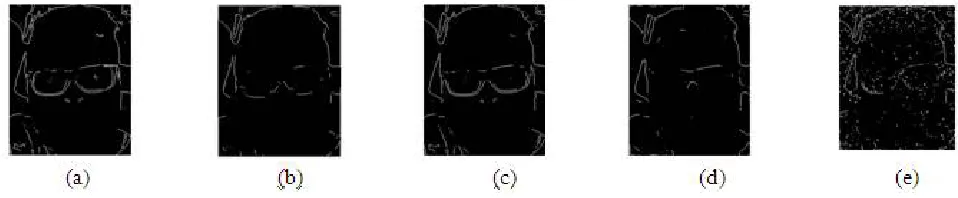
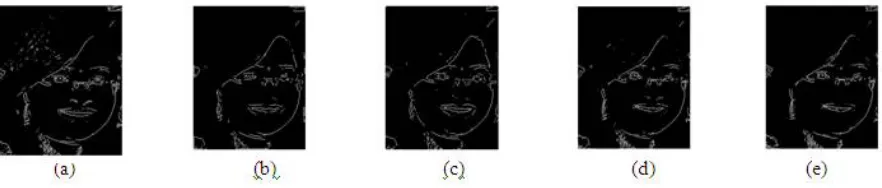
Fig. 5. (a) Edge detected image of Image1 before addition of Gaussian noise (b) Image after edge detection of 5×5 dimension mean filtered output from gray version of image1 (c) Image after edge detection of 5×5 dimension median filtered output from gray version of image1 (d) Image after
ISSN(Online) : 2319-8753 ISSN (Print) : 2347-6710
I
nternational
J
ournal of
I
nnovative
R
esearch in
S
cience,
E
ngineering and
T
echnology
(An ISO 3297: 2007 Certified Organization)
Vol. 5, Issue 7, July 2016
Fig. 6. (a) Gaussian noise attenuated gray image2 (b) image2 after 5×5 mean filtering (c) image2 after 5×5 median filtering (d) image2 after 5×5 adaptive Wiener filtering (e) image2 after 11×11 adaptive Wiener filtering
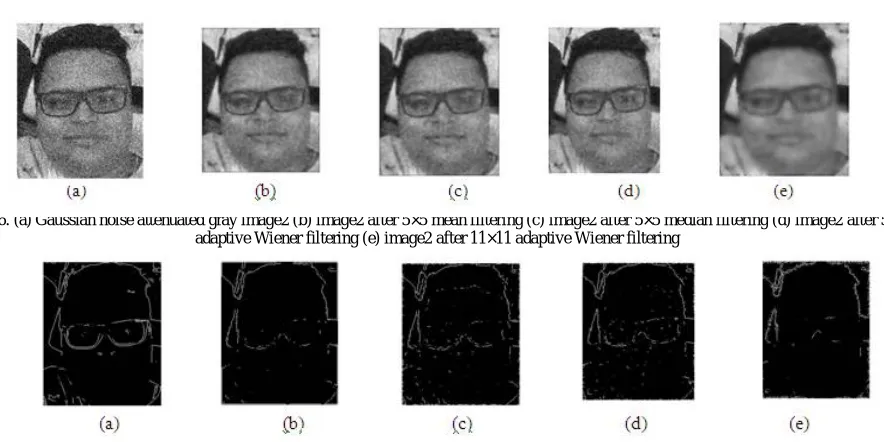
Fig. 7. (a) Edge detected image of Image2 before addition of Gaussian noise (b) Image after edge detection of 5×5 dimension mean filtered output from gray version of image2 (c) Image after edge detection of 5×5 dimension median filtered output from gray version of image2 (d) Image after
edge detection of 5×5 dimension Wiener filtered output from gray version of image2 (e) Image after edge detection of 11×11 dimension Wiener filtered output from gray version of image2
From the comparisons, it can be observed that for same dimension filtering, mean filtering provides better noise reduction to the image. But mean filtering also adds additional blurring to the system which is its disadvantage. From these comparisons, it can be concluded that adaptive Wiener filtering provides the better noise reduction without blurring the image. The increment in dimension (from 5×5 to 11×11) for Wiener filtering causes additional blurring to the images. This blurring may help reducing further Gaussian noises but this causes loss of significant information of the images.
The effect of extra-blurring can be inspected in terms of edge detection. The high frequency edges in the images are always affected by the blurring or smoothing process. The edge detected original gray images are shown in Fig. 5(a) and Fig. 7(a) for image1 and image2 respectively. From the inspection of Fig. 5(b) and Fig. 7(b), it can be concluded that the original edges which do not belong to noise, are also removed by mean filtering in the process of noise reduction. The adaptive wiener filtering produces the better result in terms of noise reduction as well as protecting edge information of the images (Fig. 5(d) and Fig. 7(d)). But the increment in higher dimension (from 5×5 to 11×11) adds additional blurring to the system (Fig. 5(e) and Fig. 7(e)). This causes loss of image information.
III.EFFECTS OF DIFFERENT FILTERS TOWARDS SALT AND PEPPER NOISE
Fig. 8. (a) Salt and Pepper noise attenuated gray image1 (b) image1 after 5×5 mean filtering (c) image1 after 5×5 median filtering (d) image1 after 11×11 median filtering (e) image1 after 5×5 adaptive Wiener filtering
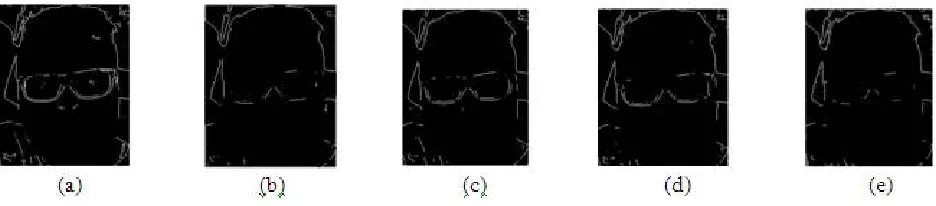
Fig. 9. (a) Edge detected image of Image1 before addition of Salt and Pepper noise (b) Image after edge detection of 5×5 dimension mean filtered output from gray version of image1 (c) Image after edge detection of 5×5 dimension median filtered output from gray version of image1 (d) Image after edge detection of 11×11 dimension median filtered output from gray version of image1 (e) Image after edge detection of 5×5 dimension Wiener
filtered output from gray version of image1
Fig. 10. (a) Salt and Pepper noise attenuated gray image2 (b) image2 after 5×5 mean filtering (c) image2 after 5×5 median filtering (d) image2 after 11×11 median filtering (e) image2 after 5×5 adaptive Wiener filtering
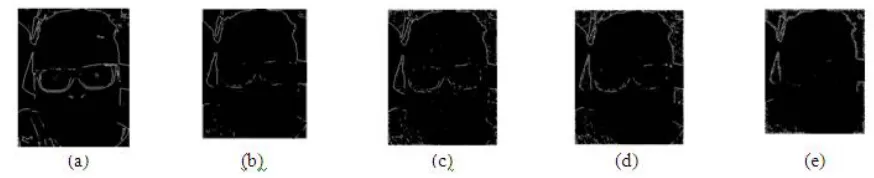
Fig. 11. (a) Edge detected image of Image2 before addition of Salt and Pepper noise (b) Image2 after edge detection of 5×5 dimension mean filtered output (c) Image2 after edge detection of 5×5 dimension median filtered output (d) Image2 after edge detection of 11×11 dimension median filtered
output (e) Image2 after edge detection of 5×5 dimension Wiener filtered output.
ISSN(Online) : 2319-8753 ISSN (Print) : 2347-6710
I
nternational
J
ournal of
I
nnovative
R
esearch in
S
cience,
E
ngineering and
T
echnology
(An ISO 3297: 2007 Certified Organization)
Vol. 5, Issue 7, July 2016
demonstrated by Fig. 8(b) and Fig. 10(b). The necessary edge information is also lost after mean filtering. This can be shown by Fig. 9(b) and Fig. 11(b). From Fig. 8(e) and Fig. 10(e), it can be notified that adaptive Wiener filter provides least and inadequate filtering towards salt and pepper noise. From Fig. 8(c) and Fig. 10(c) it can be shown that median filter provides adequate and necessary filtering in order to remove salt and pepper noise. The reason why median filter works better in case of salt and pepper noise lies within the fact that salt and pepper noise adds extreme values of pixels in the image, either a pixel with extreme white or pixel with extreme black. The median filter always removes spurious and isolated points whose gray level differs a lot from the neighbour pixel points. Thus median filter works better in case of salt and pepper noise attenuated image. From Fig. 9(c) and Fig. 11(c) it can be summarized that median filter also preserves all the edge information. From Fig. 8(d) and Fig. 10(d), it can be shown that increasing dimension to the filter can add extra smoothing or blurring to the images. This will also remove necessary high frequency edge or line information (shown in Fig. 9(d) and Fig. 11(d)). Thus a proper dimensioned median filter can be an ideal solution towards salt and pepper noise in an image.
IV.EFFECTS OF DIFFERENT FILTERS TOWARDS POISSON NOISE
Gray images image1 and image2 will now be used to inspect effects of different low pass filters towards Poisson noise in an image. The noise is added to the images and the noise has also been reduced by different filters. The effects for image1 and image2 have been shown in Fig. 12 and Fig. 14 respectively. The Sobel’s edge detected images are also tabulated in Fig. 13 and Fig. 15 respectively for image1 and image2 from the outputs of different filters.
Fig. 12. (a) Poisson noise attenuated gray image1 (b) image1 after 5×5 mean filtering (c) image1 after 5×5 median filtering (d) image1 after 5×5 adaptive Wiener filtering (e) image1 after 11×11 adaptive Wiener filtering
Fig. 13. (a) Edge detected image of Image1 before addition of Poisson noise (b) Image1 after edge detection of 5×5 dimension mean filtered output (c) Image1 after edge detection of 5×5 dimension median filtered output (d) Image1 after edge detection of 5×5 dimension Wiener filtered output (e)
Fig. 14. (a) Poisson noise attenuated gray image2 (b) image2 after 5×5 mean filtering (c) image2 after 5×5 median filtering (d) image2 after 5×5 adaptive Wiener filtering (e) image2 after 11×11 adaptive Wiener filtering
Fig. 15. (a) Edge detected image of Image2 before addition of Poisson noise (b) Image2 after edge detection of 5×5 dimension mean filtered output (c) Image2 after edge detection of 5×5 dimension median filtered output (d) Image2 after edge detection of 5×5 dimension Wiener filtered output (e)
Image2 after edge detection of 11×11 dimension Wiener filtered output
From Fig. 12 and Fig. 14, it can be shown that the adaptive Wiener filter reproduces the original image better than the other filters (Fig. 12(d) and Fig. 14(d)). The output from 5×5Wiener filter is much more prominent than the outputs of other filters with same dimension. Mean filter adds extra blurring to the system causing distortion towards the true edges and lines of the image (Fig. 12(b) and Fig. 14(b)). In case of Wiener filtering, increment of dimension also adds extra smoothing or blurring to the system which is disadvantageous towards faithful reproduction of original image from Poisson noise (Fig. 12(e) and Fig. 14(e)). After proper inspection of edge detected images from the outputs of different filters (Fig. 13 and Fig. 15), it has been justified that Wiener filter provides better filtering without adding too much blurring to the system for 5×5 masking (Fig. 13(d) and Fig. 15(d)). The true edges of the images have been lost after using the averaging filters (Fig. 13(b) and Fig. 15(b)). Edges can also be lost if the dimension of the filter gets increased (Fig. 13(e) and Fig. 15(e)).
V. EFFECTS OF DIFFERENT FILTERS TOWARDS SPECKLE NOISE
ISSN(Online) : 2319-8753 ISSN (Print) : 2347-6710
I
nternational
J
ournal of
I
nnovative
R
esearch in
S
cience,
E
ngineering and
T
echnology
(An ISO 3297: 2007 Certified Organization)
Vol. 5, Issue 7, July 2016
Fig. 16. (a) Speckle noise attenuated gray image1 (b) image1 after 5×5 mean filtering (c) image1 after 5×5 median filtering (d) image1 after 5×5 adaptive Wiener filtering (e) image1 after 11×11 adaptive Wiener filtering
Fig. 17. (a) Edge detected image of Image1 before addition of Speckle noise (b) Image1 after edge detection of 5×5 dimension mean filtered output (c) Image1 after edge detection of 5×5 dimension median filtered output (d) Image1 after edge detection of 5×5 dimension Wiener filtered output (e)
Image1 after edge detection of 11×11 dimension Wiener filtered output
Fig. 18. (a) Speckle noise attenuated gray image2 (b) image2 after 5×5 mean filtering (c) image2 after 5×5 median filtering (d) image2 after 5×5 adaptive Wiener filtering (e) image2 after 11×11 adaptive Wiener filtering
Fig. 19. (a) Edge detected image of Image2 before addition of Speckle noise (b) Image2 after edge detection of 5×5 dimension mean filtered output (c) Image2 after edge detection of 5×5 dimension median filtered output (d) Image2 after edge detection of 5×5 dimension Wiener filtered output (e)
From analysing Fig. 16 and Fig. 18 it can be observed that the noises are reduced better in mean filtering. But it adds extra smoothing or blurring to the images (Fig. 16(b) and Fig. 18(b)). The output of the Wiener filter is more prominent than the other filter as this filter adds less amount of blurring to the images (Fig. 16(d) and Fig. 18(d)). But if the dimensions are increased, this filter also adds blurring to the images. So a proper choice of dimension to the filter is important (Fig. 16(e) and Fig. 18(e)). After analysing the Sobel’s edge detected images after filtering, this can also be demonstrated that mean filter removes maximum Speckle noise but adds smoothing which in turns, removes true edges of the images (Fig. 17(b) and Fig. 19(b)). Median and Wiener filter preserves true edges and lines at the output images (Fig. 17(c), Fig. 17(d), Fig. 19(c) and Fig. 19(d)). The addition in dimensions reduces sharpness of the images and true high frequency components like edges, lines may be lost at the output images from the filter (Fig. 17(e) and Fig. 19(e)).
VI. CONCLUSION
After processing through a set of case studies with different types of noises alongside different types and dimensioned filters, it has been observed that filter with proper type and dimension is essential towards successful noise reduction from the image without reducing the sharpness of the image. Mean filtering effectively reduces noises from the image but significantly added blurring to the image, causing reduction of image sharpness. Adaptive Wiener filter works better than the other filters tested in this paper for most cases with proper noise reduction and proper sharpness preservation. Median filter works better than the other filters analysed in this paper for Salt and Pepper noise. The increment of dimensions adds loss of true edges and lines and reduces sharpness of the image though it helps us reduce noise more than the lower dimensioned filters.
REFERENCES
[1] T. Barbu, “Variational Image Denoising Approach with Diffusion Porous Media Flow,” Abstract and Applied Analysis, vol. 2013, Article ID 856876, 8 pages, 2013.
[2] Jayaraman et al., Digital Image Processing. Tata McGraw Hill Education. p. 272. ISBN 9781259081439, 2009.
[3] Philippe Cattin (2012-04-24). "Image Restoration: Introduction to Signal and Image Processing". MIAC, University of Basel. 11 October 2013.
[4] A. K. Boyat and B. K. Joshi, “A Review Paper: Noise Models in Digital Image Processing”, Signal & Image Processing : An International Journal (SIPIJ) Vol.6, No.2, pp 63-75, April 2015.
[5] R. Verma and J. Ali, “A Comparative Study of Various Types of Image Noise and Efficient Noise Removal Techniques”, International Journal of Advanced Research in Computer Science and Software Engineering, Volume 3, Issue 10, pp 617-622, October 2013.
[6] Z. Azimifar, P. Fieguth, and E. Jernigan, “Wavelet shrinkage with correlated wavelet coefficients,” in Proc. IEEE International Conference on Image Processing, Greece, pp. 162-165, 2001.
[7] I. E. Sobel, “Camera Models and Machine Perception,” Stanford Doctoral Dissertation, 1970.
[8] J. F. Canny, “A computational approach to edge detection”, IEEE Transaction on Pattern Analysis and Machine, Intelligence, PAMI-8, pp. 679-714, 1986.
[9] R.P. Poudel, J. J. Zhang, D.Liu, H. Nait-Charif, H. Nait-Charif, “Skin Color Detection Using Region-Based Approach”, International Journal of Image Processing, Vol.7, Issue 4, pp. 385-394, 2013.
[10] S. Shrestha, "Image Denoising Using New Adaptive Based Median Filter", Signal & Image Processing : An International Journal (SIPIJ) Vol.5, No.4, pp. 1-13, August 2014 .
[11] M. Gabbouj, E. J. Coyle, N. C. Gallagher, Jr., “An Overview of Median and Stack Filtering”, Circuits Systems Signal Process, Vol. 11, No. 1, pp. 7-45, 1992.
[12] M.R. Rakesh, B. Ajeya B, A.R. Mohan, “Hybrid Median Filter for Impulse Noise Removal of an Image in Image Restoration”, Vol. 2, Issue 10, pp. 5117-5124, October 2013.